Gene dosage and protein valency impact phase separation and fungal cell fate
Collin Ganser, Peiling He, Corey Frazer, Damian J. Krysan, Richard J. Bennett

TL;DR
This study shows how gene dosage and protein interaction capacity affect cell fate decisions in the fungus Candida albicans by influencing phase separation.
Contribution
The study reveals that altering gene dosage and protein valency can modulate phase separation and cell fate in Candida albicans.
Findings
Loss of one WOR1 allele nearly blocks opaque cell formation, highlighting its central role.
Increasing Wor1 valency enhances phase separation and switching frequency by up to 100-fold.
Gene dosage and valency changes impact cell fate through condensate formation properties.
Abstract
Cell fate decisions in eukaryotes are regulated by interconnected networks of transcription factors (TFs) that drive heritable changes in identity. However, much is unknown about how TFs act together to control cell fate, despite links to cellular dysfunction and disease when TF function is aberrant. Here, we addressed the interplay between TFs that control heritable switching in the diploid fungal pathogen Candida albicans. This species can propagate in two distinct cell states, white and opaque, with epigenetic transitions between states regulated by a core network of eight TFs plus >100 auxiliary TFs. The role of these TFs was dissected using simple and complex haploinsufficiency (CHI) analyses to examine the impact of gene dosage on cell fate. Among single heterozygotes, loss of one allele of WOR1 had the greatest impact on white-opaque switching, consistent with its role as the…
Genes, proteins, chemicals, diseases, species, mutations and cell lines named across the full text — each resolved to its canonical identifier and authoritative record.
Click any figure to enlarge with its caption.
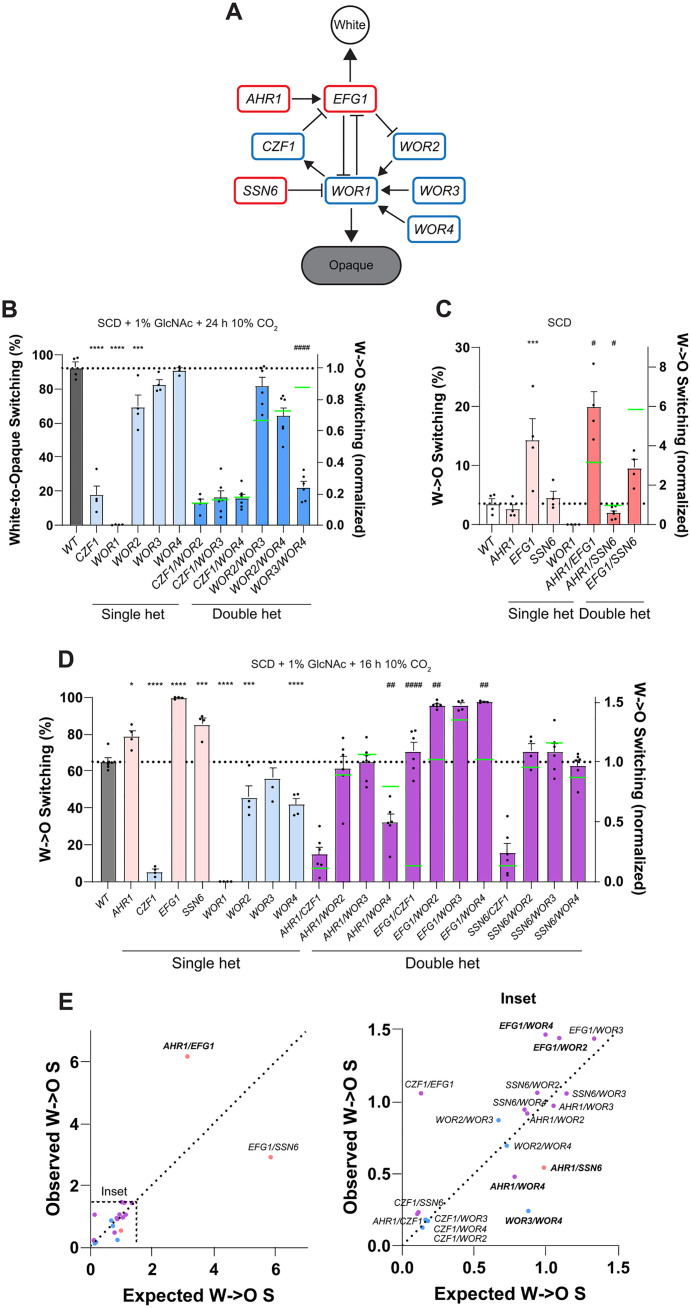 Fig 1
Fig 1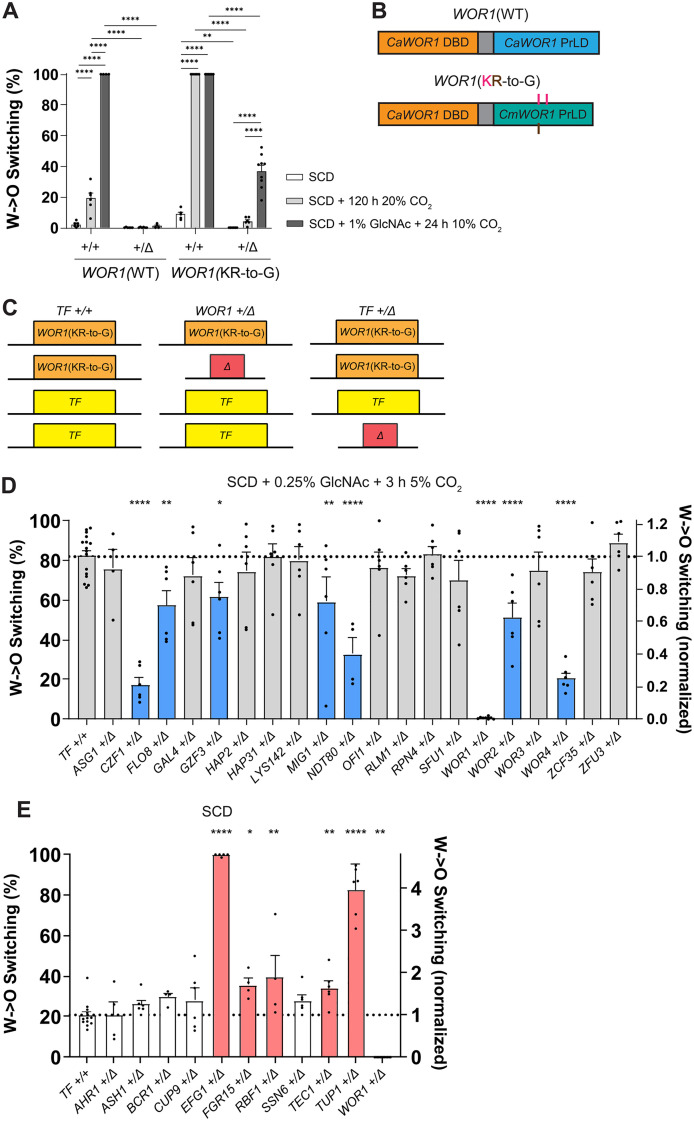 Fig 2
Fig 2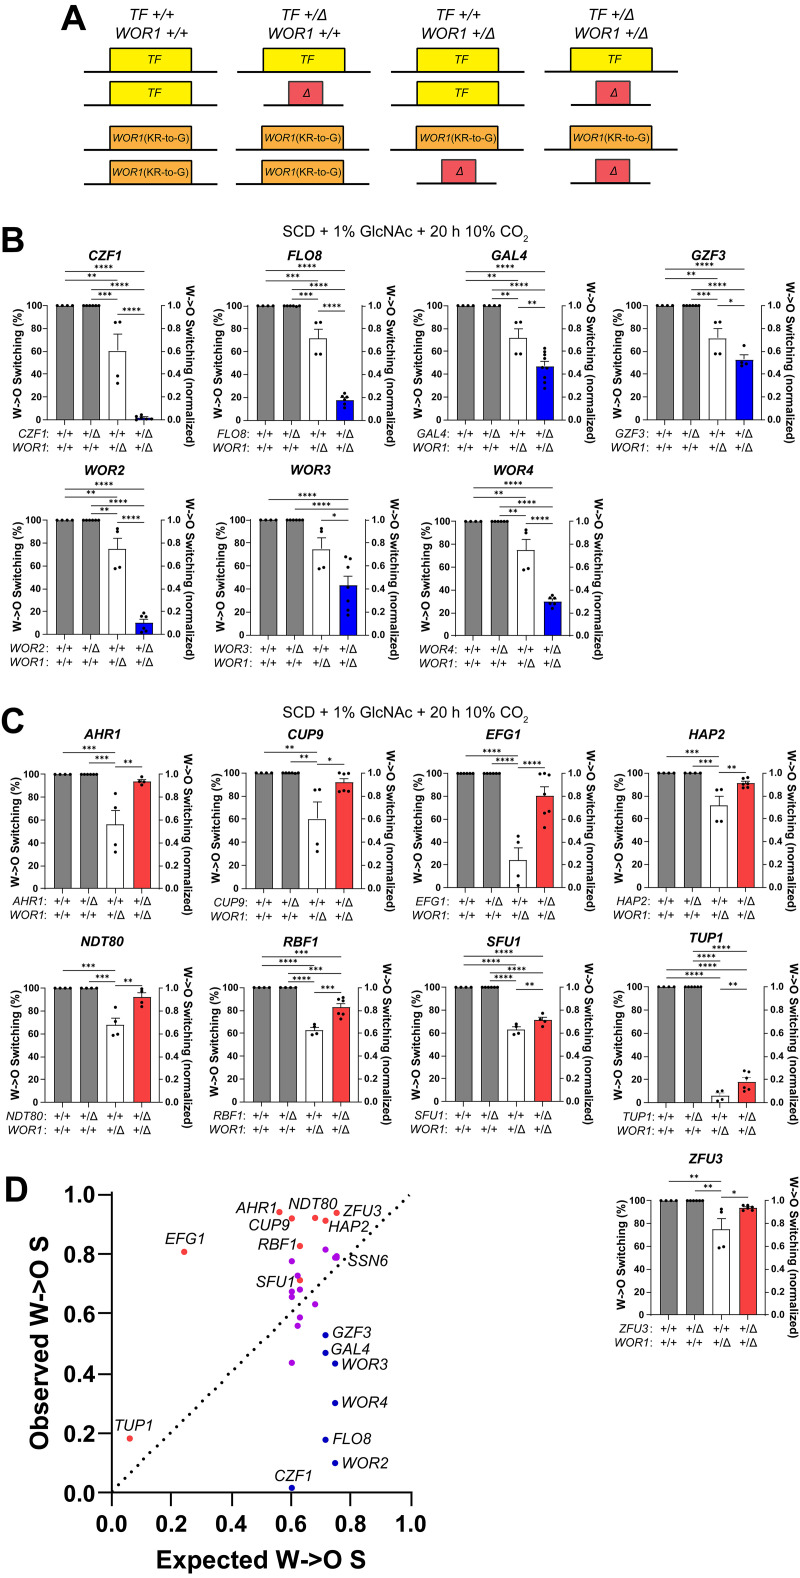 Fig 3
Fig 3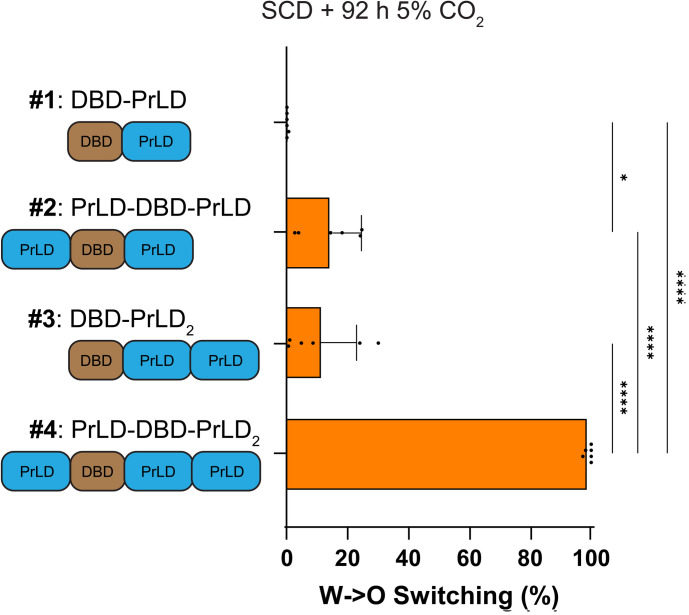 Fig 4
Fig 4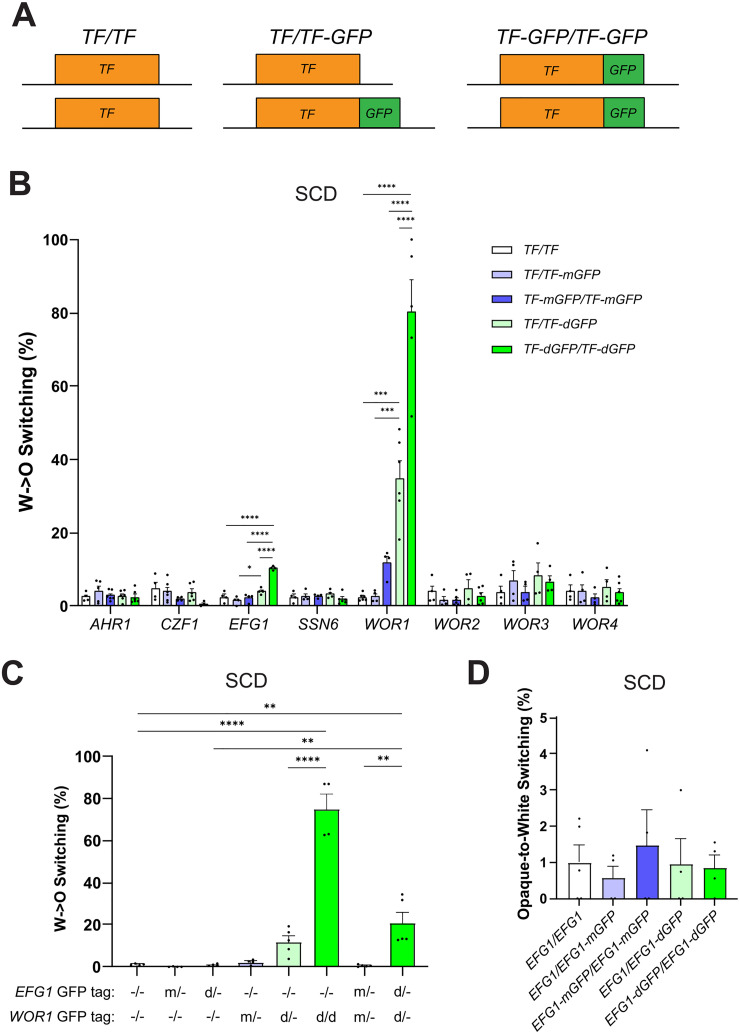 Fig 5
Fig 5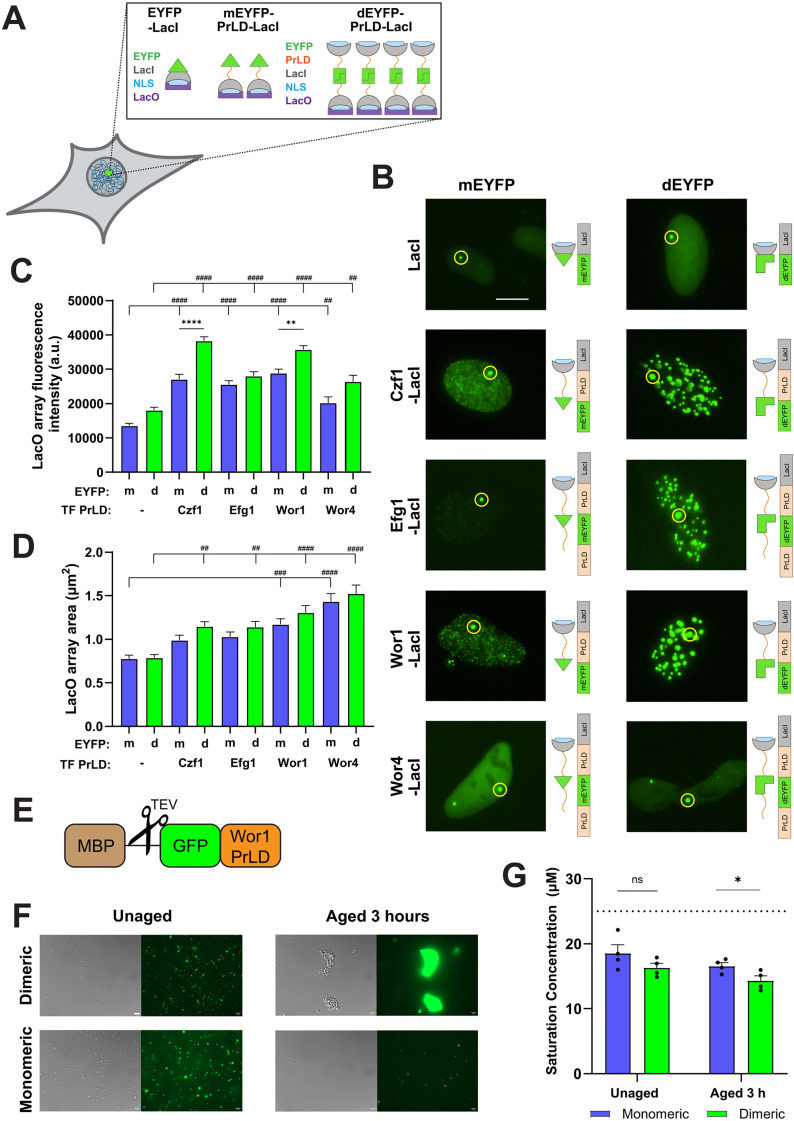 Fig 6
Fig 6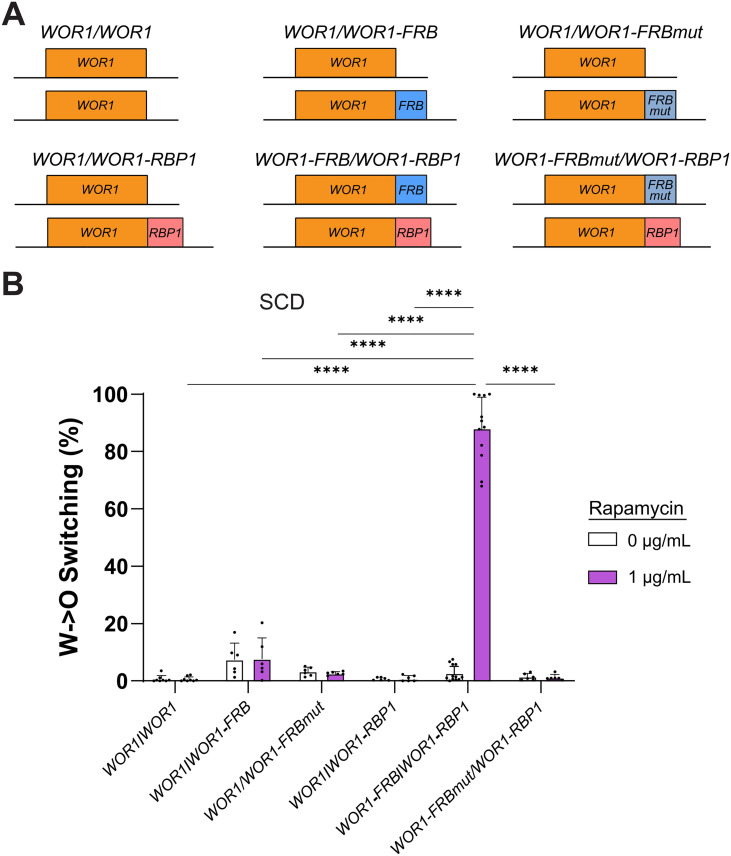 Fig 7
Fig 7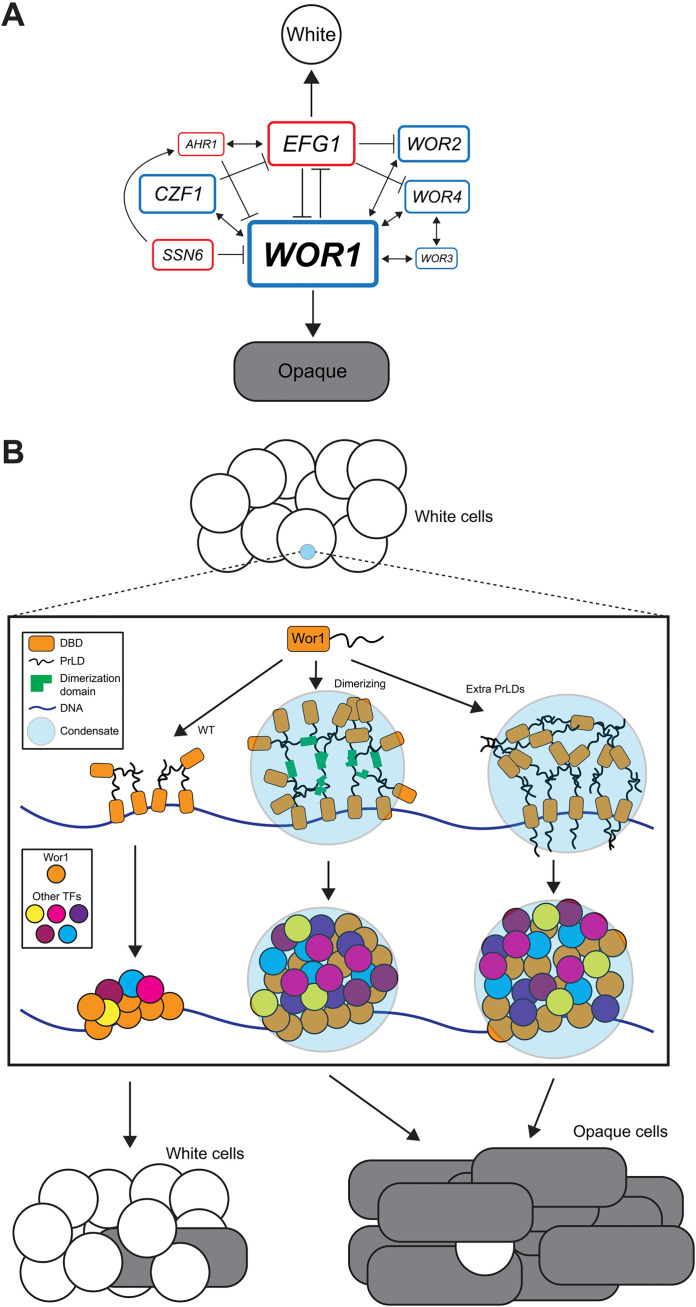 Fig 8
Fig 8- —http://dx.doi.org/10.13039/100006492Division of Intramural Research, National Institute of Allergy and Infectious Diseases
- —http://dx.doi.org/10.13039/100006492Division of Intramural Research, National Institute of Allergy and Infectious Diseases
Peer Reviews
No public reviews on file for this paper yet. If you reviewed it on a platform where reviews are public (OpenReview, ICLR, NeurIPS, ICML), you can paste yours below so the community can read it here.
Videos
No videos yet. Explain this paper in a talk, walkthrough, or lecture? Add one.
Taxonomy
TopicsFungal and yeast genetics research · DNA Repair Mechanisms · CRISPR and Genetic Engineering
Introduction
Transcription factor (TF) networks play a central role in regulating cell fate across the tree of life, from bacteria to multicellular eukaryotes [1–3]. In microbial systems, transitions between alternative cell states can promote bet hedging to promote survival under fluctuating environmental conditions or can enable a division of labor between specialized cell types [4–6]. In higher organisms, cell fate transitions are associated with cell differentiation during development, cell reprogramming to generate pluripotent stem cells, and the formation of aberrant cell types during tumorigenesis [7,8]. Mammalian cell identity is determined by TFs that act together with cell signaling cues, chromatin structure, nucleosome remodeling and post-translational histone modifications to control cell differentiation [9–11].
Cell fate-defining TFs act at cis-regulatory elements to regulate target gene expression and, in higher eukaryotes, these elements can be more than 1 Mb away from their target [12]. Cell identify has also been linked to specialized super-enhancers where high levels of TFs, Mediator complex and RNA polymerase II reside together with elevated levels of active histone marks [7,12,13]. Assembly of the transcriptional machinery at super-enhancers may be enabled by constituent factors undergoing phase separation (liquid-liquid demixing or complex coacervation) into biomolecular condensates at these loci [7,12–14]. Models suggest that weak interactions between the intrinsically disordered domains of TFs, cofactors and RNA polymerase II, together with protein-nucleic acid interactions, drive the formation of transcriptional condensates that induce cell identity genes [15–19].
The transcriptional control of cell fate has been extensively investigated in Candida albicans, a fungal species that is of critical importance to human health [20–23]. This species is a human commensal but can cause localized or systemic infections upon immunosuppression, microbiome disruption or host epithelial cell damage [20–22]. C. albicans exhibits phenotypic plasticity which can enable adaptation to host niches and can promote immune evasion [24–28]. In particular, this species undergoes stochastic and reversible switching between two stable cell states, white and opaque [29–31], with switching sensitive to a range of environmental cues including N-acetylglucosamine and CO_2_ [32–35].
Regulation of the white-opaque switch shows several parallels with the control of cell differentiation in higher eukaryotes. White-opaque switching is controlled by over 100 TFs with a core transcriptional regulatory network (TRN) of eight TFs that bind to their own and to each other’s promoters and that operate in a series of nested feedback loops [36–39]. WOR1 is regarded as the master regulator of the switch; cells lacking WOR1 generally cannot switch to the opaque state while WOR1 overexpression drives cells to the opaque state en masse [40–42]. Similar to cell fate regulation in mammalian cells, the core white-opaque TFs bind to unusually large regulatory regions that may recruit high levels of the transcriptional machinery [36,37,39,42]. Moreover, most core white-opaque TFs possess intrinsically disordered prion-like domains (PrLDs) that can promote condensate formation via their multivalency, and mutations that block condensate formation block TF function in C. albicans cells [43]. It is therefore envisaged that, as in mammalian super-enhancers, core white-opaque TFs assemble into condensates at key genomic regions to drive gene expression and cell identity [43]. As in higher eukaryotes, white-opaque TFs also cooperate with chromatin-modifying activities to direct cell fate [36–39,42,44–49].
Here, simple and complex haploinsufficiency (CHI) analyses were performed on C. albicans TFs to examine genetic interactions that impact white-opaque switching. CHI analyses involves the construction of strains with heterozygous deletions at two separate loci [50,51], and enables genetic interactions to be evaluated even when one TF is essential to a process [50]. Notably, we show that WOR1 heterozygotes exhibit an almost complete block in white-to-opaque switching, establishing the unique role of Wor1 in this transition, while CHI analyses identified complex epistatic interactions between other core TFs. Moreover, we show that changes to TF valency – reflecting the interaction potential of a given protein – can radically alter Wor1 function and its propensity to undergo liquid-liquid demixing. Thus, forcing Wor1-Wor1 dimerization altered the ability of this TF to undergo phase separation and increased white-to-opaque switching frequencies by almost two orders of magnitude. Together, these data highlight that changes to gene dosage and interaction valency can markedly alter TF function due to changes in phase separation.
Results
Analysis of heterozygous TF deletions for white-opaque switching
Genetic interactions between the core white-opaque TFs were examined using both simple and complex haploinsufficiency (CHI) analyses, in which C. albicans strains were heterozygous for one or two genes, respectively. Switching frequencies were evaluated in MTLa/a or MTLa/Δ derivatives of SC5314 MTLa/α cells, as a/α cells are restricted from undergoing switching due to inhibition via MTLa1/α2 [52–54]. Unless otherwise stated, switching experiments were performed by culturing white cells on synthetic complete dextrose (SCD) supplemented with 5 µg/mL Phloxine B and grown at 25°C for 7 days, conditions that support ~3% stochastic switching to the opaque state. Where appropriate, we also utilized conditions that promoted higher white-to-opaque switching frequencies including incorporation of N-acetyl glucosamine (GlcNAc) into the media and/or incubation in the presence of 5–20% CO_2_ [32,33].
The core white-opaque transcriptional regulatory network (TRN) consists of five positive regulators of the opaque state (CZF1, WOR1, WOR2, WOR3, and WOR4), and three negative regulators of the opaque state (AHR1, EFG1, and SSN6) (Fig 1A). Analysis of the eight core TF heterozygotes showed that loss of one allele of CZF1, WOR1 or WOR2 significantly reduced white-to-opaque switching (Fig 1B and 1D). For example, under conditions where the control strain exhibited switching in >90% of colonies, switching was observed in 17.6% of CZF1 heterozygote colonies, 69.5% of WOR2 heterozygote colonies and in just 0.3% of WOR1 heterozygote colonies (Fig 1B). These results are consistent with studies showing that the complete loss of each of these genes blocks or substantially reduces white-to-opaque switching [39,41,42,55]. Conversely, deletion of one allele of EFG1 or AHR1 significantly increased switching (Fig 1C and 1D), consistent with reports that reducing EFG1 gene dosage enhances switching to opaque [55,56] and that a complete loss of AHR1 (also called ZCF37) increases switching [57,58]. Loss of one allele of WOR4 significantly decreased switching to opaque while the loss of one allele of SSN6 significantly increased switching under a subset of conditions (Fig 1D). These results were unexpected since heterozygous deletion mutants of these genes have previously been reported to switch at normal frequencies [37,38]. Finally, loss of one allele of WOR3 did not impact switching frequencies (Fig 1B and 1D), consistent with wor3Δ/Δ mutants showing normal white-to-opaque switching [44].
*White-to-opaque switching frequencies of core white-opaque TF heterozygotes.(A) Core TFs regulating white-opaque switching. TFs in blue promote the opaque state and TFs in red promote the white state. Adapted from [28]. (B-D) Strains were grown on (B) SCD with 1% GlcNAc + 24 h 10% CO2 before outgrowth in normoxia, (C) SCD, or (D) SCD with 1% GlcNAc + 16 h 10% CO2 before outgrowth in normoxia. All experiments were performed for 7 days at 25°C. Mean white-to-opaque switching percentages are shown on the left y-axis and mean normalized white-to-opaque switching frequencies are shown on the right y-axis relative to the wildtype (WT) control. Gray/white bars represent WT strains. Light blue bars and red bars represent single heterozygotes for positive and negative regulators, respectively. Dark blue bars and dark red bars represent double heterozygotes for positive and negative regulators, respectively. Dark purple bars represent double heterozygotes with one negative and one positive regulator. Green lines indicate expected switching frequencies of double heterozygotes based on multiplying the switching frequencies of the corresponding single heterozygotes. Black dots indicate biological replicates, error bars show standard error of the mean (SEM), and the dotted line corresponds to WT. Statistical analysis was performed using ordinary one-way ANOVA with Dunnett’s multiple-comparison test, in which normalized switching frequencies of single heterozygotes were compared to that of the WT control. *P < 0.05; **P < 0.01; ***P < 0.001; ***P < 0.0001. Statistical analysis was also performed using a two-tailed Student’s T-test, in which the normalized switching frequencies were compared between the observed double heterozygote and that expected by multiplying single heterozygote values. #P < 0.05; ##P < 0.01; ####P < 0.0001. (E) Normalized switching frequencies of observed vs. expected double heterozygote strains. Double heterozygote strains that exhibited switching frequencies that were significantly different from their expected switching frequencies (based on multiplying the switching frequencies of the corresponding single heterozygotes) are shown in bold.
We focused on the very low switching observed in WOR1 heterozygotes, as even under strong opaque-inducing conditions (100% switching in control cells) these cells exhibited only ~1.1% switching, indicating a two orders of magnitude reduction (Fig 2A). Strains lacking either the A or B allele of WOR1 were evaluated, as the two alleles differ by two residues in SC5314 (G125A and S633N; S1A Fig). When grown on strong opaque-inducing conditions (SCD + 1% GlcNAc + 10% CO_2_ for 24 h before outgrowth in normoxia), WOR1 heterozygotes containing the A allele exhibited 5.2% switching whereas those harboring the B allele showed 0.5% switching, indicative of a 10-fold difference in activity (S1B Fig). Together, these experiments establish that WOR1 gene dosage has an outsized role in determining white-opaque switching frequencies regardless of which WOR1 allele is deleted, although differences in activity exist between the two SC5314 WOR1 alleles.
*White-to-opaque switching frequencies of single TF heterozygotes in a WOR1(KR-to-G) strain background.(A) Switching assays were performed with WT WOR1 or a KR-to-G variant of WOR1. WOR1 + /+ and WOR1 + /Δ heterozygote strains were plated on SCD (white bars), SCD with growth in 20% CO2 for 120 h before outgrowth in normoxia (light gray bars), or SCD with 1% GlcNAc and growth in 10% CO2 for 24 h before outgrowth in normoxia (dark gray bars). Switching percentages were determined after growth at 25°C for 7 days. Mean white-to-opaque switching percentages are shown; black dots indicate biological replicates and error bars show SEM. Statistical analysis was performed using ordinary one-way ANOVA with Dunnett’s multiple-comparison test, in which switching percentages were compared within WOR1(WT) or WOR1(KR-to-G) backgrounds, and between WOR1 + /+ and WOR1 + /Δ strains. **P < 0.01; ****P < 0.0001. (B) Schematics of WT Wor1 consisting of C. albicans DNA-binding domain (DBD) and PrLD and the WOR1(KR-to-G) variant which consists of the C. albicans DBD and a C. maltosa PrLD containing three KR-to-G substitutions (as indicated). (C) Genotypes of the strains used in 2D + E. TF + / + strains contained two WOR1(KR-to-G) alleles, WOR1 + /Δ strains contained one copy of WOR1(KR-to-G) and two copies of all other TFs, and TF + /Δ strains contained two copies of WOR1(KR-to-G) but one copy of the corresponding TF. (D + E) TF + /+ (WT) and TF + /Δ (single heterozygotes) in the WOR1(KR-to-G) background were grown on (D) SCD with 0.25% GlcNAc in 5% CO2 for 3 h before outgrowth in normoxia or (E) SCD. Switching percentages were determined after growth at 25°C for 7 days. Mean white-to-opaque switching percentages are shown on the left y-axis and mean normalized white-to-opaque switching frequencies are shown on the right y-axis relative to WT from same-day experiments. Black dots indicate biological replicates, error bars show SEM, and the dotted line corresponds to the control strain’s switching frequency. Colored bars indicate significant differences from the WT control; blue for decreased switching and red for increased switching. Statistical analysis was performed using ordinary one-way ANOVA with Dunnett’s multiple-comparison test, in which switching was compared between mutants and the control. *P < 0.05; **P < 0.01; ***P < 0.0001.
To determine the impact of TF gene dosage on RNA expression, quantitative real time-PCR (qRT-PCR) was performed on TF heterozygotes in the white and opaque states. Most heterozygote strains showed TF expression levels that were 2-fold (or more) lower than the parental strain in both cell states (S2A Fig), although white WOR1 + /Δ cells had slightly elevated (~1.5-fold higher) WOR1 expression levels than the WT control (S2A Fig). These results are in line with gene expression generally correlating with gene dosage [51,59]. We also note that EFG1 expression was higher in white cells than opaque cells, whereas CZF1, WOR1, WOR2, and WOR3 were expressed at higher levels in opaque cells than in white cells (S2B Fig). AHR1, SSN6, and WOR4 were expressed at similar levels between white and opaque cells (S2B Fig). These data align with RNA-seq analysis of gene expression levels in white and opaque cells [60].
Complex haploinsufficiency (CHI) reveals genetic interactions between TFs
To identify genetic interactions between core white-opaque TFs, CHI analysis was performed by constructing double heterozygous TF mutants and comparing switching frequencies with the corresponding single TF heterozygotes. As noted above, switching frequencies with WOR1 + /Δ heterozygotes were extremely low which precluded CHI analysis, a point returned to below. CHI analysis for the seven other core network genes involved construction of 21 different TFA + /Δ TFB + /Δ combinations. Three different culture conditions were used: SCD + 1% GlcNAc + 24 h 10% CO_2_ (which induces high levels of switching; Fig 1B), SCD (which supports low levels of stochastic white-to-opaque switching; Fig 1C), and SCD + 1% GlcNAc + 16 h 10% CO_2_ (for moderate levels of switching; Fig 1D).
For this analysis, we used the multiplicative model of genetic interactions to examine the data [50,51,61]. Briefly, the quantitative phenotype of the double mutant (TFA + /∆ TFB + /∆), in this case the ratio of the switching frequency normalized to a WT control (SF_AB_), was compared to the product of the phenotypes from the corresponding single mutants (SF_A_ x SF_B_). If SF_AB_ > SF_A_ x SF_B_, then a positive genetic interaction exists whereas if SF_AB_ < SF_A_ x SF_B_, then a negative interaction exists. If SF_AB_ = SF_A_ x SF_B_, then there is no genetic interaction and the two genes function independently. Positive interactions are frequently referred to as suppressive interactions and imply that the two genes function in a linear pathway or that a compensatory response is involved in the phenotype of the double mutant. Negative interactions suggest that the two genes function cooperatively, such as in a “synthetic lethal” phenotype. Even the observation of “no interaction” is informative as it indicates that two genes affect a phenotype independently of one another. We also note that very high or very low switching frequencies could limit the accuracy of certain CHI comparisons, such as that of EFG1 heterozygotes which showed switching in 99.6% of colonies in some assay conditions (Fig 1D).
Here, most of the 21 double heterozygote mutants showed white-to-opaque switching frequencies equivalent to the product of the individual heterozygote switching frequencies, indicating that most TFs work independently to regulate the switch (Fig 1) [51,61]. The rate of switching for each double mutant was plotted against the product of the two corresponding single heterozygote mutants (SF_A_ x SF_B_, Fig 1E). Double mutants that lie close to the diagonal are those with independent contributions from each TF. Despite the large number of potential interactions based on the binding-data derived network [36–38], only six TF x TF interactions were significant by CHI (Fig 1E), indicating that most TFs make independent contributions to the white-opaque switch. A negative interaction between WOR3 and WOR4 indicates that these two factors function cooperatively to promote switching to opaque. Loss of one allele of EFG1 in combination with loss of one allele of WOR2 or WOR4 resulted in close to 100% switching, similar to that of the single EFG1 heterozygote, indicating that the change in EFG1 dosage had a larger effect on switching than the change WOR2 or WOR4 dosage (Fig 1D). A positive interaction between AHR1 and EFG1 was observed indicating that they work cooperatively to inhibit switching to the opaque state.
We further investigated the interactions between WOR3 and WOR4 by analyzing single and double heterozygotes for WOR1, WOR3 and WOR4 expression. Although small (~2-fold) differences in expression of these genes were observed, none of these differences were significant (S2C Fig). This suggests that WOR3 and WOR4, either individually or in combination, do not influence white-opaque switching by changes to WOR1 expression.
Identification of a hyperactive WOR1 variant
C. albicans WOR1 heterozygote cells exhibited remarkably low white-to-opaque switching frequencies which impeded CHI analyses. To circumvent this issue, a hyperactive Wor1 variant was identified by mutation of the PrLD. Strains expressing the C. albicans Wor1 DNA binding domain fused to the C. maltosa Wor1 PrLD showed comparable activity to native C. albicans Wor1 in white-opaque switching assays (S3 Fig). Notably, however, substitution of the three positively charged residues in the C. maltosa PrLD generated a hyperactive WOR1(KR-to-G) variant (Fig 2A, 2B, and S3 Fig), consistent with previous studies showing that PrLD alterations can alter Wor1 function [43]. Thus, under conditions where one copy of the native WOR1 allele supported only 1.1% white-to-opaque switching, a strain with one WOR1(KR-to-G) allele supported 37% switching to the opaque state (Fig 2A). As with the native WOR1, strains expressing one WOR1(KR-to-G) allele still showed much lower switching frequencies than strains expressing two alleles (4.3% vs. 100% switching in SCD + 20% CO_2_; Fig 2A). This again indicates that the white-opaque switch is extremely sensitivity to WOR1 gene dosage.
CHI reveals genetic interactions between WOR1 and other white-opaque TFs
To investigate genetic interactions between WOR1 and other white-opaque TFs (seven core TFs plus 21 auxiliary TFs [58]), we first generated single TF heterozygotes in a strain with two hyperactive WOR1(KR-to-G) alleles and evaluated white-to-opaque switching frequencies (Fig 2C). When grown under opaque-inducing conditions (SCD + 0.25% GlcNAc and 5% CO_2_ for 3 h before outgrowth in normoxia), the parental strain showed 82.6% switching while removal of one allele of the core TFs CZF1, WOR2 or WOR4, or of the auxiliary TFs FLO8, GZF3, MIG1 or NDT80, resulted in significantly decreased switching (Fig 2D). CZF1 and WOR4 heterozygotes showed the biggest defects of the core TFs with 17.6% and 20.7% switching, respectively, whereas the NDT80 heterozygote had the largest defect of the auxiliary TFs with 32.9% switching (Fig 2D). Conversely, when grown on SCD without inducing cues, loss of one copy of FGR15, RBF1, or TEC1 resulted in significant increases in switching, with 20.7% switching in the parental strain increasing to 34–39% switching in the heterozygotes (Fig 2E). The result with RBF1 was surprising as a full RBF1 deletion previously showed significantly decreased switching to the opaque state [58]. However, these differences were modest compared to those seen in EFG1 and TUP1 heterozygotes which showed 99.7% and 82.4% switching, respectively (Fig 2E). For comparison, we examined several auxiliary TFs in a WT WOR1 strain background and found that heterozygotes affected switching as in the WOR1(KR-to-G) background. Thus, loss of one allele of NDT80 reduced switching, loss of one allele of TUP1 increased switching, and loss of one allele of ASH1, RLM1, or RPN4 did not affect switching (S4 Fig).
We next analyzed double TF heterozygote mutants in the WOR1(KR-to-G) strain background (Fig 3A and S5A Fig). Under strong opaque-inducing conditions (SCD + 1% GlcNAc and 10% CO_2_ for 20 h before outgrowth in normoxia), all TF heterozygotes switched from white to opaque at 100% efficiency when two WOR1(KR-to-G) alleles were present, whereas analysis in the WOR1(KR-to-G) heterozygote showed 6–72% switching (Fig 3B, 3C, and S5B Fig). CHI analysis showed that WOR1 worked cooperatively with the core positive regulators CZF1, WOR2, WOR3, and WOR4, as double heterozygotes with these genes switched significantly less than the single heterozygotes (Fig 3B and 3D). The SSN6/WOR1 double heterozygote switched at comparable frequencies to the WOR1 single heterozygote, indicating that WOR1 was epistatic to SSN6 (S5B Fig). Deletion of one allele of the negative regulators EFG1 or AHR1 in combination with deletion of one allele of WOR1 resulted in switching frequencies between those of the single heterozygotes (Fig 3C and 3D), supporting the model that EFG1 and AHR1 work in opposition to WOR1 in white-opaque switching.
*White-to-opaque switching frequencies of double TF heterozygotes in a WOR1(KR-to-G) strain background.(A) Genotypes of the strains used in B + C. (B + C) WT, single heterozygotes and double heterozygotes in the WOR1(KR-to-G) strain background were incubated on SCD + 1% GlcNAc in 10% CO2 for 20 h before outgrowth under normoxia. Switching frequencies were determined after growth at 25°C for 7 days. Mean white-to-opaque switching percentages are shown on the left y-axis and mean normalized white-to-opaque switching frequencies are shown on the right y-axis relative to the control from same-day experiments. Black dots indicate biological replicates and error bars show SEM. WT and TF single heterozygotes are shown in gray, WOR1 single heterozygotes are shown in white, double heterozygotes that increased switching relative to the WOR1 single heterozygote are shown in red and double heterozygotes that decreased switching relative to the WOR1 single heterozygote are shown in blue. Statistical analysis was performed using ordinary one-way ANOVA with Dunnett’s multiple-comparison test, in which switching frequencies were compared between each strain. *P < 0.05; **P < 0.01; ***P < 0.001; ***P < 0.0001. (D) Normalized switching frequencies of observed vs. expected double heterozygote strains. Double heterozygote strains that exhibited switching frequencies that were significantly higher than their expected switching frequencies (positive interactions) are shown in red and those significantly lower (negative interactions) are shown in blue (based on multiplying the switching frequencies of the corresponding single heterozygotes).
Given central roles for WOR1 and EFG1 in switching, we further examined WOR1-EFG1 interactions under additional conditions that supported 27–90% switching in the WT control. In these assays, the WOR1/EFG1 double heterozygote generally switched at a frequency close to that of the WOR1 heterozygote (S6A and S6B Fig). For example, in assays performed on SCD with 1% GlcNAc and 10% CO_2_, the WT strain switched at 90%, the EFG1 heterozygote switched at 100% and the WOR1 heterozygote switched at 0.1%, respectively (S6B Fig). Under these conditions, the EFG1/WOR1 double heterozygote showed only 0.5% switching, close to that of the WOR1 single heterozygote. This indicates that the loss of one WOR1 allele had a dominant effect on switching over the loss of one EFG1 allele. We also examined the impact of WOR1 dosage in cells both with and without EFG1 and found that WOR1 copy number affected switching even in the absence of EFG1 (S6C Fig).
Examination of WOR1 interactions with auxiliary TFs revealed that WOR1 works cooperatively with FLO8, GAL4, and GZF3, as their corresponding double heterozygotes switched less than the WOR1 heterozygote (Fig 3B and 3D). In contrast, CUP9, HAP2, NDT80, RBF1, SFU1, TUP1, and ZFU3 were antagonistic to WOR1, with the corresponding double heterozygotes switching more than the WOR1 heterozygote (Fig 3C and 3D). The result with NDT80 was surprising as this is a positive regulator of the opaque state (Fig 2D and [58]), and yet the NDT80/WOR1 double heterozygote showed increased switching relative to the WOR1 single heterozygote. Double heterozygotes of WOR1 with the auxiliary TFs ASG1, ASH1, BCR1, FGR15, HAP31, LYS142, MIG1, OFI1, RLM1, RPN4, TEC1, and ZCF35 showed switching frequencies comparable to the WOR1 single heterozygote (Figs 3D and S5B). These results reveal positive, negative and neutral interactions between WOR1 and auxiliary TFs (Fig 3D) and that WOR1 was again the most influential TF in determining white-to-opaque switching frequencies under each condition.
Increasing Wor1 valency with extra PrLDs increases white-to-opaque switching
Our results highlight that Wor1 plays a unique role in white-opaque switching. This TF can undergo phase separation due to weak multivalent interactions with itself via its PrLD or due to interactions with the PrLDs of other TFs [43]. Here, we examined the effect of modulating valency by adding extra copies of the Wor1 PrLD to the native protein. Four constructs were expressed in a C. albicans wor1Δ/Δ strain: 1) WT Wor1 (containing the DNA binding domain and a single PrLD; DBD-PrLD), 2) Wor1 with an extra N-terminal PrLD (PrLD-DBD-PrLD), 3) Wor1 with an extra C-terminal PrLD (DBD-PrLD_2_), and 4) Wor1 with extra N- and C-terminal PrLDs (PrLD-DBD-PrLD_2_) (Fig 4). When grown on SCD, the strain expressing WT Wor1 supported minimal (~0.1%) switching whereas strains expressing Wor1 with one extra copy of the PrLD (PrLD-DBD-PrLD and DBD-PrLD_2_) showed 11–14% switching (Fig 4). Remarkably, the strain expressing the Wor1 construct with two extra PrLDs (PrLD-DBD-PrLD_2_) showed almost 100% switching under the same culture conditions (Fig 4).
*White-to-opaque switching frequencies of Wor1-PrLD variants.Schematics of Wor1 variants containing different PrLD configurations on the left. Construct #1 is the native Wor1 protein, constructs #2 and #3 have one extra Wor1 PrLD attached to the N- or C-terminus, respectively, and construct #4 has one extra Wor1 PrLD attached to both termini. Strains expressing each of the four Wor1 variants were incubated on SCD medium in the presence of 5% CO2 for 92 h before outgrowth in normoxia. Switching frequencies were determined after growth at 25°C for 7 days. Mean white-to-opaque switching percentages are shown; black dots indicate biological replicates and error bars show SEM. Statistical significance was evaluated using ordinary one-way ANOVA with Dunnett’s multiple-comparison test, in which all mean switching percentages were compared between each other. *P < 0.05; ***P < 0.0001.
These Wor1 variants were expressed fused to mNeonGreen and all constructs were expressed within 20% of the wildtype Wor1-mNeon level (S7A–S7C Fig). White-to-opaque switching frequencies of the mNeonGreen-tagged Wor1 variants showed that the presence of extra PrLDs again resulted in higher white-to-opaque switching frequencies (S7D Fig), as in the untagged strains. Together, these experiments establish that the addition of extra PrLDs (and increased protein valency) greatly increases Wor1’s ability to promote white-to-opaque switching.
Increasing Wor1 valency via dimerization increases white-to-opaque switching
Previous studies showed that Wor1 fusion to dimerizing GFP (dGFP) resulted in white-to-opaque switching at a frequency 27-fold higher than fusion to monomeric GFP (mGFP) [62]. mGFP and dGFP differ by only a single point mutation, A206K, and the increased oligomerization of Wor1-dGFP over Wor1-mGFP was proposed to underlie its hyperactive function [62]. Given that Wor1 has also been shown to undergo phase separation [43], we hypothesized that Wor1 dimerization would increase Wor1 valency leading to enhanced phase separation and higher TF activity. To test this, we evaluated strains expressing Wor1-dGFP and Wor1-mGFP (Fig 5A) and, similar to Ziv et al. [62], Wor1-dGFP-expressing strains exhibited significantly higher switching frequencies than either untagged or Wor1-mGFP-expressing strains. For example, on SCD medium, a WOR1/*WOR1-*mGFP strain showed 2.6% switching whereas a *WOR1/WOR1-*dGFP strain showed 35% switching, a 13.5-fold difference (Fig 5B). Tagging both copies of WOR1 with mGFP or dGFP also resulted in higher switching in the dGFP-tagged strain (80.4%) than in the mGFP-tagged strain (11.9%) (Fig 5B). These experiments establish that fusion of Wor1 to dGFP causes a substantial increase in switching whereas fusion to mGFP results in an insignificant change compared to the untagged control.
*White-opaque switching frequencies of strains harboring GFP-tagged TFs.(A) Schematic showing TFs with alleles tagged with GFP. (B) Strains with TF alleles tagged by mGFP or dGFP were grown on SCD medium for 7 days at 22°C and white-to-opaque switching percentages determined. (C) Strains with TF alleles untagged (Ø) or tagged with mGFP (m) or dGFP (d) were grown on SCD medium for 7 days at 22°C and white-to-opaque switching percentages determined. (D) Efg1-GFP strains were grown on SCD medium for 7 days at 25°C and opaque-to-white switching percentages determined. Mean switching percentages are shown; black dots indicate biological replicates and error bars show SEM. Blue bars indicate monomeric GFP tags and green bars represent dimeric GFP tags. Statistical analysis was performed using ordinary one-way ANOVA with Dunnett’s multiple-comparison test, in which mean switching percentages among strains for one TF were compared between each other. *P < 0.05; ***P < 0.001; ***P < 0.0001.
We evaluated whether tagging of other network TFs with mGFP/dGFP also impacts white-opaque switching. GFP tagging of most TFs did not alter switching, although Efg1-dGFP strains showed slightly increased white-to-opaque switching frequencies compared to untagged or Efg1-mGFP-expressing strains (10.3% vs. 2.2-2.5%, respectively; Fig 5B). We also tested strains with one allele of both EFG1 and WOR1 GFP-tagged to investigate potential synergy between these TFs. The strain co-expressing Efg1-dGFP Wor1-dGFP exhibited elevated switching relative to controls, but these levels were similar to a strain expressing only Wor1-dGFP (Fig 5C). Since Efg1 promotes the white state, we also tested the opaque-to-white switching frequency of an Efg1-dGFP strain but found no differences with control strains (Fig 5D).
TF expression levels were compared between strains in which both TF alleles were mGFP- or dGFP-tagged and, in general, TF expression levels were in line with expectations, with Wor1 being the highest expressed TF in opaque cells and Efg1 being the highest expressed TF in white cells (S8 Fig). We also found that most TFs showed similar expression levels between mGFP- and dGFP-tagged strains, although dGFP-tagging of Efg1 resulted in lower expression levels in white cells than tagging with mGFP (S8 Fig). This may contribute to the increased white-to-opaque switching observed in the Efg1-dGFP-tagged strain given that reduced EFG1 expression increases switching to the opaque state (Fig 1C and 1D).
Increasing TF valency leads to increased phase separation
To test whether increased valency increases the propensity TFs to undergo liquid-liquid phase separation (LLPS), we examined the phase separation capacity of Wor1 variants expressed in human U2OS cells. U2OS cells contained an array of ~50,000 copies of the LacO sequence inserted into the genome so that LacI-EYFP fusion proteins are recruited to the LacO array (Fig 6A) [16]. Fusion of phase-separating proteins to LacI-EYFP can increase LLPS which, in turn, can increase focal intensity/area at the LacO array (and elsewhere in the nucleus) due to condensate formation [16,43].
*Dimerization of TFs promotes the formation of phase-separated condensates.(A) Schematic of EYFP-LacI variants, with or without TF PrLDs, that are recruited to LacO arrays to form fluorescent foci in U2OS nuclei. mEYFP = monomeric EYFP; dEYFP = dimeric EYFP. Created with BioRender.com. (B) Representative images of U2OS cells expressing EYFP-LacI constructs. Yellow circles signify the largest foci (presumed to be the LacO array). (C + D) Quantification of fluorescence intensity (C) and area (D) at the LacO array. Blue bars indicate monomeric EYFP and green bars represent dimeric EYFP. Error bars show SEM. Statistical analysis was performed using ordinary one-way ANOVA with Dunnett’s multiple-comparison test. Significant differences between TF PrLD constructs and the corresponding LacI-EYFP controls are shown by number signs. ##P < 0.01, ###P < 0.001; ####P < 0.0001. Significant differences between mEYFP and dEYFP constructs are denoted by asterisks. **P < 0.01, ****P < 0.0001. (E) Schematic depiction of GFP-Wor1PrLD constructs, which can be TEV treated to remove the MBP tag. (F + G) Dimeric Wor1 (dGFP-Wor1PrLD) or monomeric Wor1 (mGFP-Wor1PrLD) constructs were TEV treated at 30°C for 1 h to remove MBP and diluted in 150 mM NaCl, 10 mM Tris-HCl buffer with 5% PEG-8000. Experiment was repeated at least twice. (F) Representative images of 20 μM Wor1 protein droplets, imaged immediately after TEV treatment or after aging 3 h at 22°C. (G) Wor1 protein samples were diluted to 25 μM and saturation concentrations were determined. Mean concentrations are shown, black circles represent experimental replicates, error bars indicate SEM, and the dotted bar represents starting protein concentration. Statistical analysis was performed using a two-tailed Student’s t-test. P < 0.05. Scale bar, 10 μm.
We compared the properties of four white-opaque TFs fused to monomeric EYFP (mEYFP) or dimeric EYFP (dEYFP) in U2OS cells. LacI-mEYFP and -dEYFP controls produced comparable foci at the LacO array while the addition of TF PrLDs increased the intensity and/or size of fluorescent puncta at the array (Fig 6B–6D), consistent with PrLD-induced phase separation [43]. Notably, Czf1, Efg1 and Wor1 PrLDs formed brighter and/or larger foci when fused to dEYFP than when fused to mEYFP (Fig 6B–6D). For each PrLD construct, additional foci outside of the LacO array were also generally larger and more abundant fused to dEYFP versus mEYFP (Fig 6B). These results reveal that increasing the valency of the target protein by fusion to dimerizing EYFP versus monomeric EYFP enhances LLPS.
We further investigated the effect of dimerization on Wor1 by purifying recombinant Wor1 PrLD fused to mGFP or dGFP (Fig 6E). A maltose binding protein (MBP) domain was included to increase solubility, which was released by treatment with TEV protease. Both the mGFP- and dGFP-Wor1-PrLD fusion proteins readily formed liquid-like droplets in the presence of the molecular crowding agent PEG-8000 (Fig 6F). Interestingly, no difference in droplet formation or saturation concentration (C_sat_) was observed between the two proteins immediately after removing the MBP tag, but the dimeric construct consistently generated larger assemblies and had a lower C_sat_ after incubation at 22°C for 3 hours (Fig 6F and 6G). These results establish that the Wor1 PrLD fused to dGFP has an increased tendency to self-assemble compared to that fused to mGFP. We therefore propose that the increased white-to-opaque switching observed in Wor1-dGFP cells over Wor1-mGFP cells is due to the increased ability of the dimerized protein to form condensates.
Rapamycin-induced Wor1 dimerization drives white-to-opaque switching
Given that increased Wor1 valency (by fusion to dGFP or by incorporation of extra PrLDs) increases white-to-opaque switching, we tested whether an inducible system of Wor1 dimerization could control switching. Rapamycin is known to induce dimerization between the FK506 binding protein (FKBP) and the FRB domain of the mTOR kinase and has been used as a tool for controlling homo- and hetero-dimerization of protein targets [63–65], and to drive phase separation [66,67]. Here, we fused RBP1 (the C. albicans homolog of FKBP) to one WOR1 allele and FRB to the other WOR1 allele (Fig 7A) in a strain in which TOR1 was mutated (S1384A) to confer rapamycin resistance [68]. This strain also lacked the native TOR1 gene and endogenous copies of RBP1 (so that Wor1-tagged proteins would not interact with native Rbp1). Control strains included those in which WOR1 was untagged or fused to FRB or RBP1 but not both.
*Rapamycin-induced Wor1 dimerization drives white-to-opaque switching.(A) Genotypes at the WOR1 locus for the C. albicans strains tested. WOR1 alleles were tagged with FRB, FRBmut and/or RBP1 (or left untagged). (B) Strains were grown on SCD medium with 1 μg/mL rapamycin or with a vehicle control at 22°C for 7 days. Mean white-to-opaque switching percentages are shown. Black dots indicate biological replicates and error bars show SEM. Statistical analysis was performed using ordinary one-way ANOVA with Dunnett’s multiple-comparison test, in which all mean switching percentages were compared between each other. ***P < 0.0001.
White-to-opaque switching assays were performed on SCD medium (low stochastic switching conditions) in the presence or absence of rapamycin. Control strains expressing WOR1 fused to FRB or RBP1 exhibited low switching both in the absence and presence of rapamycin (0.7%-7.7%), similar to the untagged control strain (Fig 7B). In contrast, a strain harboring WOR1-FRB/WOR1-RBP1 showed low switching in the absence of rapamycin (2.7%) but extremely high switching (88%) when grown in the presence of 1 µg/ml rapamycin (Fig 7B). To further validate that rapamycin-induced Wor1 dimerization was responsible for increased switching, we tested strains with WOR1 fused to a mutant FRB domain (FRBmut harboring a S13R mutation) that cannot dimerize with RBP1. WOR1/WOR1-FRBmut and WOR1-FRBmut/WOR1-RBP1 strains switched at low frequencies both in the presence and absence of rapamycin (Fig 7B), confirming that dimerization between WOR1-FRB and WOR1-RBP1 mediates increased white-to-opaque switching.
We observed that opaque cells induced by rapamycin in the WOR1-FRB/WOR1-RBP1 strain were larger and more bulbous than conventional opaque cells (S9A Fig). To confirm that these cells were opaque cells we showed that they expressed the opaque-specific OP4 gene [69,70] (S9B Fig). We also examined colony phenotypes on CHROMagar plates [56] which showed that rapamycin-induced colonies resembled control opaque colonies (S9C Fig). Together, these results demonstrate that chemical-induced dimerization of WOR1 efficiently drives cells from white to opaque.
Finally, we also tested whether heterotypic TF-TF interactions could impact white-opaque switching, focusing on those between Wor1 and Wor2 and between Wor1 and Wor4. For these assays, WOR1 was tagged with RBP1 and WOR2 or WOR4 were tagged with FRB (S10A Fig). However, in contrast to the self-dimerization of Wor1 that promoted high levels of white-to-opaque switching, rapamycin-induced hetero-dimerization of Wor1-Wor2 or Wor1-Wor4 did not increase switching (S10B Fig). These data further highlight that Wor1 plays a unique role in driving white-to-opaque switching, and that while Wor1-Wor1 interactions promote switching those between Wor1 and Wor2 or Wor1 and Wor4 do not enhance switching.
Discussion
The C. albicans white-to-opaque switch represents an exemplary system to dissect the transcriptional control of epigenetic cell fate. This switch is controlled by a core network of eight TFs that are potentially recruited to the DNA by their coalescence into biomolecular condensates [36,43,49]. However, despite the identification of >100 TFs whose deletion impacts white-opaque switching [49,58], there remains limited understanding of how these TFs act in combination to regulate the switch. This is in part due to several TFs being essential to switching, with cells lacking WOR1 or WOR4 being locked in the white state whereas those lacking RBF1 or SSN6 are locked in the opaque state [37,39–42,58].
Haploinsufficiency analyses establish a unique role for WOR1
In this study, we leveraged the diploid nature of C. albicans to perform simple and complex haploinsufficiency analyses on core and auxiliary white-opaque TFs to further define their role in phenotypic switching. Consistently, Wor1 was by far the most important TF for switching to the opaque state. For example, in conditions that induced nearly 100% white-to-opaque switching in control strains, WOR1 heterozygotes underwent only ~0.3% switching whereas the next lowest heterozygote showed ~18% switching. Even the strain that showed the lowest switching frequency of any double heterozygote not involving WOR1 (a CZF1/WOR2 heterozygote) showed 44-fold more switching than the WOR1 single heterozygote.
Haploinsufficiency analyses also revealed that both SSN6 and WOR4 heterozygotes showed altered white-opaque switching, even though these heterozygotes were previously reported to switch at wildtype levels [37,58]. The likely reason for this difference is that while SSN6 and WOR4 dosage can significantly impact switching frequencies they do so only under a subset of conditions. This highlights how examining switching under different culture conditions can identify factors with modest effects on switching.
A hyperactive WOR1 allele enables CHI analyses
The relative inability of WOR1 heterozygotes to undergo white-to-opaque switching led us to utilize strains expressing a hyperactive WOR1 variant. Substitution of the three positively charged amino acids in the PrLD resulted in a WOR1(KR-to-G) variant that increased switching frequencies by more than 30-fold. While the cause of hyperactivity is under investigation, use of this variant allowed us to evaluate WOR1 heterozygotes for CHI phenotypes with other positive regulators of the switch. These experiments revealed that WOR1 acts with the core TFs CZF1, WOR2, WOR3, and WOR4 and with the auxiliary TFs FLO8, GAL4, and GZF3 to drive transitions to the opaque state. This is consistent with chromatin immunoprecipitation (ChIP) data showing that several of these TFs co-localize in opaque cells [36,37] and that they can also co-coalesce into condensates [43]. These experiments establish that CHI can dissect genetic interactions between white-opaque TFs (see model in Fig 8A) and is particularly beneficial for examining genes whose homozygous deletion results in an “all-or-nothing” phenotype.
C. albicans white-to-opaque switching.(A) A core TF network diagram integrating simple and complex haploinsufficiency analyses and prior literature [28]. TFs in blue promote the opaque state and TFs in red promote the white state. Box sizes reflect the size of the TF’s effect on white-opaque switching based on analyses of single TF heterozygotes. One-way arrows indicate positive/buffering interactions, two-way arrows indicate negative/cooperative interactions, and line segments with flat ends indicate repressive interactions between positive and negative regulators. (B) Diagram demonstrating how increasing Wor1 valency promotes condensate formation and white-to-opaque switching. Wor1 can recruit other TFs via condensate formation and drive white-to-opaque switching. Wor1 with increased valency (via the addition of extra PrLDs or by forced dimerization) more readily reaches the threshold necessary for condensate formation facilitating TF and transcriptional machinery recruitment and thereby increasing the frequency of white-to-opaque switching.
WOR1 and white-opaque switching pathways
Previous studies have shown that loss of WOR1 locks cells in the white state even when other opaque-inducing TFs are ectopically overexpressed [37–40,42,44]. Conversely, ectopic WOR1 expression can bypass the need for other TFs such as CZF1, WOR2, and WOR4 to be present for opaque formation [38,39]. However, despite extensive evidence that WOR1 is central to opaque formation, it was reported that wor1Δ/Δ efg1Δ/Δ cells can still switch to the opaque state under strong opaque-inducing conditions (e.g., culture with GlcNAc/CO_2_ at 37°C), indicating that a WOR1-independent “alternative opaque pathway” (AOP) exists [71–73]. The AOP was not directly investigated in the current study and opaque cell formation was highly sensitive to WOR1 dosage under each condition evaluated here. It is possible that the AOP supports opaque formation due to the combinatorial effects of loss of the EFG1 repressor together with strong opaque-inducing cues, indicating that WOR1 may be bypassed under these conditions. It was also proposed that WOR1 promotes opaque formation indirectly via inhibition of TUP1, which itself may be recruited to promoters via DNA-binding TFs such as EFG1 [74]. We found that EFG1 and TUP1 gene dosage both altered switching less than WOR1 dosage, and that WOR1 dosage impacted switching even in the absence of EFG1. Overall, we favor a model whereby WOR1 promotes opaque cell formation under most conditions, but that opaque cells can also form without Wor1 under certain genetic and environmental conditions like those favoring the AOP.
Comparison of white-opaque and biofilm TF networks
Biofilm formation contributes directly to C. albicans pathogenesis and is regulated by a highly interconnected TF network that shows similarities to the white-opaque network [75,76]. Deletion of single alleles of the biofilm network TFs also results in haploinsufficient phenotypes [51,77], although none exhibited the extreme haploinsufficiency defect of WOR1 heterozygotes in the white-opaque network. CHI analyses of the biofilm network showed that double TF heterozygotes are often as deficient, if not more so, than homozygous TF deletions [51]. The biofilm network is therefore viewed as a genetically fragile network as it requires multiple TFs to be present at full dosage for efficient biofilm formation to occur [51,77]. In contrast, the white-to-opaque switch is much more dependent on WOR1 dosage than that of other TFs, and even double TF heterozygotes do not impact switching as much as WOR1 heterozygotes. The white-opaque network can therefore be considered as a hybrid network that contains a critical node (WOR1) whose activity is modulated by a relatively robust network of modifier TFs. This distinguishes the white-opaque network from the more fragile biofilm network that has no central critical node/regulator analogous to WOR1.
The impact of Wor1 valency on white-opaque switching
We were struck by the observation that even a twofold change in WOR1 dosage could result in a 100-fold change in the white-to-opaque switching frequency. We therefore tested variants with altered valency and found that increased Wor1 valency, either by the addition of extra Wor1 PrLDs or by fusion to dimerizing GFP (dGFP), led to a striking increase in Wor1 function. For example, under conditions where wildtype Wor1 supported 0.1% switching, a strain expressing Wor1 containing an extra PrLD resulted in 11–14% switching while the presence of two extra PrLDs produced close to 100% switching. Similar to Ziv et al. [62], we also found that Wor1 fusion to dGFP resulted in an increase in activity relative to fusion to mGFP (80% versus 12% switching, respectively). In contrast, fusion of dGFP to other network TFs did not substantially alter white-opaque switching frequencies. This demonstrates how Wor1 activity can be enhanced by simple manipulation of its valency.
We also tested whether chemically induced dimerization of Wor1 could be used to control switching. Remarkably, a strain in which WOR1 alleles were fused to FRB and RBP1 underwent high frequencies of white-to-opaque switching (88% switching) in the presence of rapamycin which induces FRB-RBP1 heterodimerization. However, switching was not induced in this strain in the absence of rapamycin nor in a strain with a mutated FRB that does not undergo dimerization. These results further highlight how changes to TF valency are a powerful approach for manipulating cell state transitions (see Fig 8B) with important implications for the control of cellular reprogramming in higher eukaryotes.
Connections between TF gene dosage, valency and phase separation
Why do changes in valency and gene dosage result in large-scale changes in Wor1 activity? We propose that this hypersensitivity reflects the impact of these features on the propensity to phase separate. Wor1 and other white-opaque network TFs can form phase-separated condensates due to multivalent interactions mediated by their PrLDs, and mutations that block this ability block opaque cell formation [43]. We found that Wor1 dimerization via fusion to dGFP not only increased its transcriptional activity but also enhanced its phase separation, both in mammalian U2OS cells and when purified and analyzed in vitro. We therefore propose that increasing either the valency or the gene dosage of Wor1 increases white-to-opaque switching by increasing the likelihood that this TF reaches the threshold at which it forms phase-separated condensates. These results are in line with other studies that have shown that phase separation events are exquisitely sensitive to both protein valency and expression levels [78–80].
We highlight a recent report in which the products of multiple dosage-sensitive genes were found to encode proteins with the propensity to phase separate [81]. This study emphasized how even small changes in the levels of gene products can alter phase separation events. Indeed, gene dosage sensitivity may represent a more accurate tool for identifying phase-separating factors than current sequence-based predictors [81]. We similarly propose that the extreme dosage sensitivity of WOR1 reflects the fact that expression levels must reach the threshold at which Wor1 phase separation occurs to drive the white-to-opaque switch. This model aligns with a recent study showing that if Wor1 levels drop below a certain threshold then opaque cells switch back to the white state [82]. Wor1 expression levels are therefore critical for defining both white-to-opaque and opaque-to-white cell transitions.
Finally, the unique role that Wor1 dosage and valency had on white-opaque switching relative to other TFs suggests that this factor may be critical for nucleating the condensates that drive opaque cell formation. Wor1 may also act as a “pioneer factor” to open up condensed chromatin and facilitate the recruitment of other TFs [83]. By analogy, the mammalian pioneer factor FOXA1 can form biomolecular condensates that increase chromatin accessibility, and this process is reliant on the intrinsically disordered regions of FOXA1 for phase separation [84]. Additional studies are now required to test whether C. albicans Wor1 acts as a bona fide pioneer factor and to further determine how TFs cooperate to control cell fate-determining programs.
Materials and methods
Media
C. albicans strains were maintained on yeast peptone dextrose (YPD) agar plates, synthetic complete dextrose (SCD) agar plates [85], or CHROMagar plates (Fisher Scientific, NC9514149). Variations of SCD containing different amounts of glucose and N-acetylglucosamine (GlcNAc) were used for switching assays including SCD with 2% glucose, SCD with 1% glucose and 1% GlcNAc, and SCD with 1.75% glucose and 0.25% GlcNAc. All SCD variations used in switching assays were supplemented with 5 μg/mL Phloxine B to stain opaque colonies/sectors on agar plates [86].
Plasmid construction
Several plasmids were constructed for genomic integration by CRISPR. pADH143 (gift from Aaron Hernday, UC Merced) was amplified by inverse PCR with oligos 4673/4852, gel purified and digested with DpnI. Oligos 6722/6723 were annealed together and inserted into the linearized pADH143 by circular polymerase extension cloning to yield pRB1719. A Golden-Gate-Assembly (GGA)-adapted version of pSFS2A [87] was created by ligation of a BsaI adapter between ApaI/XhoI sites to create pSFS2A-GGA (pRB1397). The adapter was created by annealing oligos 6048/6049 to produce a DNA molecule possessing ApaI and XhoI “sticky” ends. To create a CaCmWOR1 reintegration plasmid, three pieces were PCR amplified: (1) CaWOR1 5’ flank and DBD from genomic DNA (gDNA) with oligos 6726/6727, (2) CmWOR1 PrLD from pRB1307 with oligos 6730/6731, (3) CaWOR1 3’ flank from gDNA with oligos 6728/6729. The three PCR fragments were combined by GGA into pSFS2a-GGA with BsaI to yield pRB1721. To create a CaCmWOR1(KR-to-G) reintegration plasmid, three pieces were polymerase chain reaction (PCR) amplified: (1) C. albicans WOR1 5’ flank and DBD from C. albicans genomic DNA (gDNA) with oligos 6726/6727, (2) C. maltosa WOR1 PrLD KR-to-G mutant from pRB1455 (Gene Universal) with oligos 6730/6731, (3) C. albicans WOR1 3’ flank from gDNA with oligos 6728/6729. The three PCR fragments combined by GGA into pSFS2a-GGA with BsaI to yield pRB1723.
An OFI1 KO plasmid was created by PCR amplification of the 5’ upstream region of OFI1 from C. albicans SC5314 gDNA with 5811/5812 and the 3’ downstream region with 5813/5814. The 5’ flank and pSFS2a were digested with ApaI/XhoI and ligated together. The 3’ flank was then digested with SacI/SacII and ligated into pSFS2a-5’ flank that was digested with SacI/SacII to yield pRB1569.
A TUP1 KO plasmid was created via GGA with three pieces: (1) TUP1 5’ flank PCR amplified from gDNA with 7018/7019, (2) SatR PCR amplified from pSFS2a with 7022/7023, and (3) TUP1 3’ flank PCR amplified from gDNA with 7020/7021. The three PCR components were combined by GGA into pGGA-Select (pRB1754) (NEB) [88] with BsmBI to yield pRB2085.
A monomeric GFP (mGFP) plasmid was created by PCR amplification of dimerizing GFP (dGFP) from pSJS1488 (gift from Steven Sandler, UMass Amherst) into two pieces, split at residue A206, with oligos 8714/8715 and 8716/8717, to mutate the alanine at residue 206 into lysine (A206K). The two PCR products were combined by GGA with BsmBI-HFv2 into pGGA-Select to generate pRB2206. mGFP was amplified from pRB2206 with oligos 8718/8719, digested with XhoI, and ligated into pSFS2a that was digested with XhoI and Antarctic Phosphatase (NEB) treated to generate pSFS2a-mGFP (pRB2219).
To create a monomeric mEYFP, dEYFP was split into two pieces at residue A206 via PCR amplification from a LacI-EYFP plasmid [16] (pRB1208, a gift from Robert Tijan, UC Berkeley) with oligos 8269/8270 and 8271/8272, to mutate the alanine at residue 206 into lysine (A206K). The two EYFP PCR products were assembled by GGA using BsaI-HFv2 into pGGA-Select to generate pRB2060. pRB2060 was then used to generate mEYFP versions of dEYFP-LacI constructs. mEYFP was PCR amplified from pRB2060 with oligos 8275/8276, digested with NheI/BsrGI, and ligated into dEYFP-LacI vectors (pRB1208, pRB1411 and pRB1216 [43]) digested with the same to generate mEYFP-LacI (pRB2108), mEYFP-CmWor1PrLD-LacI (pRB2110), and mEYFP-Czf1PrLD-LacI (pRB2271). The mEYFP-Efg1 variant was generated by PCR amplifying mEYFP from pRB2060 with oligos 5580/8276 and Efg1NPrLD from pRB1222 [43] with oligos 5578/5579. Efg1NPrLD-mEYFP was then generated by fusion PCR joining the two PCR fragments together by PCR with oligos 5578/8276. The Efg1NPrLD-mEYFP product was digested with NheI/BsrGI and ligated into pRB1222 digested with the same to generate Efg1NPrLD-mEYFP-Efg1CPrLD-LacI (pRB2272). The mEYFP-Wor4 variant was created by first PCR amplifying mEYFP from pRB2060 with oligos 5673/8276 and Wor4NPrLD from pRB1266 [43] with oligos 5671/5672. Wor4NPrLD-mEYFP was created by fusion PCR of the two PCR fragments with oligos 5671/8276. The Wor4NPrLD-mEYFP product was digested with NheI/BsrGI and ligated into pRB1266 digested with the same to generate Wor4NPrLD-mEYFP-Wor4CPrLD-LacI (pRB2274).
The WOR1 3’ flanking region was PCR amplified from C. albicans SC5314 gDNA with oligos 8267/8268, digested with SacI/SacII and ligated into pSFS2a-GGA digested with the same to create pRB2099. Using pRB2099 as a base vector, we created four WOR1 AB plasmids: #1, WT (DBD-PrLD); #2, PrLD-DBD-PrLD; #3, DBD-PrLD_2_; and #4, PrLD-DBD-PrLD_2_. For #1, the WOR1 5’ region and open reading frame (ORF) were PCR amplified from gDNA with oligos 8277/8278 and assembled together by GGA with pRB2099 using BsaI-HFv2 to generate pRB2100. For #2, the WOR1 5’ region, WOR1 PrLD, and full WOR1 ORF were amplified from gDNA with oligos 8277/8279, 8280/8281, and 8282/8278, respectively. The three PCR products were assembled by GGA with pRB2099 using BsaI-HFv2 to generate pRB2102. For #3, the WOR1 5’ region and ORF were amplified from gDNA with oligos 8277/8283 and the WOR1 PrLD was amplified from gDNA with oligos 8284/8285. The two PCR products were assembled by GGA using pRB2099 and BsaI-HFv2 to generate pRB2106. For #4, four pieces were PCR amplified from gDNA: (1) WOR1 5’ region with oligos 8277/8279, (2) WOR1 PrLD with oligos 8280/8281, (3) WOR1 ORF with oligos 8282/8283, and (4) WOR1 PrLD with oligos 8284/8285. The four pieces were assembled by GGA with pRB2099 and BsaI-HFv2 to generate pRB2104.
To create a Wor1-dGFP construct for expression in E. coli, we first amplified GFP from pRB719 [43] in two parts using oligos 9529/9530 and 9531/9532, respectively. The two GFP pieces were assembled by GGA into pGGA-Select with BsmBI-V2, yielding pRB2390. pRB2390 was digested with BsiWI-HF and SacI-HF and ligated into pRB719 (digested with the same), yielding MBP-dGFP-Wor1PrLD (pRB2391).
Three plasmids were generated for rapamycin-inducible dimerization of Wor1: pSFS2a-FRB, pSFS2a-FRBmut and pSFS2a-RBP1. FRB or FRBmut were PCR amplified from C. albicans SC5314 WT (RZY47) or TOR1–1 (CAY14787) gDNA, respectively, with oligos 8639/8640, digested with KpnI/ApaI, and ligated into pSFS2a digested with the same to generate pRB2189 and pRB2388, respectively. RBP1 was PCR amplified from gDNA with oligos 8641/8642, digested with KpnI/ApaI, and ligated into pSFS2a digested with the same to generate pRB2190.
The OP4::mNeonGreen reporter plasmid was assembled from three PCR products: (1) OP4 5’ flanking region amplified from C. albicans SC5314 gDNA with oligos 8630/8599, (2) OP4 3’ flanking region amplified from gDNA with oligos 8600/8601, and (3) mNeonGreen-SAT1 amplified from pRB895 [69] with oligos 8602/8603. The three PCR products were assembled by GGA using BsaI-HFv2 in pGGA-Select to generate pRB2202.
C. albicans strain construction
Strains heterozygous for core white-opaque network TFs (AHR1, CZF1, EFG1, SSN6, WOR1, WOR2, WOR3, WOR4) were provided by Alexander Johnson (UCSF) and were LEU2 auxotrophic. Most double heterozygous C. albicans mutants were created using TF deletion plasmids containing the LEU2 auxotrophic marker flanked by 100–500 bp regions from the 5’ and 3’ homologous regions of each TF (S1 Appendix) [51]. These plasmids were digested with SbfI-HF and used in a lithium-acetate/PEG/heat shock transformation. Double heterozygote mutants created with the TF::LEU2 plasmids are listed in S1 Appendix and were validated by 5’ and 3’ junction check PCRs, with corresponding oligos listed in S1 Appendix. AHR1 + /Δ WOR4 + /Δ (CAY13821) and WOR3 + /Δ WOR4 + /Δ (CAY13862) double heterozygote mutants were generated by transforming a WOR4::LEU2 construct (PCR amplified from C. albicans strain AHY861, a gift from A. Hernday, with oligos 4472/5379) into AHR1 or WOR3 single heterozygotes. The double heterozygotes were validated by 5’ and 3’ junction check PCRs with oligos 4472/4835 and 4473/4834. EFG1 + /Δ SSN6 + /Δ (CAY13839), EFG1 + /Δ WOR3 + /Δ (CAY13844), and EFG1 + /Δ WOR4 + /Δ (CAY13846) double heterozygotes were generated by deleting one EFG1 allele from SSN6 + /Δ (AHY337 [37]), WOR3 + /Δ (AHY206, gift from A. Hernday), and WOR4 + /Δ (MLY1135 [38]) via transforming with ApaI/SacI digested pRB721 [56], and were validated by 5’ and 3’ junction check PCRs with oligos 4438/2284 and 4439/2286. These double heterozygotes were made nourseothricin sensitive by recycling the SAT1 marker as described [87]. Strains that were auxotrophic for LEU2 were transformed with a LEU2 reintegration product (LEU2 gene that was PCR amplified from C. albicans gDNA with oligos 6056/5055), and integration confirmed by PCR with oligos 5058/3965.
The remaining copy of EFG1 was deleted from an EFG1 + /Δ strain (AHY119) and from an EFG1 + /Δ WOR1 + /Δ strain (CAY14198) by transforming with ApaI/SacI digested pRB721. EFG1 absence was confirmed with oligos 4479/6548 and validated with 5’ and 3’ junction check PCRs using oligos 7158/4438 and 4439/6984, respectively, to yield efg1Δ/Δ (CAY17215) and efg1Δ/Δ WOR1 + /Δ (CAY17218).
WOR1 heterozygotes were created by removing one copy of WOR1 from strain RZY47 [42] via transforming with pRB34 digested with KpnI/SacI. WOR1 heterozygosity was confirmed with 5’ and 3’ PCR junction checks using oligos 1463/4438 and 4439/6672. The presence of either WOR1 allele A (CAY15051) or WOR1 allele B (CAY15054) was determined by PCR amplifying WOR1 ORF using oligos 2390/4239 and digesting with BstEII: allele A (G125, S633) is cut while allele B (A125, N633) is not.
Heterozygotes for auxiliary TFs ASH1, NDT80, RLM1, RPN4 were created by transforming a leu2Δ/Δ strain (AHY120) with Sbf1-HF digested TF::LEU2 plasmids, creating ASH1 + /Δ (CAY16732), NDT80 + /Δ (CAY16734), RLM1 + /Δ (CAY16737), RPN4 + /Δ (CAY16739). Junction checks were performed by PCR using oligos listed in S1 Appendix. TUP1 heterozygotes were created by transforming WT strain AHY135 with the TUP1 KO plasmid pRB2085 digested with PacI. Deletion of TUP1 was confirmed by PCR using 4438/6952 and 4439/6953. SAT1 was then recycled to generate CAY16744.
Additional single and double heterozygous mutants were generated in an SC5314 strain expressing a WOR1(KR-to-G) variant which contains the DNA binding domain of C. albicans WOR1 and the PrLD from C. maltosa WOR1 in which the K/R residues were mutated to G residues. The WOR1(KR-to-G) variant was generated by transforming strain AHY135 via the LEUpOUT CRISPR system [89] with CmLEU2 Cas9 (pADH140) together with a CaWOR1 targeting gRNA (pRB1719) and repair template (pRB1723) to generate strain CAY12264. Transformations were validated by PCR using oligos 6911/6915 and the absence of native WOR1 was confirmed by PCR using oligos 6911/6914. A WOR1(KR-to-G) heterozygote (CAY14328) was generated by deleting one copy of WOR1 from CAY12264 via transformation with KpnI/SacI-digested pRB34 and recycling the SAT1 selectable marker, and validated by junction check PCRs with oligos 1393/4438 and 2902/4439. LEU2 was replaced with a SAT1 marker in CAY12264 and CAY14328 by transforming these strains with a PCR product amplified from pSFS2a with oligos 8340/8341 and selection on SD Leu- NAT+ plates, and validated by PCR with oligos 4061/4438 and 4439/6057. SAT1 was recycled to yield SAT-sensitive WOR1(KR-to-G) (CAY15131) and WOR1(KR-to-G) heterozygote (CAY15133). TF::LEU2 plasmids (digested with Sbf1-HF) were used in transformations with CAY15131 and CAY15133 to create single and double heterozygote mutants (S1 Appendix). Transformants were validated by 5’ and 3’ junction check PCRs, with corresponding oligos listed in S1 Appendix. WOR3 single and double heterozygotes were generated by PCR amplifying a WOR3::LEU2 deletion cassette from AHY850 (gift from A. Hernday) with oligos 4468/4469 and transforming into CAY15131 and CAY15133 to create WOR3 + /Δ (CAY15267) and WOR1 + /Δ WOR3 + /Δ (CAY15270), and validated by junction check PCRs with oligos 4470/4835 and 4834/4471. WOR4 single and double heterozygotes were generated by PCR amplifying a WOR4::LEU2 deletion cassette from AHY861 gDNA with oligos 4472/5379 to create *WOR4 + /*Δ (CAY15273) and WOR1 + /Δ WOR4 + /Δ (CAY15276), and validated by junction check PCRs with oligos 4472/4835 and 4473/4834. FLO8 or OFI1 single and double heterozygotes were generated by transforming strains CAY15131 and CAY15133 with ApaI/SacI-digested pRB989 [90] or pRB1569 plasmids to delete one copy of FLO8 or OFI1, respectively. FLO8 and OFI1 heterozygotes were validated by junction check PCRs with oligos 6425/4438 + 4439/6426, and 7182/4438 + 4439/7181, respectively. SAT1 was recycled and LEU2 was added back by transforming with DNA PCR amplified from C. albicans gDNA with oligos 6056/5055, and junction checked by PCR with 5058/3965 to yield the following strains: FLO8 + /Δ (CAY15177), WOR1 + /Δ FLO8 + /Δ (CAY15180), OFI1 + /Δ (CAY15222), and WOR1 + /Δ OFI1 + /Δ (CAY15225). TUP1 heterozygotes were created by transforming CAY15131 and CAY15133 with the TUP1 KO plasmid (pRB2085) digested with PacI. Deletion of TUP1 was confirmed by PCR using oligos 4438/6952 and 4439/6953. SAT1 was recycled generating TUP1 + /Δ (CAY16750), and WOR1 + /Δ TUP1 + /Δ (CAY16755).
To generate GFP-tagged TF strains, mGFP and dGFP were PCR amplified from pRB2219 and pADH76 [38], respectively, and used to transform RZY47. AHR1-GFP constructs were PCR amplified with oligos 8779/8880 to generate AHR1/AHR1-mGFP (CAY15336) and AHR1/AHR1-dGFP (CAY15361), validated by junction check PCRs with oligos 4902/8817 and 4439/4903. The second AHR1 allele was GFP-tagged and checked by PCR with oligos 4439/4903, and oligos 4902/4903 + 3814/4903 were used to confirm both alleles were tagged, generating AHR1-mGFP/AHR1-mGFP (CAY15471) and AHR1-dGFP/AHR1-dGFP (CAY15468). CZF1-GFP constructs were PCR amplified with oligos 8777/8778 and used to generate CZF1/CZF1-mGFP (CAY15340) and CZF1/CZF1-dGFP (CAY15338), validated by junction check PCRs with oligos 3804/3925 and 4439/4899. The second CZF1 allele was GFP-tagged and checked by PCR with oligos 4439/4899, and oligos 5477/4899 and 3814/4899 were used to confirm both alleles were tagged, generating CZF1-mGFP/CZF1-mGFP (CAY15629) and CZF1-dGFP/CZF1-dGFP (CAY15642). EFG1-GFP tags were PCR amplified with oligos 8773/8774 to generate EFG1/EFG1-mGFP (CAY15446) and EFG1/EFG1-dGFP (CAY15464), validated by junction check PCRs with oligos 4479/8817 and 4439/7157. The second EFG1 allele was GFP-tagged and checked by PCR with oligos 4439/6984, and oligos 4561/6984 + 3814/6984 were used to confirm both alleles were tagged, generating EFG1-mGFP/EFG1-mGFP (CAY15560) and EFG1-dGFP/EFG1-dGFP (CAY15558). SSN6-GFP constructs were PCR amplified with oligos 8809/8810 to generate SSN6/SSN6-mGFP (CAY15449) and SSN6/SSN6-dGFP (CAY15447), validated by junction check PCRs with oligos 5693/8817 and 4439/7191. The second SSN6 allele was GFP-tagged and checked by PCR with oligos 4439/5684, and oligos 5693/5684 and 162/5684 were used to confirm both alleles were tagged, generating SSN6-mGFP/SSN6-mGFP (CAY15608) and SSN6-dGFP/SSN6-dGFP (CAY15605). WOR1-GFP tags were amplified with oligos 8771/8772 to generate WOR1/WOR1-mGFP (CAY15359) and WOR1/WOR1-dGFP (CAY15334), validated by junction check PCRs with oligos 25/8871 and 4439/6916. The second WOR1 allele was GFP-tagged and checked by PCR with oligos 4439/6916, and oligos 25/3925 and 25/6916 were used to confirm both alleles were tagged, generating WOR1-mGFP/WOR1-mGFP (CAY15466) and WOR1-dGFP/WOR1-dGFP (CAY15346). WOR2-GFP tags were PCR amplified with oligos 8811/8812 to generate WOR2/WOR2-mGFP (CAY15453) and WOR2/WOR2-dGFP (CAY15451), validated by junction check PCRs with oligos 3801/8817 and 4439/4889. The second WOR2 allele was GFP-tagged and checked by PCR with oligos 4439/4889, and oligos 3801/4889 and 3814/4889 were used to confirm both alleles were tagged, generating WOR2-mGFP/WOR2-mGFP (CAY15477) and WOR2-dGFP/WOR2-dGFP (CAY15474). WOR3-GFP constructs were PCR amplified with oligos 8813/8814 and used to generate WOR3/WOR3-mGFP (CAY15457) and WOR3/WOR3-dGFP (CAY15455), validated by junction check PCRs with oligos 3944/8817 and 4439/4469. The second WOR3 allele was GFP-tagged and checked by PCR with oligos 4439/4469, and oligos 3944/4469 and 3814/4469 were used to confirm both alleles were tagged, generating WOR3-mGFP/WOR3-mGFP (CAY15564) and WOR3-dGFP/WOR3-dGFP (CAY15562). WOR4-GFP tags were PCR amplified with oligos 8815/8816 and used to generate WOR4/WOR4-mGFP (CAY15461) and WOR4/WOR4-dGFP (CAY15459), validated by junction check PCRs with oligos 3803/8817 and 4439/4473. The second WOR4 allele was GFP-tagged and checked by PCR with oligos 4439/4473, and oligos 3803/4473 and 3814/4473 were used to confirm both alleles were tagged, generating WOR4-mGFP/WOR4-mGFP (CAY15610) and WOR4-dGFP/WOR4-dGFP (CAY15631).
Efg1-GFP Wor1-GFP strains were generated by PCR amplifying mGFP-SatR and dGFP-SatR tags for WOR1 from pRB2219 and pADH76, respectively, with oligos 8771/8772. CAY15446 was transformed to tag WOR1 with mGFP and CAY15464 was transformed to tag WOR1 with dGFP. Junction checks were performed by PCR with oligos 25/8817 and 4439/6916. SAT1 was recycled yielding EFG1-mGFP WOR1-mGFP (CAY16791) and EFG1-dGFP WOR1-dGFP (CAY16794).
Strains with altered Wor1 valency were generated by integrating the four WOR1 addback constructs (#1 – pRB2100, #2 – pRB2102, #3 – pRB2106, or #4 – pRB2104) digested with ApaI/SacI into wor1Δ*/*Δ strain CAY2019. Correct integration of each construct was checked by PCR with oligos 1393/4438 and 4439/6672. SAT1 was recycled from each strain to yield: WOR1 AB #1 (CAY14499), WOR1PrLD-WOR1 AB #2 (CAY14502), WOR1-WOR1PrLD AB #3 (CAY14507), and WOR1PrLD-WOR1-WOR1PrLD AB #4 (CAY14505). WOR1 was C-terminally tagged with mNeonGreen in all four constructs by transforming with PCR cassettes amplified from pRB2174 with oligos 8439/8440 (constructs #1 and #2) or 9208/8440 (constructs #3 and #4) to yield WOR1-mNeonGreen (CAY16428), WOR1PrLD-WOR1-mNeonGreen (CAY16430), WOR1-WOR1PrLD-mNeonGreen (CAY16432), and WOR1PrLD-WOR1-WOR1PrLD-mNeonGreen (CAY16434). Transformations were checked by PCR using oligos 5018/7594 and 9075/6916.
The rapamycin-inducible Wor1 dimerization strains were created in a TOR1–1 (TOR1 S1972A) mutant (JRB212, gift from Joseph Heitman, Duke University). Both copies of RBP1 were removed from JRB212 via transformations with PCR cassettes amplified from pSFS2a with oligos 8286/8287. Transformations were checked by PCR with oligos 8332/8333 and SAT1 was recycled to generate CAY14483. TOR1 was removed from CAY14483 by transforming with a cassette PCR amplified from pSFS2a with oligos 8334/8335 and integrants were checked by PCR with oligos 4439/8337. The resulting mutant retained the TOR1–1 allele (and not the WT TOR1 allele), confirmed by PCR on the strain with oligos 8533/8534 and digestion with NheI, which only cuts the wildtype allele. SAT1 was recycled to generate CAY14699, which was transformed with ApaI/SacI digested pRB727 to remove MTLα, verified by PCR with oligos 1/2 and 3/4. SAT1 was recycled to generate CAY14787. FRB-SAT1 and FRBmut-SAT1 were PCR amplified from pRB2189 and pRB2388, respectively, with oligos 8710/8437 to fuse with the WOR1 ORF in the switching competent rbp1Δ*/*Δ TOR1–1 + /Δ strain, verified by junction check PCR with oligos 8694/6911 and 4439/6672. SAT1 was recycled to generate WOR1/WOR1-FRB (CAY14614) and WOR1/WOR1-FRBmut (CAY16853). RBP1-SAT1 was PCR amplified from pRB2190 with oligos 8711/8437 and transformed into CAY14787 (verified by PCR checks with oligos 8696/6911 and 4439/6672) and into CAY14614 (verified by PCR checks with oligos 25/4438 and 4439/6672, while PCR with oligos 25/8694, 8695/6672, and 25/6916 were used to confirm that both alleles were tagged). SAT1 was recycled to generate strains WOR1/WOR1-RBP1 (CAY14620) and WOR1-FRB/WOR1-RBP1 (CAY14625). FRBmut-SAT1 was PCR amplified from pRB2388 with oligos 8710/8437 to fuse with the WOR1 ORF in CAY16420, verified by junction check PCRs with oligos 25/4438 and 4439/6672, while PCR with oligos 25/8694, 8695/6672, and 25/6916 were used to confirm that both alleles were tagged. SAT1 was recycled to generate WOR1-FRBmut/WOR1-RBP1 (CAY16856). CAY14625 was transformed with PacI-digested pRB2202 to incorporate the OP4::mNeonGreen reporter and verified by PCR with oligos 1389/5823 and 4439/6279, creating CAY14781.
The second WOR1 allele was fused with RBP1 by transforming CAY14620 with a PCR cassette amplified from pRB2190 with oligos 8711/8437. Integration was confirmed by PCR checks with oligos 25/4438 and 4439/6916; the first allele was still tagged by PCR checks with oligos 25/8696 and 8697/6916. SAT1 was recycled generating WOR1-RBP1/WOR1-RBP1 (CAY15820). Using two rounds of transformations starting with CAY14787 and CAY15820, respectively, WOR2-FRB/WOR2-FRB and WOR1-RBP1/WOR1-RBP1 WOR2-FRB/WOR2-FRB were created by transforming with FRB cassettes PCR amplified from pRB2189 with 8984/8812. The first WOR2-FRB allele was checked by PCR with oligos 8693/4889 and the second WOR2-FRB allele was checked by PCR with oligos 4439/4889. SAT1 was recycled generating WOR2-FRB (CAY16089) and WOR1-RBP1 WOR2-FRB (CAY16103). Using two rounds of transformations starting with CAY14787 and CAY15820, respectively, WOR4-FRB/WOR4-FRB and WOR1-RBP1/WOR1-RBP1 WOR4-FRB/WOR4-FRB were created by transforming with FRB cassettes PCR amplified from pRB2189 with oligos 8986/8816. The first WOR4-FRB allele was checked by PCR with oligos 8693/4473 and the second WOR4-FRB allele was checked by PCR with oligos 4439/4473. SAT1 was recycled generating WOR4-FRB (CAY16093) and WOR1-RBP1 WOR4-FRB (CAY16106).
White-opaque switching assays
For white-to-opaque switching assays, C. albicans strains were cultured on YPD agar plates at 30°C to isolate single colonies 1–7 d prior to the experiment. SCD or derivative plates were poured 1–4 d prior to the experiment. C. albicans colonies in the white state were collected, diluted in H_2_O, plated for ~100 colonies per plate, and incubated for 7 d. After the 7-day incubation, white-to-opaque switching frequencies were scored by dividing the number of opaque colonies (whole opaque colonies or white colonies with opaque sectors) by the total colony number. Each biological replicate was performed with at least two technical replicates, each of which had 50–130 colonies. For rapamycin-induced switching assays, SCD plates were supplemented with either 1 μg/mL rapamycin in ethanol or with ethanol alone as a vehicle control (1 mL 100% ethanol with or without rapamycin per 1 L SCD). Opaque-to-white assays were performed using the same methods except starting with opaque cells instead of white cells.
For complex haploinsufficiency (CHI) assays, switching frequencies in TF heterozygotes were normalized to those in WT cells. As white-opaque switching frequencies varied from experiment to experiment, biological replicates were normalized to WT controls analyzed on the same day. Normalized switching frequencies from single heterozygous C. albicans mutants were multiplied together to determine expected switching frequencies of double heterozygous mutants.
Gene expression by qRT-PCR
C. albicans strains were grown on SCD plates before overnight culture in liquid SCD at 22°C. Cultures were diluted 1:20 in fresh SCD medium and grown for 5.5 h at 22°C to reach mid-log phase before RNA was harvested. Cell state (white or opaque) was confirmed by microscopy. Opaque WOR1 + /Δ heterozygotes were unstable in SCD at 22°C so RNA was harvested from WT opaque and WOR1 heterozygote opaque colonies grown for 5 d on SCD + 1% GlcNAc plates at 22°C which supported a stable opaque state. RNA was harvested with the MasterPure Yeast RNA Purification Kit (BioSearch). RNA samples were DNAse I treated and reverse transcribed into cDNA with the iScript Reverse Transcription kit (Bio-Rad). cDNA was used at a final dilution of 1:100 with iTaq Universal SYBR Green Supermix (Bio-Rad) for qRT-PCR. Oligos used for qRT-PCR are described in S1 Appendix. qRT-PCR reactions were performed with the following conditions: 95°C for 3 min, [95°C for 30 s, 54.2°C for 30 s, 60°C for 30 s] for 49 cycles, 60°C for 10 min on a CFX384 Touch Real-Time PCR Detection System (BioRad). qRT-PCR data analysis was performed with the ΔΔ CT method, using ACT1 as a reference gene and normalized to WT strains for each gene analyzed. Three technical replicates for each biological replicate were used for each gene analyzed.
Yeast cell imaging and fluorescence quantification
C. albicans strains were grown overnight in SCD medium at 22°C. Overnight cultures were diluted 1:5 in fresh medium and Hoescht 33258 was added to a final concentration of 1 μg/mL. Cultures were rotated at 22°C for 20 min, washed in fresh medium, and made into wet mount slides. Cells were imaged on a Zeiss Axio Observer Z1 inverted fluorescence microscope at 63X magnification together with a 1.6X OptoVar. The microscope was equipped with AxioVision (v.4.8) and Zen software (v.3.0 blue edition). Post-imaging processing was carried out in FIJI (ImageJ v.2.9.0).
To quantify TF expression, cell nuclei were outlined using the Hoescht stain in FIJI, overlayed on the GFP channel, and analyzed for mean fluorescence intensity. Background fluorescence was corrected for by measuring the fluorescence in an area without cells and subtracting it from the nuclear fluorescence intensity. At least 10 cells were imaged per experiment, and experiments were conducted at least in duplicate.
Mammalian cell culture, live cell imaging, and LacO array analysis
A U2OS (human sarcoma) cell line engineered to contain ~50,000 copies of the LacO array was used [16]. U2OS cells were maintained at 37°C with 5% CO_2_ in Dulbecco’s modified Eagle’s medium (DMEM, Thermo Fisher Scientific) supplemented with 10% heat-inactivated fetal bovine serum (FBS, Thermo Fisher Scientific) and 1% penicillin-streptomycin (Thermo Fisher Scientific). To transfect constructs, U2OS cells were seeded onto 24-well glass bottom plates (Cellvis). The following day, DMEM + FBS + 1% pen/strep was replaced with DMEM without additives. LacI plasmid constructs were added to wells with Lipofectamine 3000, P3000, and OptiMEM (Thermo Fisher Scientific) according to the manufacturer instructions. After 4 h, DMEM + FBS + 1% pen/strep replaced the DMEM without additives. Transfected U2OS cells were incubated overnight at 37°C with 5% CO_2_ and imaged with an APEXVIEW APX100 inverted fluorescence microscope equipped with a Hammamatsu Orca-Fusion CMOS camera and gradient contrast at 40X magnification. The microscope was equipped with cellSens software (V4.1).
Image analysis was performed in FIJI (ImageJ v.2.9.0). A perimeter was drawn around the LacO array (the brightest focus) inside the U2OS nucleus and was analyzed for mean fluorescence intensity and area. Mean fluorescence intensity was corrected for by subtracting the intensity from a spot immediately outside the array. At least 20 cells were imaged per experiment, and experiments were conducted at least in duplicate.
Protein purification
Protein expression constructs were transformed into BL21 (DE3) Star E. coli cells. Cells were grown overnight at 37°C in Luria broth (LB) medium, diluted 1:100 in fresh LB, grown at 37°C to an OD_600_ of 0.7-0.9, and induced with 1 mM isopropyl β-D-1-thiogalactopyranoside at 25°C for 4 h. Cells were lysed with lysozyme and sonicated in lysis buffer (10 mM Tris, pH 7.4, 1 M NaCl, 10 mM imidazole, and a protease inhibitor cocktail; Thermo Scientific Pierce Protease Inhibitor). Wor1 protein was purified by nickel affinity column chromatography, followed by size exclusion column chromatography on a Sephacryl S300 26/60 column (GE Healthcare). Protein fractions were collected and concentrated in Amicon Ultra 50K concentrators (Millipore), then frozen in liquid nitrogen and stored at -80°C.
Phase separation assays
Proteins were thawed at 22°C and diluted into 10 mM Tris-HCl, pH 7.4, 150 mM NaCl buffer. Proteins were concentrated in Amicon Ultra 0.5-ml centrifugal filter units (Millipore) and concentrations determined using a Nanodrop 2000c (Thermo Fisher Scientific). Extinction coefficients were predicted from sequence compositions using ProtParam (Expasy). Samples were further diluted in 10 mM Tris-HCl, pH 7.4, 150 mM NaCl to the appropriate concentration for each assay. Samples were TEV treated with 1:10 ratio TEV (0.3 mg/ml) to protein and incubated for 1 h at 30°C. 5% PEG-8000 was included as a molecular crowding agent. Following TEV treatment, proteins were either imaged or centrifuged to quantify phase separation. For droplet imaging, Wor1 constructs were imaged in 10-well chamber slides (Polysciences) with 2 μl protein solution per well sealed under a glass coverslip immediately or after aging for the indicated time at 22°C. Images were acquired with a Zeiss Axio Observer Z1 inverted fluorescence microscope for fluorescence and DIC imaging at 63x magnification. Post-imaging processing was carried out in FIJI (ImageJ v.2.9.0).
To quantify Wor1 phase separation, absorbance at 280 nm (A_280_) was first measured to calculate total protein concentration. Protein solutions were then centrifuged at 14,000g for 10 min to separate phase-separated protein from soluble protein. The A_280_ of the supernatant was measured to calculate soluble protein. The A_280_ corresponding to TEV protease was also measured and subtracted from the measured A_280_ values. Phase separated protein was calculated by subtracting the supernatant concentration from the total concentration. Finally, the saturation concentration was calculated by subtracting the phase separation concentration from the total starting protein concentration.
Supporting information
S1 FigComparison of WOR1 A and B alleles in white-to-opaque switching.(A) Allelic differences in the WOR1 ORF. Allele A: G125, S633; allele B: A125, N633. (B) Strains were grown on SCD + 1% GlcNAc in the presence of 10% CO_2_ for 24 h before outgrowth in normoxia. Switching frequencies were determined after growth at 22°C for 7 days. Black dots indicate biological replicates and error bars show SEM. Statistical analysis was performed using ordinary one-way ANOVA with Dunnett’s multiple-comparison test, in which all switching percentages were compared to each other. ***P < 0.001; ****P < 0.0001.(S1_Fig.TIF)
S2 FigGene expression of network white-opaque TFs in heterozygotes.(A-C) WT and TF heterozygote strains were grown to mid-log phase in liquid SCD before RNA was harvested for qRT-PCR analysis. Mean normalized expression is shown. Black dots indicate biological replicates, error bars show SEM, and the dotted line corresponds to gene expression in the WT control. (A) TF gene expression from corresponding TF single heterozygotes is expressed relative to ACT1 and normalized to WT in both white (left) and opaque (right) cell types. Statistical analysis was performed using a two-tailed Student’s t-test. *P < 0.05. (B) TF gene expression from WT white cells is expressed relative to ACT1 and normalized to the WT opaque cells. Statistical analysis was performed using a two-tailed Student’s t-test, in which the fold expression was compared between the white and opaque cell states. *P < 0.05; **P < 0.01. (C) WOR1, WOR3, and WOR4 gene expression is shown (relative to ACT1 and normalized to WT opaque) in opaque WOR3 and WOR4 single heterozygotes and opaque WOR3 WOR4 double heterozygotes.(S2_Fig.TIF)
S3 FigCaWOR1 vs. CaCmWOR1 constructs in white-to-opaque switching.(A) Genotypic differences between CaWOR1, CaCmWOR1, and CaCmWOR1(KR-to-G). All three constructs contain the C. albicans WOR1 DNA binding domain (DBD; orange). CaWOR1 contains the C. albicans WOR1 PrLD (blue) while CaCmWOR1 constructs contain the C. maltosa WOR1 PrLD (light cyan). (B) All three constructs were grown on SCD (white) or SCD supplemented with 1% GlcNAc (gray) and switching frequencies determined after growth at 22°C for 7 days. Black dots indicate biological replicates and error bars show SEM. Statistical analysis was performed using ordinary one-way ANOVA with Dunnett’s multiple-comparison test, in which normalized switching frequencies were compared between each strain. ***P < 0.001; ****P < 0.0001; ns = not significant.(S3_Fig.TIF)
S4 FigWhite-to-opaque switching frequencies of auxiliary TF heterozygotes.Strains were grown on SCD + 1% GlcNAc + 16 h 10% CO_2_ before outgrowth on normoxia. Switching frequencies were determined after growth at 25°C for 7 days. Mean white-to-opaque switching percentages are shown on the left y-axis and mean normalized white-to-opaque switching frequencies are shown on the right y-axis relative to the TF + / + control from same-day experiments. Black dots indicate biological replicates and error bars show SEM. Statistical analysis was performed using ordinary one-way ANOVA with Dunnett’s multiple-comparison test, in which heterozygote switching frequencies were compared to the WT strain. ****P < 0.0001.(S4_Fig.TIF)
S5 FigWhite-to-opaque switching frequencies of double TF heterozygotes in a WOR1(KR-to-G) strain background.(A) Genotypes of the strains used. (B) WT, single heterozygotes and double heterozygotes in the WOR1(KR-to-G) strain background were grown on SCD + 1% GlcNAc in 10% CO_2_ for 20 h before outgrowth under normoxia. Switching frequencies were determined after growth at 25°C for 7 days. Mean white-to-opaque switching percentages are shown on the left y-axis and mean normalized white-to-opaque switching frequencies are shown on the right y-axis relative to WT from same-day experiments. Black dots indicate biological replicates and error bars show SEM. WOR1 single heterozygotes and double heterozygotes are shown in white; WT and TF single heterozygotes are shown in gray. Statistical analysis was performed using ordinary one-way ANOVA with Dunnett’s multiple-comparison test, in which switching frequencies were compared between each strain. *P < 0.05; **P < 0.01; ***P < 0.001; ****P < 0.0001.(S5_Fig.TIF)
S6 FigSwitching assays investigating EFG1 and WOR1 epistasis.(A) WT, single, and double heterozygote strains in the WOR1(KR-to-G) background were grown on SCD. (B) WT, single, and double heterozygote strains in the WOR1(WT) background were grown on SCD + 1% GlcNAc + 20 h 10% CO_2_ before outgrowth in normoxia. (C) WT and WOR1 + /Δ (white cells) or efg1Δ/Δ and efg1Δ/ΔWOR1 + /Δ (gray cells) were grown on SCD. In A-C, switching frequencies were determined after growth at 25°C for 7 days. For A and B, mean white-to-opaque switching percentages are shown on the left y-axis and mean normalized white-to-opaque switching frequencies are shown on the right y-axis relative to the WT control from same-day experiments. For C, mean percentages of switching to the opaque state are shown on the left y-axis. Black dots indicate biological replicates and error bars show SEM. Statistical analysis was performed using ordinary one-way ANOVA with Dunnett’s multiple-comparison test, in which switching frequencies of each strain were compared to each other. ****P < 0.0001.(S6_Fig.TIF)
S7 FigWor1-mNeonGreen construct expression and white-to-opaque switching.(A) Wor1 PLD variants were C-terminal tagged with mNeonGreen. (B) Wor1-mNeonGreen levels were quantified in opaque cells. Mean mNeonGreen expression levels are shown with error bars representing SEM. Statistical analysis was performed using ordinary one-way ANOVA with Dunnett’s multiple-comparison test, in which normalized switching frequencies were compared between each strain. *P < 0.05; **P < 0.01; ***P < 0.001; ****P < 0.0001. (C) Representative images of untagged or mNeonGreen-tagged opaque cells. Scale bar, 10 μm. (D) Strains were grown on SCD (left) or SCD + 48 h 5% CO_2_ before outgrowth in normoxia (right). Switching frequencies were determined after growth at 25°C for 7 days. Mean white-to-opaque switching percentages are shown. Black dots indicate biological replicates and error bars show SEM. Statistical analysis was performed using ordinary one-way ANOVA with Dunnett’s multiple-comparison test, in which switching frequencies of each strain were compared to each other. *P < 0.05; **P < 0.01; ****P < 0.0001.(S7_Fig.TIF)
S8 FigTF-GFP expression in white and opaque cells.(A) TF-GFP levels were quantified in white and opaque cells. Cells were untagged (white bars) or tagged with mGFP (light cyan bars) or with dGFP (light green bars). Mean GFP expression levels are shown with error bars representing SEM, and the dotted line corresponding to the untagged control. Statistical analysis was performed using a two-tailed Student’s t-test in which mean GFP expression was compared between mGFP and dGFP for each TF. ****P < 0.0001. (B) Representative images of untagged cells or cells with both alleles of a TF tagged with mGFP or dGFP. Images are representative of two independent experimental replicates. Scale bar, 10 μm.(S8_Fig.TIF)
S9 FigRapamycin-induced opaque cells.(A) Opaque cells from C. albicans WOR1-FRB/WOR1-RBP1 strain imaged in DIC. Scale bar, 10 μm. (B) White colonies with opaque sectors (denoted by red arrows) and corresponding white and opaque cells from a WOR1-FRB/WOR1-RBP1 strain with an OP4::mNeonGreen reporter. Scale bar, 10 μm. (C) WOR1-FRB/WOR1-RBP1 opaque and white cells cultured on CHROMagar at 22°C for six days.(S9_Fig.TIF)
S10 FigWhite-to-opaque switching in strains harboring rapamycin-inducible TF-TF dimerization constructs.(A) Genotypes at WOR1, WOR2, and WOR4 loci in the six C. albicans strains tested. (B) Strains were grown on SCD medium at 22°C with 1 μg/mL rapamycin or with a vehicle control for 7 days. Mean white-to-opaque switching percentages are shown; black dots indicate biological replicates, and error bars show SEM.(S10_Fig.TIF)
S1 AppendixPlasmids, oligonucleotides, and strains used in this study.(S1_Appendix.XLSX)
S2 AppendixExperimental data for each figure in this study.(S2_Appendix.XLSX)
The reference list from the paper itself. Each links out to its DOI / PubMed record.
- 1Sorrells TR, Johnson AD. Making sense of transcription networks. Cell. 2015;161(4):714–23. doi: 10.1016/j.cell.2015.04.014 25957680 PMC 4531093 · doi ↗ · pubmed ↗
- 2Wilkinson AC, Nakauchi H, Göttgens B. Mammalian transcription factor networks: recent advances in interrogating biological complexity. Cell Syst. 2017;5(4):319–31. doi: 10.1016/j.cels.2017.07.004 29073372 PMC 5928788 · doi ↗ · pubmed ↗
- 3Balsalobre A, Drouin J. Pioneer factors as master regulators of the epigenome and cell fate. Nat Rev Mol Cell Biol. 2022;23(7):449–64. doi: 10.1038/s 41580-022-00464-z 35264768 · doi ↗ · pubmed ↗
- 4Ackermann M. A functional perspective on phenotypic heterogeneity in microorganisms. Nat Rev Microbiol. 2015;13(8):497–508. doi: 10.1038/nrmicro 3491 26145732 · doi ↗ · pubmed ↗
- 5Norman TM, Lord ND, Paulsson J, Losick R. Stochastic switching of cell fate in microbes. Annu Rev Microbiol. 2015;69:381–403. doi: 10.1146/annurev-micro-091213-112852 26332088 · doi ↗ · pubmed ↗
- 6Martins BMC, Locke JCW. Microbial individuality: how single-cell heterogeneity enables population level strategies. Curr Opin Microbiol. 2015;24:104–12. doi: 10.1016/j.mib.2015.01.003 25662921 · doi ↗ · pubmed ↗
- 7Hnisz D, Abraham BJ, Lee TI, Lau A, Saint-AndréV, Sigova AA, et al. Super-enhancers in the control of cell identity and disease. Cell. 2013;155(4):934–47. doi: 10.1016/j.cell.2013.09.053 24119843 PMC 3841062 · doi ↗ · pubmed ↗
- 8Takahashi K, Yamanaka S. Induction of pluripotent stem cells from mouse embryonic and adult fibroblast cultures by defined factors. Cell. 2006;126(4):663–76. doi: 10.1016/j.cell.2006.07.024 16904174 · doi ↗ · pubmed ↗