Correction: CT-based radiomics integrated model for brain metastases in stage III/IV ALK-positive lung adenocarcinoma patients
Fen Wang, Caiyun Li, Shuke Li, Teng Zhang, Tongfu Yu, Wei Zhang, Jing He, Mei Yuan, Wen Gao

Abstract
Genes, proteins, chemicals, diseases, species, mutations and cell lines named across the full text — each resolved to its canonical identifier and authoritative record.
Click any figure to enlarge with its caption.
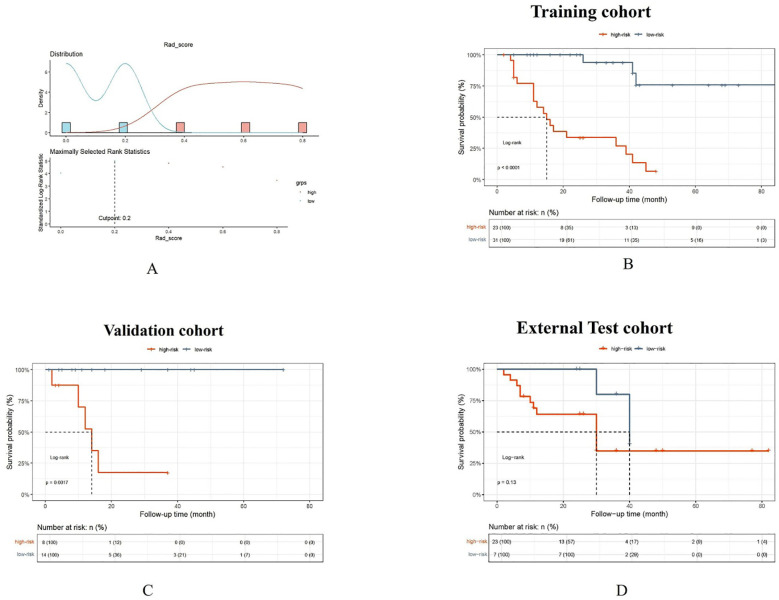 Figure 1
Peer Reviews
No public reviews on file for this paper yet. If you reviewed it on a platform where reviews are public (OpenReview, ICLR, NeurIPS, ICML), you can paste yours below so the community can read it here.
Videos
No videos yet. Explain this paper in a talk, walkthrough, or lecture? Add one.
Taxonomy
TopicsRadiomics and Machine Learning in Medical Imaging · Lung Cancer Diagnosis and Treatment · Medical Imaging Techniques and Applications
There was a mistake in the caption of Figure 7 as published. The Rad_score threshold was computed using the surv_cutpoint function not Xtile, which was mistakenly attributed to wrong reference. Upon rechecking the sources, we confirmed that the correct citation should be Xi J, Yin J, Liang J, Zhan C, Jiang W, Lin Z, et al. Prognostic Impact of Radiological Consolidation Tumor Ratio in Clinical Stage IA Pulmonary Ground Glass Opacities. Front Oncol. (2021)12;11:616149. doi: 10.3389/fonc.2021.616149. The corrected legend appears below.
“The Rad_score threshold (0.20) was computed by surv_cutpoint function for dividing patients into high- and low-risk groups (A). The Kaplan-Meier cumulative event curve for survival status shows that the patients in the low-risk group showed significantly better PFS compared to those in the high-risk group in the training cohort (B) and validation cohort (C), whereas the survival difference between the low- and high-risk groups was not statistically significant in the external test cohort (D). But the longer medial survival was seen in the low-risk group than those in the high-risk group in three cohorts”.
Furhtermore, the reference for (38) was incorrectly written as “Li Y, Zhao J, Li R, Yao X, Dong X, Zhao Y, et al. Predicting prognosis in patients with stage IA lung adenocarcinoma with a micropapillary component using a nomogram based on computed tomography radiomics and clinicopathologic factors: a retrospective analysis. Transl Lung Cancer Res. (2024) 13:2585–602. doi: 10.21037/tlcr-24-544”. It should be “Xi J, Yin J, Liang J, Zhan C, Jiang W, Lin Z, et al. Prognostic Impact of Radiological Consolidation Tumor Ratio in Clinical Stage IA Pulmonary Ground Glass Opacities. Front Oncol. (2021)12;11:616149. doi: 10.3389/fonc.2021.616149”.
A correction has been made to Materials and methods, PFS analysis. This sentence previously stated:
“According to the cutoff of the Rad_score, participants were categorized into a high-risk group and a low risk group by Xtile (38).”
The corrected sentence appears below:
“According to the cutoff of the Rad_score, participants were categorized into high-risk and low-risk groups using the surv_cutpoint function in R survminer package (38).”
A correction has been made to Materials and methods, Statistical analysis. This sentence previously stated:
“Statistical analysis was carried out using several software, such as SPSS 25.0, R software (version 4.1.0; https://www.r-project.org), R software (version 3.3.4; https://www.r-project.org, the “carnet” and “ggplot” packages) and Python software (version 3.7.0; http://www.python.org; scikitplot, sklearn, matplotlib.pyplot, lightgbm, xgboost, sklearn.neighbors, sklearn.svm, numpy, and shap packages).”
The corrected sentence appears below:
“Statistical analysis was carried out using several software, such as SPSS 25.0, R software (version 4.1.0; https://www.r-project.org, the “carnet”,”survminer” and “ggplot” packages) and Python software (version 3.7.0; http://www.python.org; scikitplot, sklearn, matplotlib.pyplot, lightgbm, xgboost, sklearn.neighbors, sklearn.svm and numpy packages).”
A correction has been made to Results, PFS analysis. This sentence previously stated:
“The rad_score threshold (0.20) was computed with Xtile for dividing patients into high- and low-risk groups (Figure 7A)”
The corrected sentence appears below:
“The Rad_score threshold (0.20) was computed using surv_cutpoint function in R survminer package for dividing patients into high- and low-risk groups (Figure 7A)”
The original version of this article has been updated.