Liver fibrosis indices predict malignant cerebral edema after endovascular therapy for anterior circulation large vessel occlusion stroke: a retrospective cohort study
Weiwei Gao, Yanan Zhao, Jingjing She, Ziwei Wu, Lijuan Cai, Jianzhong Lin, Xingyu Chen, Renjing Zhu

TL;DR
This study found that liver fibrosis indices can predict the risk of malignant cerebral edema after stroke treatment, offering a new way to identify high-risk patients.
Contribution
The study introduces liver fibrosis indices as novel biomarkers for predicting malignant cerebral edema after endovascular therapy for stroke.
Findings
Elevated FIB-4, modified FIB-4, ARR, and AARPRI indices were independently associated with increased MCE risk.
FIB-5 index showed a negative association with MCE risk.
Liver fibrosis indices demonstrated moderate predictive performance with AUC values between 0.65 and 0.68.
Abstract
To investigate the association between liver fibrosis indices and malignant cerebral edema (MCE) following endovascular therapy (EVT) for anterior circulation large vessel occlusion (LVO) stroke. This single-center, retrospective cohort study consecutively enrolled 340 anterior circulation LVO stroke patients who underwent EVT between January 2018 and December 2024. The primary outcome was MCE, defined as a midline shift >5 mm at the level of the septum pellucidum or pineal gland, accompanied by the disappearance of the perimesencephalic cistern or the need for decompressive craniectomy. Multivariable logistic regression models were used to assess the independent associations of eight liver fibrosis indices with MCE, and restricted cubic spline regression analysis (RCS) was employed to explore their nonlinear relationships. The predictive performance was evaluated using receiver…
Genes, proteins, chemicals, diseases, species, mutations and cell lines named across the full text — each resolved to its canonical identifier and authoritative record.
Click any figure to enlarge with its caption.
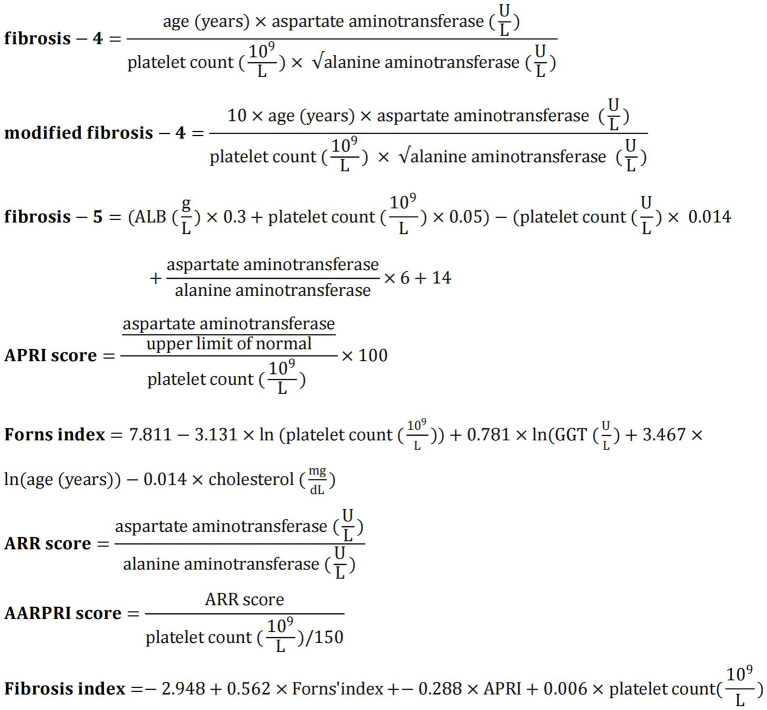 Figure 1
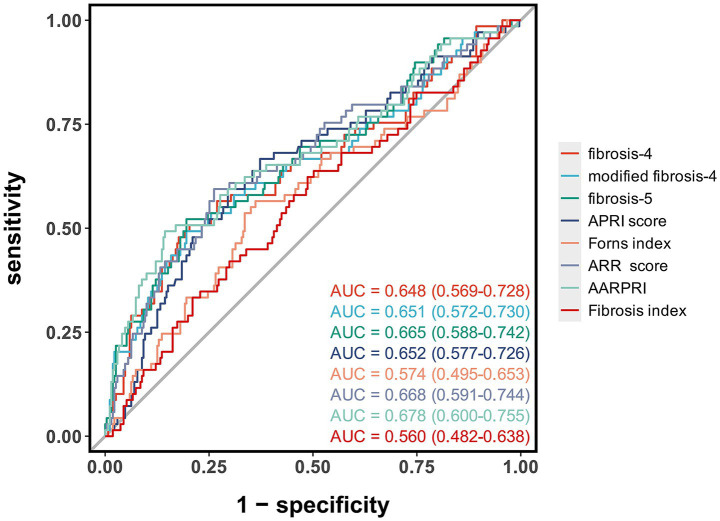 Figure 2
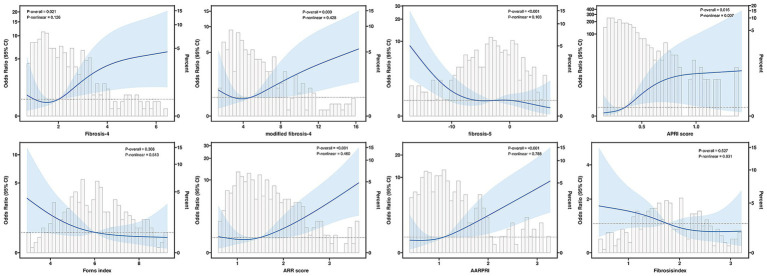 Figure 3
| Variables | Overall ( | Non-MCE ( | MCE ( | |
|---|---|---|---|---|
| Demographics | ||||
| Age, years, median (IQR) | 67 (57, 76) | 66 (57, 76) | 69 (56, 76) | 0.788 |
| Male sex, | 225 (66.18) | 180 (66.42) | 45 (65.22) | 0.850 |
| Current smoker, | 130 (38.24) | 114 (42.07) | 16 (23.19) | 0.004* |
| Alcohol consumption, | 88 (25.88) | 68 (25.09) | 20 (28.99) | 0.510 |
| Medical history | ||||
| Hypertension, | 226 (66.47) | 181 (66.79) | 45 (65.22) | 0.805 |
| Diabetes mellitus, | 97 (28.53) | 74 (27.31) | 23 (33.33) | 0.322 |
| Hyperlipidemia, | 79 (23.24) | 65 (23.99) | 14 (20.29) | 0.516 |
| Atrial fibrillation, | 148 (43.53) | 110 (40.59) | 38 (55.07) | 0.030* |
| Previous stroke/TIA, | 54 (15.88) | 48 (17.71) | 6 (8.70) | 0.067 |
| Coronary artery disease, | 44 (12.94) | 30 (11.07) | 14 (20.29) | 0.042* |
| Clinical presentation | ||||
| SBP, mmHg, median (IQR) | 148 (132, 163) | 149 (133, 163) | 144 (131, 162) | 0.427 |
| DPB, mmHg, median (IQR) | 87 (77, 97) | 87 (76, 98) | 87 (77, 93) | 0.650 |
| Baseline NIHSS score, median (IQR) | 15 (12, 19) | 14 (11, 18) | 17 (15, 21) | <0.001* |
| Baseline GCS score, median (IQR) | 12 (10, 14) | 13 (10, 15) | 11 (9, 13) | <0.001* |
| Baseline ASPECT score, median (IQR) | 9 (8, 10) | 9 (8, 10) | 8 (6, 10) | 0.031* |
| Stroke etiology, | 0.071 | |||
| Large-artery atherosclerosis | 162 (47.65) | 134 (49.45) | 28 (40.58) | |
| Cardioembolism | 160 (47.06) | 120 (44.28) | 40 (57.97) | |
| Other | 18 (5.29) | 17 (6.27) | 1 (1.45) | |
| Procedural characteristics | ||||
| Intravenous thrombolysis, | 146 (42.94) | 116 (42.80) | 30 (43.48) | 0.920 |
| OPT, min, median (IQR) | 373 (266, 555) | 370 (260, 560) | 389 (305, 521) | 0.454 |
| PRT, min, median (IQR) | 76 (48, 99) | 75 (45, 97) | 82 (60, 120) | 0.015* |
| ORT, min, median (IQR) | 460 (338, 655) | 457 (322, 660) | 463 (373, 630) | 0.430 |
| NOTA, median (IQR) | 2.00 (1.00, 2.00) | 2.00 (1.00, 2.00) | 2.00 (1.00, 3.00) | <0.001* |
| Successful reperfusion, n (%) | 292 (85.88) | 238 (87.82) | 54 (78.26) | 0.042* |
| Treatment strategy, | 0.698 | |||
| Stent retriever | 72 (21.18) | 54 (19.93) | 18 (26.09) | |
| Aspiration | 21 (6.18) | 18 (6.64) | 3 (4.35) | |
| Combined approach | 227 (66.76) | 183 (67.53) | 44 (63.77) | |
| Balloon angioplasty, | 62 (18.24) | 51 (18.82) | 11 (15.94) | 0.581 |
| Variables | Overall ( | Non-MCE ( | MCE ( | |
|---|---|---|---|---|
| Total protein, g/L, median (IQR) | 65 (62, 70) | 65 (62, 69) | 64 (60, 70) | 0.105 |
| Albumin, g/L, median (IQR) | 37.2 (34.6, 39.6) | 37.2 (35.0, 39.5) | 37.3 (33.4, 39.7) | 0.590 |
| Total bilirubin, μmol/L, median (IQR) | 16 (13, 21) | 16 (12, 20) | 17 (13, 23) | 0.113 |
| ALT, U/L, median (IQR) | 16 (12, 24) | 17 (12, 24) | 15 (11, 21) | 0.133 |
| AST, U/L, median (IQR) | 24 (19, 31) | 24 (19, 30) | 27 (22, 38) | 0.003* |
| GGT, U/L, median (IQR) | 28 (19, 46) | 29 (20, 45) | 26 (19, 50) | 0.589 |
| ALP, U/L, median (IQR) | 77 (65, 93) | 78 (66, 95) | 74 (62, 87) | 0.115 |
| Triglycerides, mmol/L, median (IQR) | 1.06 (0.78, 1.43) | 1.08 (0.81, 1.42) | 0.99 (0.70, 1.46) | 0.137 |
| Total cholesterol, mmol/L, median (IQR) | 4.34 (3.59, 5.09) | 4.35 (3.64, 5.10) | 4.30 (3.12, 5.01) | 0.181 |
| HDL-C, mmol/L, median (IQR) | 1.17 (1.00, 1.34) | 1.18 (1.01, 1.34) | 1.12 (0.97, 1.34) | 0.169 |
| LDL-C, mmol/L, median (IQR) | 2.85 (2.23, 3.41) | 2.86 (2.30, 3.44) | 2.83 (1.85, 3.22) | 0.173 |
| FBG, mmol/L, median (IQR) | 7.5 (6.2, 9.7) | 7.2 (6.0, 9.2) | 8.8 (7.5, 12.0) | <0.001* |
| BUN, mmol/L, median (IQR) | 5.46 (4.10, 7.20) | 5.40 (4.05, 6.95) | 5.80 (4.30, 8.80) | 0.050* |
| Creatinine, μmol/L, median (IQR) | 72 (59, 87) | 72 (58, 85) | 74 (60, 117) | 0.052 |
| Uric acid, μmol/L, median (IQR) | 329 (270, 415) | 324 (266, 406) | 367 (285, 460) | 0.030* |
| Platelet count, ×109/L, median (IQR) | 202 (168, 238) | 207 (176, 243) | 180 (150, 210) | 0.001 |
| FIB-4, median (IQR) | 2.00 (1.34, 3.01) | 1.86 (1.32, 2.75) | 2.97 (1.48, 4.39) | <0.001 |
| Modified FIB-4, median (IQR) | 4.8 (3.0, 7.4) | 4.5 (2.9, 6.7) | 7.0 (3.7, 10.8) | <0.001 |
| FIB-5, median (IQR) | -3 (−7, 1) | -2 (−6, 1) | -7 (−12, −1) | <0.001 |
| APRI score, median (IQR) | 0.34 (0.24, 0.48) | 0.33 (0.23, 0.44) | 0.46 (0.29, 0.69) | <0.001 |
| Forns index, mean (SD) | 6.00 ± 1.67 | 5.91 ± 1.66 | 6.35 ± 1.67 | 0.059 |
| ARR score, median (IQR) | 1.48 (1.08, 2.04) | 1.39 (1.06, 1.85) | 1.92 (1.35, 2.52) | <0.001 |
| AARPRI, median (IQR) | 1.10 (0.77, 1.55) | 1.06 (0.74, 1.43) | 1.61 (0.94, 2.52) | <0.001 |
| Fibrosis index, mean (SD) | 1.80 ± 0.76 | 1.77 ± 0.76 | 1.92 ± 0.75 | 0.133 |
| Parameter | AUC (95% CI) | Accuracy (95% CI) | Sensitivity (95% CI) | Specificity (95% CI) | Cut-off value |
|---|---|---|---|---|---|
| fibrosis-4 | 0.65 (0.57–0.73) | 0.74 (0.69–0.78) | 0.80 (0.75–0.84) | 0.51 (0.39–0.63) | 2.97 |
| modified fibrosis-4 | 0.65 (0.57–0.73) | 0.74 (0.69–0.79) | 0.80 (0.76–0.85) | 0.49 (0.37–0.61) | 7.35 |
| fibrosis-5 | 0.67 (0.59–0.74) | 0.25 (0.21–0.30) | 0.20 (0.15–0.24) | 0.48 (0.36–0.60) | −6.67 |
| APRI score | 0.65 (0.58–0.73) | 0.68 (0.62–0.73) | 0.70 (0.64–0.75) | 0.59 (0.48–0.71) | 0.41 |
| Forns index | 0.57 (0.49–0.65) | 0.62 (0.57–0.68) | 0.64 (0.58–0.70) | 0.57 (0.45–0.68) | 6.26 |
| ARR score | 0.67 (0.59–0.74) | 0.71 (0.66–0.76) | 0.74 (0.69–0.79) | 0.59 (0.48–0.71) | 1.81 |
| AARPRI | 0.68 (0.60–0.76) | 0.78 (0.73–0.83) | 0.86 (0.81–0.90) | 0.49 (0.37–0.61) | 1.73 |
| Fibrosis index | 0.56 (0.48–0.64) | 0.54 (0.48–0.59) | 0.51 (0.45–0.57) | 0.62 (0.51–0.74) | 1.74 |
| Variables | Model 1 | Model 2 | Model 3 | |||
|---|---|---|---|---|---|---|
| OR (95% CI) | OR (95% CI) | p value | OR (95% CI) | |||
| FIB-4 | 1.30 (1.13–1.51) | <0.001 | 1.32 (1.12–1.55) | <0.001 | 1.41 (1.09–1.82) | 0.009 |
| Modified FIB-4 | 1.12 (1.06–1.19) | <0.001 | 1.13 (1.06–1.21) | <0.001 | 1.14 (1.05–1.23) | 0.001 |
| FIB-5 | 0.90 (0.86–0.94) | <0.001 | 0.89 (0.85–0.94) | <0.001 | 0.89 (0.83–0.94) | <0.001 |
| APRI score | 1.64 (0.93–2.89) | 0.086 | 1.78 (0.95–3.34) | 0.072 | 6.58 (0.46–94.19) | 0.165 |
| Forns index | 1.17 (1.00–1.38) | 0.056 | 1.07 (0.87–1.31) | 0.536 | 0.80 (0.59–1.09) | 0.163 |
| ARR score | 2.09 (1.52–2.87) | <0.001 | 2.36 (1.63–3.43) | <0.001 | 2.35 (1.57–3.52) | <0.001 |
| AARPRI | 2.13 (1.57–2.89) | <0.001 | 2.31 (1.63–3.26) | <0.001 | 2.63 (1.69–4.10) | <0.001 |
| Fibrosis index | 1.31 (0.92–1.86) | 0.134 | 1.03 (0.66–1.63) | 0.884 | 0.70 (0.40–1.20) | 0.192 |
Peer Reviews
No public reviews on file for this paper yet. If you reviewed it on a platform where reviews are public (OpenReview, ICLR, NeurIPS, ICML), you can paste yours below so the community can read it here.
Videos
No videos yet. Explain this paper in a talk, walkthrough, or lecture? Add one.
Taxonomy
TopicsAcute Ischemic Stroke Management · Neurological Disease Mechanisms and Treatments · Intracerebral and Subarachnoid Hemorrhage Research
Introduction
1
Stroke is a leading cause of mortality and disability worldwide, with acute ischemic stroke (AIS) accounting for approximately 62.4% of all cases (1, 2). Large vessel occlusion (LVO) is a distinct subtype of AIS, with an incidence ranging from 28 to 46% (3). Patients with LVO have attracted significant clinical attention due to their rapid disease progression, severe neurological deficits, and poor prognosis (4). Endovascular therapy (EVT) has significantly improved the functional outcomes of LVO patients by achieving rapid vessel recanalization and salvaging the ischemic penumbra, becoming the standard treatment strategy in the hyperacute phase (5). However, in real-world settings, a considerable proportion of patients still experience unfavorable outcomes despite successful recanalization of the occluded vessel. Among these complications, malignant cerebral edema (MCE) is one of the most severe. A recent secondary analysis of a multicenter randomized trial showed that approximately 40% of patients developed post-procedural midline shift caused by cerebral edema after EVT (6). Alarmingly, another latest study involving 33 stroke centers found that MCE accounted for 50.6% of deaths within 30 days after EVT (7). Although early decompressive craniectomy can significantly reduce mortality and disability in MCE patients (8), early prediction and prevention of this lethal complication remain critical issues to be addressed.
Non-alcoholic fatty liver disease (NAFLD) is the most common chronic liver disease globally, with a prevalence of 30.1% (9). Among NAFLD patients, liver fibrosis is considered a key stage. Recent evidence has highlighted the potential role of liver fibrosis in the pathophysiology of stroke, possibly affecting stroke outcomes through multiple mechanisms such as endothelial dysfunction, systemic inflammation, and oxidative stress (10–13). Previous studies have demonstrated that liver fibrosis is associated with more severe neurological deficits, increased in-hospital mortality, poor long-term functional outcomes, and an elevated risk of recurrent stroke in AIS patients (14–17). Furthermore, an elevated fibrosis-4 (FIB-4) index has been identified as an independent predictor of hemorrhagic transformation and symptomatic intracerebral hemorrhage after intravenous thrombolysis and EVT (18–21). However, the relationship between liver fibrosis and MCE following EVT has not yet been explored. Moreover, existing studies have primarily relied on a single fibrosis index, which may limit the accurate assessment of liver fibrosis severity.
To address this knowledge gap, we evaluated the associations of eight non-invasive liver fibrosis indices with MCE in anterior circulation LVO stroke patients undergoing EVT. This study aimed to establish the potential value of liver fibrosis markers in risk stratification for MCE after EVT and provide a scientific basis for developing targeted prevention strategies.
Manuscript formatting
2
Study design and population
2.1
This study was a single-center, retrospective cohort study based on a prospectively maintained electronic medical record database. The study protocol was approved by the medical ethics committee, and the requirement for informed consent was waived due to the retrospective nature of the study. We established an inception cohort comprising all consecutive anterior circulation LVO-AIS patients who underwent EVT at our comprehensive stroke center between January 1, 2018, and December 31, 2024. The inception point was defined as the time of hospital admission for acute stroke, with patients followed until hospital discharge, death, or development of MCE, whichever occurred first. All enrolled patients had anterior circulation LVO confirmed by preoperative computed tomography angiography, magnetic resonance angiography, or digital subtraction angiography (DSA), including the terminal internal carotid artery or the M1/M2 segment of the middle cerebral artery.
The exclusion criteria were as follows: (1) age < 18 years; (2) presence of intracranial hemorrhage on baseline head computed tomography (CT) or magnetic resonance imaging; (3) pre-stroke modified Rankin Scale score > 2; (4) history of severe liver diseases (including viral hepatitis, cirrhosis, or primary liver cancer) or current use of potentially hepatotoxic drugs; (5) severe renal insufficiency; and (6) incomplete clinical laboratory or imaging data. Considering the characteristics of real-world studies, we did not exclude patients with a history of chronic alcohol consumption (21).
Data collection and clinical assessment
2.2
Two trained researchers independently extracted data using a standardized electronic spreadsheet, and any discrepancies were resolved through discussion with a senior researcher. Baseline characteristics included demographic characteristics (age and sex), cerebrovascular risk factors (Current smoker, alcohol consumption, hypertension, diabetes, hyperlipidemia, atrial fibrillation, previous stroke or transient ischemic attack, and coronary heart disease), and vital signs at admission (systolic and diastolic blood pressure).
Procedural characteristics
2.3
Procedural parameters were recorded in real-time by the operators, including intravenous thrombolysis status, key time points (onset-to-puncture time, onset-to-reperfusion time, and puncture-to-reperfusion time), and procedural details (number of mechanical thrombectomy attempts, device strategy [stent retriever, aspiration catheter, or combined use], and balloon angioplasty). The modified Thrombolysis in Cerebral Infarction (mTICI) grading system was used to assess the reperfusion status, which was determined based on the final DSA results. Successful reperfusion was defined as mTICI grades 2b − 3.
Laboratory analysis and liver fibrosis indices
2.4
All patients had fasting venous blood samples collected within 24 h of admission, which were analyzed by the hospital’s central laboratory using standardized procedures. The laboratory tests included total protein, albumin, total bilirubin, aspartate aminotransferase (AST), alanine aminotransferase, γ-glutamyl transferase, alkaline phosphatase, lipid profile (total cholesterol, triglycerides, high-density lipoprotein cholesterol, low-density lipoprotein cholesterol), fasting blood glucose (FBG), blood urea nitrogen (BUN), creatinine, uric acid (UA), and platelet count (PLT).
Eight validated non-invasive liver fibrosis indices were calculated (19): FIB-4 index, modified FIB-4 index (mFIB-4), fibrosis-5 index (FIB-5), AST to platelet ratio index (APRI), Forns index, AST/ALT ratio (ARR), AST/ALT-PLT ratio index (AARPRI), and liver fibrosis index (LFI). The specific calculation formulas are shown in Figure 1.
Calculation formulas for eight non-invasive liver fibrosis indices. APRI, aspartate aminotransferase to platelet ratio index; GGT, γ-glutamyl transferase; ARR, aspartate aminotransferase/alanine aminotransferase ratio; AARPRI, AAR-platelet count ratio index.
Outcome measures
2.5
The primary outcome of this study was MCE, defined as a midline shift exceeding 5 mm at the level of the septum pellucidum or pineal gland, accompanied by the disappearance of the perimesencephalic cistern or the need for decompressive craniectomy (22–24). To systematically monitor the occurrence and progression of cerebral edema, all patients underwent head CT examinations according to a standardized protocol, including immediately after endovascular treatment, at 24 h, and at 72 h. Additional CT scans were performed immediately upon neurological deterioration or signs of edema progression on previous imaging. For patients diagnosed with MCE, imaging assessments were conducted every 12–24 h to closely monitor the progression of cerebral edema.
To ensure the objectivity and accuracy of the assessments, all imaging evaluations were performed using a double-blind method by two senior neuroradiologists and one attending neurologist independently. The assessors were blinded to all clinical data of the patients, and any discrepancies were resolved through discussion by an expert panel.
Statistical analysis
2.6
All statistical analyses were performed using R software (Version 4.2.2). The Shapiro–Wilk test was used to assess the normality of continuous variables. Normally distributed continuous variables were expressed as mean ± standard deviation and compared between groups using independent samples t-tests. Non-normally distributed continuous variables were expressed as median [interquartile range (IQR)] and compared using the Mann–Whitney U test. Categorical variables were expressed as numbers (percentages) and compared using the chi-square test or Fisher’s exact test.
To evaluate the predictive value of liver fibrosis indices for MCE, we constructed receiver operating characteristic (ROC) curves and calculated the area under the curve (AUC) and its 95% confidence interval. The Youden index method was used to determine the optimal diagnostic cut-off values, and the corresponding sensitivity and specificity were calculated. Based on the variables that were statistically significant (p < 0.05) in the univariate analysis, three stepwise-adjusted multivariable logistic regression models were constructed to explore the associations between liver fibrosis indices and the outcome. Model 1 was the unadjusted baseline model; Model 2 adjusted for clinical factors (smoking status, atrial fibrillation, coronary heart disease, baseline NIHSS score, GCS score, ASPECTS score, puncture-to-reperfusion time, number of mechanical thrombectomy attempts, and successful reperfusion status); Model 3 further adjusted for laboratory parameters (aspartate aminotransferase, fasting blood glucose, blood urea nitrogen, uric acid, and platelet count).
Restricted cubic spline (RCS) regression models were used to assess potential nonlinear associations, with knots set at the 5th, 35th, 65th, and 95th percentiles, and the overall association and nonlinear component were tested separately. To evaluate the robustness of the study results, we performed sensitivity analyses, including bootstrap validation (1,000 repetitions) and stratified analyses based on key baseline characteristics. All statistical tests were two-sided, and p < 0.05 was considered statistically significant.
Results
3
Patient characteristics
3.1
A total of 340 anterior circulation LVO-AIS patients were enrolled in this study (Table 1), of whom 69 (20.3%) developed MCE. The median age of all patients was 67 years (IQR: 57–76 years), and 225 (66.18%) were male. Compared to the non-MCE group, patients in the MCE group had a lower proportion of smokers (23.19% vs. 42.07%, p = 0.004) but exhibited a higher incidence of atrial fibrillation (55.07% vs. 40.59%, p = 0.030) and coronary heart disease (20.29% vs. 11.07%, p = 0.042). Patients in the MCE group had more severe neurological deficits at admission, as evidenced by a higher median NIHSS score (17 vs. 14, p < 0.001) and a lower median GCS score (11 vs. 13, p < 0.001). Additionally, the baseline ASPECTS score was significantly lower in the MCE group (8 vs. 9, p = 0.031). Regarding procedural characteristics, the MCE group demonstrated a longer puncture-to-reperfusion time (median 82 min vs. 75 min, p = 0.015) and more mechanical thrombectomy attempts [2 (1–3) vs. 2 (1, 2), p < 0.001]. Notably, the successful reperfusion rate was significantly lower in the MCE group than in the non-MCE group (78.26% vs. 87.82%, p = 0.042).
Laboratory characteristics of patients
3.2
Laboratory tests revealed significant differences between the MCE and non-MCE groups (Table 2). The MCE group exhibited significantly elevated levels of AST (p = 0.003), FBG (p < 0.001), urea (p = 0.050), and UA (p = 0.030). In contrast, the PLT count was significantly lower in the MCE group (p = 0.001). The assessment of liver fibrosis indices showed that the MCE group had significantly higher FIB-4 (p < 0.001), mFIB-4 (p < 0.001), APRI (p < 0.001), ARR (p < 0.001), and AARPRI (p < 0.001) scores. Conversely, the FIB-5 index was significantly lower in the MCE group (p < 0.001). The differences in the Forns index and LFI between the two groups did not reach statistical significance.
Predictive value of liver fibrosis indices
3.3
ROC curve analysis showed that AARPRI had the highest predictive value for MCE after EVT (AUC = 0.68, 95% CI: 0.60–0.76), outperforming other liver fibrosis indices (Figure 2; Table 3). When the optimal cut-off value for AARPRI was set at 1.73, the diagnostic accuracy of AARPRI was 0.78 (95% CI: 0.73–0.83), with high sensitivity (0.86, 95% CI: 0.81–0.90) but moderate specificity (0.49, 95% CI: 0.37–0.61). The ARR and FIB-5 indices demonstrated comparable discriminatory performance (AUC = 0.67, 95% CI: 0.59–0.75). The AUCs for FIB-4, mFIB-4, and APRI were all 0.65, with FIB-4 exhibiting significant sensitivity (0.80, 95% CI: 0.75–0.84) and accuracy (0.74, 95% CI: 0.69–0.78) at a cut-off value of 2.97.
Receiver operating characteristic curves of liver fibrosis indices for predicting malignant cerebral edema after endovascular therapy. The area under the curve (AUC) values with 95% confidence intervals are shown for each liver fibrosis index.
Multivariable analysis
3.4
In the multivariable logistic regression models (Table 4), several liver fibrosis indices showed independent associations with the risk of MCE. In the unadjusted baseline model (Model 1), FIB-4, mFIB-4, FIB-5, ARR, and AARPRI were significantly associated with the risk of MCE. After further adjusting for clinical factors (Model 2), these associations remained significant. In the fully adjusted model (Model 3), each unit increase in AARPRI, ARR, FIB-4, and mFIB-4 was associated with a 163% (OR = 2.63, 95% CI: 1.69–4.10, p < 0.001), 135% (OR = 2.35, 95% CI: 1.57–3.52, p < 0.001), 41% (OR = 1.41, 95% CI: 1.09–1.82, p = 0.009), and 14% (OR = 1.14, 95% CI: 1.05–1.23, p = 0.001) increased risk of MCE, respectively. Notably, the FIB-5 index was negatively associated with the risk of MCE [OR = 0.89, 95% CI: 0.83–0.94, p < 0.001]. In contrast, the APRI, Forns index, and LFI did not show statistical significance in the fully adjusted model (all p > 0.05).
Nonlinear association analysis
3.5
RCS analysis (Figure 3) showed that FIB-4 (P-nonlinear = 0.126), mFIB-4 (P-nonlinear = 0.428), APRI (P-nonlinear = 0.007), ARR (P-nonlinear = 0.460), and AARPRI (P-nonlinear = 0.786) exhibited an overall increasing dose–response relationship with the risk of MCE (both P-overall<0.05). In contrast, the FIB-5 index demonstrated a significant nonlinear negative association with the risk of MCE (P-overall<0.001, P-nonlinear = 0.103). The associations of the Forns index and LFI with the risk of MCE did not reach statistical significance (P-overall = 0.308 and 0.527, respectively) and showed no evident nonlinear trends (P-nonlinear = 0.513; P-nonlinear = 0.831).
Restricted cubic spline regression analysis of the associations between liver fibrosis indices and the risk of malignant cerebral edema after endovascular therapy. The solid lines represent the odds ratios, and the shaded areas represent the 95% confidence intervals. The P-overall and P-nonlinear values are shown for each liver fibrosis index.
Discussion
4
In this retrospective cohort study, we systematically evaluated the associations between eight non-invasive liver fibrosis indices and the risk of MCE in LVO-AIS patients undergoing EVT for the first time. Multivariable analysis demonstrated that, after adjusting for multiple confounding factors, several liver fibrosis indices (FIB-4, mFIB-4, FIB-5, ARR score, and AARPRI score) remained independently associated with the risk of MCE following EVT. RCS analysis revealed an overall increasing dose–response relationship between these indices and the risk of MCE. The predictive values of these liver fibrosis indices were similar, but AARPRI slightly outperformed the other indices. Beyond liver fibrosis indices, univariate analysis identified several additional significant associations with MCE risk. Concurrent atrial fibrillation, history of coronary heart disease, higher baseline NIHSS scores, lower GCS scores, reduced ASPECTS scores, and increased number of mechanical thrombectomy attempts were significantly associated with elevated MCE risk. Conversely, successful vessel recanalization and smoking history demonstrated protective effects. These results corroborate findings from previous studies and provide additional validation of established risk factors.
A growing body of evidence suggests that liver fibrosis is closely related to the development of AIS. Previous studies have demonstrated that the degree of liver fibrosis, based on non-invasive assessments, is associated with more severe neurological deficits at admission, higher in-hospital mortality, poorer long-term functional recovery, and an increased risk of recurrent stroke in AIS patients (14–17). Additionally, research has found that liver fibrosis indices are equally valuable in predicting complications related to acute reperfusion therapy for stroke. For example, the FIB-4 index has been shown to be an independent risk factor for hemorrhagic transformation and symptomatic intracerebral hemorrhage after intravenous thrombolysis (18, 19). Currently, studies on the relationship between liver fibrosis and the prognosis of LVO-AIS patients remain limited. Höfler et al. (21) were the first to reveal that elevated FIB-4 levels were significantly associated with unfavorable functional outcomes (mRS ≥ 3, OR = 2.15, 95% CI: 1.21–3.83, p = 0.009) and mortality risk (OR = 2.16, 95% CI: 1.16–4.03, p = 0.01) at 3 months after EVT in LVO patients. Subsequently, Xu et al. (20) further confirmed that elevated FIB-4 levels were an independent risk factor for sICH after EVT (OR = 1.306, 95% CI: 1.127–1.512, p = 0.001). However, prior to this study, no research had explored the relationship between liver fibrosis and MCE, a critical complication. Our study not only fills this gap but also provides a more comprehensive assessment strategy for clinical risk stratification by evaluating and comparing the predictive values of multiple liver fibrosis indices.
The pathophysiological process of MCE involves two interrelated mechanisms: cytotoxic edema and vasogenic edema (25). In the early stage of ischemic injury, energy metabolism disorders lead to the inhibition of sodium-potassium ATPase (Na^+^-K^+^-ATPase) function, causing continuous accumulation of intracellular Na^+^ in neurons and glial cells. This process disrupts the ionic balance between the intracellular and extracellular compartments, triggering cell depolarization and osmotic changes, ultimately resulting in cytotoxic cellular edema. Simultaneously, ischemic stimuli induce the upregulation of various mediators (such as thrombin, vascular endothelial growth factor, and nitric oxide synthase), which synergistically disrupt the integrity of the blood–brain barrier (26). Within 1–5 days after stroke onset, persistent blood–brain barrier dysfunction leads to plasma protein extravasation and increased interstitial osmotic pressure, exacerbating interstitial edema. Due to the anatomical characteristics of fixed intracranial volume, these pathological changes cause an increase in intracranial pressure, leading to reduced cerebral blood flow and impaired cerebral autoregulation, forming a vicious cycle that may ultimately progress to fatal brain herniation.
The increased risk of MCE after EVT in patients with liver fibrosis may involve multiple mechanisms. First, liver fibrosis can promote the occurrence of MCE by exacerbating endothelial dysfunction. Studies have found that hepatocytes in NAFLD patients can release specific circulating extracellular vesicles, which can activate vascular endothelial inflammatory responses through signaling pathways such as miRNA-novel−7 and microRNA-1. This not only promotes atherosclerotic plaque instability but also increases microvascular permeability (10, 27–29). This endothelial dysfunction may lead to impaired cerebral microvascular barrier function, creating conditions for the development of MCE.
Second, liver fibrosis may promote the progression of MCE by aggravating inflammatory responses. Du Plessis et al.’s study showed that the histological severity of NAFLD was significantly positively correlated with inflammatory mediator levels (11). Particularly in patients with non-alcoholic steatohepatitis, serum matrix metalloproteinase-9 (MMP-9) levels were significantly higher than those in the control group (12.6 ± 6.5 vs. 8.1 ± 3.5 μg/L, p < 0.01) (12). Evidence suggests that serum MMP-9 levels exceeding 140 μg/L can predict an increased risk of cerebral edema and poor prognosis in AIS patients (30). Moreover, in acute ischemic events, patients with liver fibrosis exhibit enhanced peripheral immune cell mobilization and tissue infiltration, which may further damage the integrity of the blood–brain barrier by amplifying the inflammatory cascade (31). Third, oxidative stress, as a common pathological basis for liver fibrosis and cardiovascular diseases, may play a key role in the occurrence of MCE. Studies have shown that oxidative stress can directly damage the structural integrity of the blood–brain barrier by degrading extracellular matrix components and disrupting tight junction proteins (13). This mechanism may explain the increased susceptibility to ischemic injury in patients with liver fibrosis.
Furthermore, the univariate findings described above corroborate previous research results. In patients with atrial fibrillation, emboli tend to cause proximal large vessel occlusion, leading to large infarcts and a higher risk of hemorrhagic transformation, thereby increasing the risk of cerebral edema formation (32, 33). The impact of coronary heart disease may be mediated through heart failure and neuroendocrine disorders. Research shows that approximately 25% of patients with ST-segment elevation myocardial infarction progress to heart failure (34), which is closely related to fatal cerebral edema (35). It is particularly noteworthy that some patients with coronary heart disease still have significantly elevated N-terminal pro-brain natriuretic peptide (NT-proBNP) levels 1 year after onset (36), and NT-proBNP has been proven to be an independent predictor of MCE after EVT (37). NT-proBNP may exacerbate cerebral edema by increasing microvascular permeability through its active product BNP, promoting albumin extravasation, and inhibiting interstitial fluid reabsorption (38). Previous studies have found that neurological function and imaging findings at admission have significant predictive value. A meta-analysis showed that the NIHSS score within 6 h of admission is a reliable predictor of MCE (39). Thomalla et al.’s study established an NIHSS score ≥18 as a predictive threshold with good predictive performance (40). Similarly, an ASPECTS score ≤7 not only suggests a larger core infarct volume but also predicts a higher risk of cerebral edema (41). Regarding the impact of vessel recanalization, multiple studies have consistently shown that successful recanalization is significantly associated with a reduced risk of MCE (42, 43). Kimberly et al.’s study found that recanalization can reduce the incidence of midline shift (6), a finding further confirmed in a subsequent systematic review that included 38 studies (26). This protective effect may be related to improving cerebral tissue perfusion in the ischemic penumbra and reducing edema-related brain injury. Interestingly, we observed that smoking history was associated with a reduced risk of MCE. Although the protective mechanism has not been fully elucidated, evidence suggests that nicotine may exert neuroprotective effects by activating the endogenous cannabinoid system (44). Nicotine promotes the release of endogenous cannabinoids and induces mild hypothermia, thereby inhibiting inflammatory responses and alleviating cerebral edema (45).
Although the AUC values for liver fibrosis indices in our study were below 0.70, indicating moderate predictive performance, these findings hold significant clinical value and research implications. First, malignant cerebral edema represents a complex, multifactorial pathophysiological process where single biomarkers rarely achieve perfect predictive performance. Second, liver fibrosis indices serve as novel predictive factors that provide valuable complementary information to existing prediction models. In the era of precision medicine driven by multimodal medical data, integrating multiple biomarkers to construct comprehensive prediction models has become standard practice. Liver fibrosis indices can be combined with established clinical scoring systems (such as NIHSS and ASPECTS scores) and other biomarkers to enhance overall predictive efficacy. Notably, significant associations between liver fibrosis indices and MCE risk were observed despite normal AST, ALT, and platelet values in both groups. This finding enhances the clinical relevance of our results by demonstrating that composite fibrosis indices can detect subclinical hepatic dysfunction before individual parameters become abnormal.
Stroke patients with elevated liver fibrosis indices may benefit from multilevel therapeutic strategies. Etiology-directed treatments include antiviral therapy for chronic viral hepatitis to effectively suppress viral replication, relief of cholestasis or treatment of underlying causes, weight management and metabolic disorder correction for non-alcoholic fatty liver disease patients, and strict alcohol cessation for alcoholic liver disease patients. These measures can reduce ongoing hepatic injury and promote fibrotic tissue repair. Lifestyle interventions include dietary modifications, regular exercise, and metabolic syndrome control. Integrating liver fibrosis management into comprehensive stroke care has multiple implications: first, improving hepatic health may reduce malignant cerebral edema risk through mechanisms including reduced systemic inflammation and improved endothelial function; second, this comprehensive management strategy may decrease long-term all-cause mortality and prevent stroke recurrence; finally, dynamic monitoring of liver fibrosis indices provides clinicians with valuable information regarding disease progression and treatment response, guiding personalized therapeutic decision-making adjustments.
This study has several limitations that need to be addressed. As a single-center retrospective cohort study, the results may be subject to selection bias, and external validity needs to be verified. Although multiple validated non-invasive liver fibrosis indices were used, the lack of liver biopsy as the gold standard may affect the accuracy of liver fibrosis assessment. Additionally, all liver fibrosis indices investigated in this study involve complex mathematical calculations requiring multiple laboratory parameters, which may limit their practical implementation in daily clinical practice and potentially lead to calculation errors when performed manually. There is a need to develop user-friendly digital applications or automated calculation tools integrated with electronic health record systems to facilitate real-time risk assessment and improve clinical workflow efficiency. Furthermore, although this study confirmed the association between liver fibrosis and MCE after EVT, specific intervention strategies have not been elucidated. To address these limitations, future research should focus on the following aspects: First, conduct multicenter prospective cohort studies, integrate imaging examinations such as liver elastography, and establish a more accurate liver fibrosis assessment system; second, explore the molecular mechanisms by which liver fibrosis promotes the occurrence and development of MCE, and verify whether potential existing hepatoprotective drugs have neuroprotective effects; finally, conduct individualized treatment studies based on liver fibrosis stratification and develop standardized monitoring and intervention protocols. These studies will contribute to a better understanding of the role of liver fibrosis in stroke prognosis and provide new strategies for improving the efficacy of EVT treatment.
Conclusion
5
Non-invasive liver fibrosis indices serve as novel predictive biomarkers for malignant cerebral edema following endovascular therapy in anterior circulation large vessel occlusion stroke. Elevated FIB-4, modified FIB-4, AST/ALT ratio, and AARPRI were independently associated with increased risk of malignant cerebral edema, while FIB-5 showed a negative association. These readily available clinical tools may help identify high-risk patients and guide early preventive interventions, potentially improving clinical outcomes after endovascular therapy.
The reference list from the paper itself. Each links out to its DOI / PubMed record.
- 1Feigin VL Brainin M Norrving B Martins SO Pandian J Lindsay P. World stroke organization: global stroke fact sheet 2025. Int J Stroke. (2025) 20:132–44. doi: 10.1177/17474930241308142, PMID: 39635884 PMC 11786524 · doi ↗ · pubmed ↗
- 2GBD 2019 Stroke Collaborators. Global, regional, and national burden of stroke and its risk factors, 1990-2019: a systematic analysis for the global burden of disease study 2019. Lancet Neurol. (2021) 20:795–820. doi: 10.1016/S 1474-4422(21)00252-0, PMID: 34487721 PMC 8443449 · doi ↗ · pubmed ↗
- 3Smith WS Lev MH English JD Camargo EC Chou M Johnston SC. Significance of large vessel intracranial occlusion causing acute ischemic stroke and TIA. Stroke. (2009) 40:3834–40. doi: 10.1161/STROKEAHA.109.561787, PMID: 19834014 PMC 2796543 · doi ↗ · pubmed ↗
- 4Malhotra K Gornbein J Saver JL. Ischemic strokes due to large-vessel occlusions contribute disproportionately to stroke-related dependence and death: a review. Front Neurol. (2017) 8:651. doi: 10.3389/fneur.2017.00651, PMID: 29250029 PMC 5715197 · doi ↗ · pubmed ↗
- 5Dhillon PS Butt W Podlasek A Mc Conachie N Lenthall R Nair S. Perfusion imaging for endovascular Thrombectomy in acute ischemic stroke is associated with improved functional outcomes in the early and late time windows. Stroke. (2022) 53:2770–8. doi: 10.1161/STROKEAHA.121.038010, PMID: 35506384 PMC 9389941 · doi ↗ · pubmed ↗
- 6Kimberly WT Dutra BG Boers AMM Alves HCBR Berkhemer O Avan den Berg L. Association of Reperfusion with Brain Edema in patients with acute ischemic stroke: a secondary analysis of the MR CLEAN trial. JAMA Neurol. (2018) 75:453–61. doi: 10.1001/jamaneurol.2017.5162, PMID: 29365017 PMC 5885187 · doi ↗ · pubmed ↗
- 7Wang J Liu Q Hu F Zheng H Jiang X Chen L. Characteristics of mortality after endovascular Thrombectomy in patients with acute ischemic stroke. Clin Interv Aging. (2024) 19:2145–55. doi: 10.2147/CIA.S 496733, PMID: 39712632 PMC 11662908 · doi ↗ · pubmed ↗
- 8Beez T Munoz-Bendix C Steiger HJ Beseoglu K. Decompressive craniectomy for acute ischemic stroke. Crit Care. (2019) 23:209. doi: 10.1186/s 13054-019-2490-x, PMID: 31174580 PMC 6556035 · doi ↗ · pubmed ↗