Role of plasma Von-Willebrand factor in children with chronic liver diseases
Ola Galal Ali Behairy, Abdelhamid Mohamed El-Hamshary, Ahmed Adel Torky, Rana Atef Khashaba, Basma Galal Ali, Nashwa Farouk Mohamed

TL;DR
This study explores plasma Von-Willebrand Factor (VWF Ag) as a non-invasive tool to assess liver fibrosis severity in children with chronic liver disease.
Contribution
VWF Ag is proposed as a new non-invasive biomarker for liver fibrosis grading in pediatric chronic liver disease.
Findings
VWF Ag levels were significantly higher in children with chronic liver disease compared to healthy controls.
VWF Ag strongly correlates with fibrosis scores and histological stages in children.
VWF Ag shows high sensitivity and specificity for detecting mild and severe fibrosis.
Abstract
Children with chronic liver diseases (CLD) face more significant clinical problems. The most reliable technique for detecting liver fibrosis is still liver biopsy (LB). Our investigation assessed Von-Willebrand Factor Antigen (VWF Ag) plasma titer as a probable non-invasive predictor for grading liver fibrosis in children with CLD. 120 children participated in our case–control study, 60 of whom had CLD and the remaining 60 of whom were healthy. Underlying etiologies were diagnosed via clinical, biochemical, and histological criteria by LB. VWF Ag concentrations were determined in all participants using enzyme-linked immunosorbent assay (ELISA). VWF Ag mean titers were significantly elevated in CLD cases in contrast with controls (581.4 ± 279 vs. 166.9 ± 78 ng/ml; P < 0.001). There was a remarkable positive association amongst VWF Ag and total, direct serum bilirubin (TSB, DSB),…
Genes, proteins, chemicals, diseases, species, mutations and cell lines named across the full text — each resolved to its canonical identifier and authoritative record.
Click any figure to enlarge with its caption.
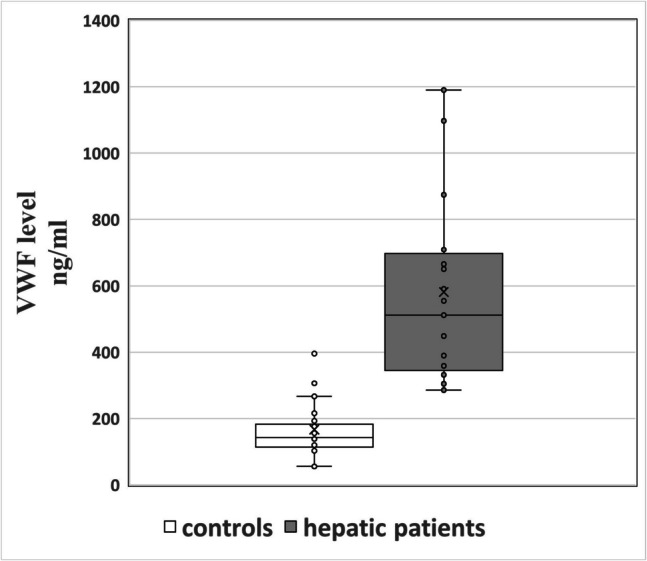 Figure 1
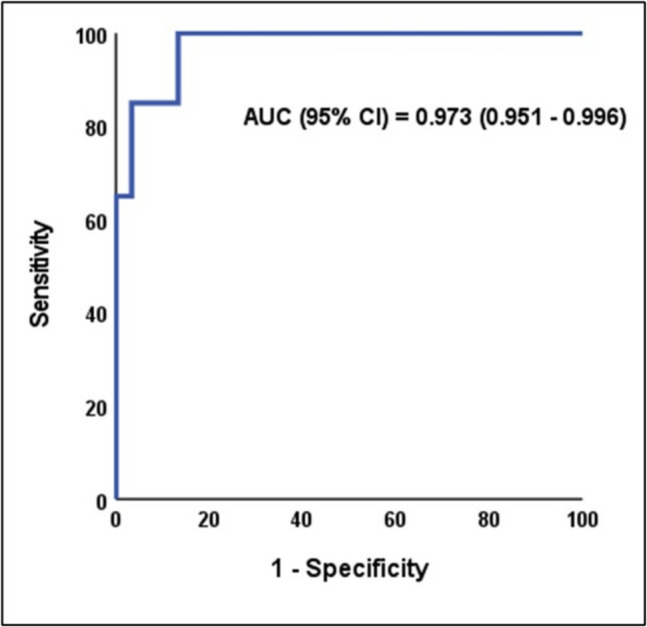 Figure 2
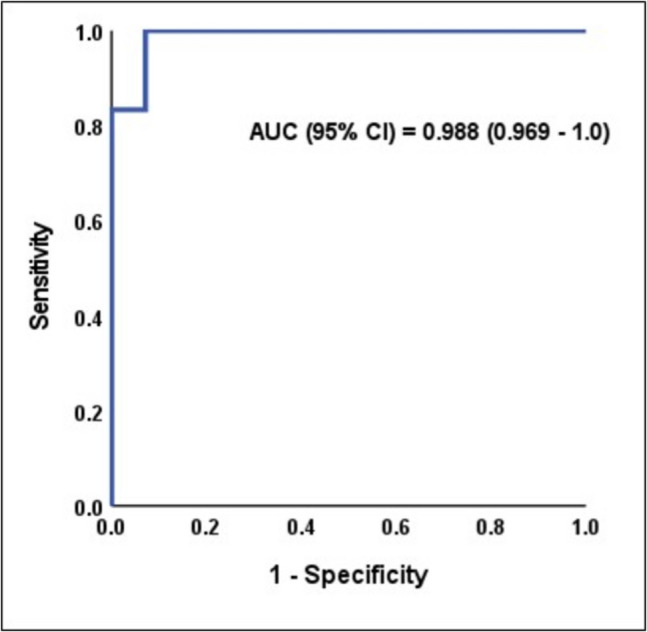 Figure 3
- —Benha University
Peer Reviews
No public reviews on file for this paper yet. If you reviewed it on a platform where reviews are public (OpenReview, ICLR, NeurIPS, ICML), you can paste yours below so the community can read it here.
Videos
No videos yet. Explain this paper in a talk, walkthrough, or lecture? Add one.
Taxonomy
TopicsLiver Disease and Transplantation · Liver Disease Diagnosis and Treatment · Liver Diseases and Immunity
Introduction
Chronic liver disorder is defined by its duration (usually > 3–6 months) or by the presence of severe liver disease or physical features of chronic liver disease (clubbing, jaundice, or hepatosplenomegaly). The severity varies; the affected child may have simply biochemical indications of liver malfunction, findings of chronic liver disease, or manifest as hepatic failure. It is distinguished by the ongoing destruction and restoration of the liver parenchyma [1]. CLD poses a significant global health issue, contributing to roughly 2 million deaths annually worldwide [2].
Children's liver disease has different causes depending on their age. Neonates and infants are often present with biliary atresia, idiopathic neonatal hepatitis, sepsis, total parenteral nutrition-induced or genetic cholestatic syndromes (e.g., progressive familial intrahepatic cholestasis) [3]. Older children are more likely to have glycogen storage diseases, Alagille syndrome, Wilson disease, or viral hepatitis. Autosomal recessive polycystic kidney disease and other ciliopathies are linked to liver fibrosis in early childhood. Autoimmune hepatitis and Alpha-1-antitrypsin deficiency may be presented at any age [4].
Multiple cellular processes are involved in liver fibrosis. Hepatic cells respond to injury by releasing specific cytokines that promote inflammation and activate hepatic stellate cells into collagen-producing myofibroblasts, according to current models for liver fibrosis [5]. The majority of chronic liver illnesses result in the increasing buildup of fibrous tissue inside the liver, which ultimately causes hepatic insufficiency, portal hypertension, and liver cirrhosis [6].
It is believed that endothelial dysfunction has a significant contribution to the emergence of various human illnesses, such as liver cirrhosis [7]. In cirrhotic liver, decreased bioavailability of vasodilator (nitric oxide) results in impaired endothelium-dependent relaxation in the hepatic microcirculation. This leads to an increase in intrahepatic vascular resistance, which ultimately results in portal hypertension [8].
Weibel-Palade bodies are where VWF is constitutively produced and amassed in endothelial cells [9]. In the setting of vascular injury, VWF, a giant multimeric glycoprotein, induces platelets to latch on to the confronted subendothelium and serves a fundamental function in maintaining coagulation factor VIII [10].
The mainstay for diagnosing and treating pediatric liver illness is still liver biopsy (LB). The LB function has also developed into a predictive tool for a number of liver illnesses, offering details like the staging of fibrosis and histologic grades of inflammation. A tiny biopsy sample may reveal localized and misleading liver abnormalities in many pediatric illnesses [11]. Fever, hematoma, discomfort, and supraventricular tachycardia are the main side effects after LB [12].
This research assessed the plasma VWF Ag titer as a simple predictor for detecting and categorizing the stage of liver fibrosis among children with CLD.
Patients and methods
This case–control analysis comprised 60 children and adolescents (up to 18 years old) with CLD of various causes, selected from Benha University Hospital's Pediatric Department's Pediatric Hepatology Clinic (32 patients were males and 28 were females with a mean age ± SD of 9 ± 4 years). An additional 60 healthy children from the overall community who were matched by age and sex served as the control group (22 children were males and 38 were females with a mean age ± SD of 11 ± 2 years).
Inclusion criteria for cases
Children under 18 years of both sexes were diagnosed with CLD, including hepatitis B or C, autoimmune hepatitis, cholestatic liver disorders, or metabolic liver disorders, with liver fibrosis previously identified through clinical, biochemical, and radiological assessments and confirmed by LB.
Inclusion criteria for controls
Controls were healthy children who volunteered from outpatient clinics during routine check-ups for the purpose of sport training and school routine examination, matched for age/sex, with normal liver function investigations, with no previous history of a liver disorder.
Exclusion criteria for both case and control
Malignancies, severe systemic diseases (active sepsis, advanced cardiopulmonary or renal dysfunction, connective tissue or neoplastic disorders), and hematologic conditions (e.g., von Willebrand disease, thrombotic thrombocytopenic purpura, bone marrow disorders, or possible hemolytic–uremic syndrome) were excluded.
Sample size calculation
The sample size was calculated using G*power software version 3.1.9.7 based on a previous study [13], which reported a large effect size of Von Willebrand Factor between patients and controls. The total sample size needed to detect a large effect size (d = 0.8) of Von Willebrand Factor between the studied groups was 90 patients. The sample was increased to 120 patients (60 per group) to compensate for possible use of non-parametric tests and possible laboratory failure. Alpha and power were adjusted for 0.05 and 0.95, respectively.
All participants were subjected to
- A.Clinical Evaluation
A thorough physical examination and history were taken. Body mass index (BMI), weight, and height were all assessed as part of anthropometrics. Egyptian pediatric references were used to compute percentiles.
- B.Radiological investigations
All cases were asked to report abdominal ultrasound and Doppler for detection of ascites, portal hypertension, and size of liver and spleen.
- C.Laboratory investigations
A complete blood count (CBC) was made with 1 mL of whole blood collected in an EDTA (Ethylene-diamine-tetra-acetic acid) vacutainer and gently mixed to prevent clotting. Hematological parameters, including hemoglobin concentration (Hb), mean corpuscular volume, mean corpuscular hemoglobin, red cell distribution width, and mean corpuscular hemoglobin concentration, were measured using the Sysmex KX-21N automated hematology analyzer (Sysmex Corporation, New York, USA). For differential leukocyte counts, peripheral blood smears were prepared and stained using Leishman’s stain.
Liver function tests**,** including aspartate aminotransferase (AST), alanine aminotransferase (ALT), alkaline phosphatase, gamma-glutamyl transferase (GGT), total serum protein, serum albumin, total serum bilirubin (TSB), and direct serum bilirubin (DSB), were performed following the collection of 4 mL of venous blood into plain tubes devoid of anticoagulant. Samples were given time to coagulate, then centrifuged at 1500 rpm for 15 min. The biochemical analyses were carried out using the Biosystem A1A autoanalyzer (Spain).
Coagulation profiles, including prothrombin time (PT), partial thromboplastin time (PTT), and international normalized ratio (INR), were evaluated using the HUMACLOT DUE PLUS® coagulation analyzer (Wiesbaden®, Germany).
In cases diagnosed with autoimmune hepatitis, gamma globulin titer, anti-nuclear antibodies (ANA), anti-smooth muscle antibody (ASMA), and anti–liver-kidney microsomal (anti-LKM) antibody titers were determined using the indirect immunofluorescence technique with INOVA Diagnostics, Inc. (Germany), offering NOVA Lite Rat Stomach, Kidney, and Liver kits.
Plasma VWF antigen (VWF Ag) titer was measured using the Human vWF ELISA Kit (Catalog No: DLR-vWF-Hu). Samples of peripheral blood were drawn without the use of a tourniquet, placed in tubes with heparin or EDTA as anticoagulants, and brought to the lab in an iced box. Samples were centrifuged at 1000 × g for 15 min at 2–8 °C within 30 min of assembly. For further examination, the extracted plasma was aliquoted and kept at −20 °C or −80 °C. VWF Ag typically ranges between 50 and 200 ng/ml.
Non-invasive serological markers were used for detection of fibrotic liver. These include APRI score (AST/platelet ratio index) and fibrosis-4 (FIB-4) score using age, platelet count, ALT and AST.
- D.Liver biopsy (LB) and staging
LB was done for CLD patients only. Every patient had a liver biopsy performed using the Menghini aspiration needle method under ultrasound guidance. All biopsies contained ≥ 11 portal tracts (median: 15, ranged from 11 to 20) as confirmed by histopathology. Formalin and paraffin were used to preserve biopsy specimens, which were then placed on a glass slide and stained with hematoxylin and eosin to determine the histological activity of hepatitis using the Ishak score. Masson trichrome was used to determine the stage of fibrosis. The fibrosis stages extended from F0 to F6 (F0 = no fibrosis, F1 = mild, F2-3 = moderate, F4-6 = severe) [14]. Patients with cirrhosis were categorized clinically according to Child–Pugh, MELD, and PELD scores as follows:
- PELD score: For younger children (below 12 years old), it was used to evaluate its impact on growth and decide whether liver transplantation was necessary. It is useful for estimating the predicted death rate from hepatic disease. It was calculated according to the formula; PELD = 4.80[Ln serum bilirubin (mg/dL)] + 18.57[Ln INR]—6.87[Ln albumin (g/dL)] + 4.36 (< 1 year old) + 6.67(growth failure) [15].
- MELD score: It proved to be helpful in assessing prognosis and setting priorities for liver transplant recipients. It was calculated according to the following formula: MELD = 3.78 [Ln serum bilirubin (mg/dL)] + 11.2 [Ln INR] + 9.57 [Ln serum creatinine (mg/dL)] + 6.43 [16].
- Child–Pugh scoring system: Its purpose was to forecast mortality in cirrhosis patients. Patients were divided into three groups: those with excellent liver function (A), those with mild liver function impairment (B), and those with advanced liver dysfunction (C). To classify patients, they used five clinical and laboratory criteria: prothrombin time, ascites, neurological disorders, serum bilirubin, and serum albumin [17, 18].
Statistical analysis
Data were analyzed using SPSS v28. Normality was assessed via the Shapiro–Wilk test and visual inspection. Normally distributed data were reported as mean ± SD, non-normal as median (range), and categorical variables as n (%). Group comparisons used t-test/Mann–Whitney U (quantitative) or chi-square/Fisher’s exact (categorical). Kruskal–Wallis test with Dunn’s post-hoc correction was used for ≥ 3 non-parametric groups. ROC analysis evaluated VWF’s diagnostic performance for liver fibrosis (area under the curve, AUC, cutoff, sensitivity/specificity). Spearman’s correlation assessed relationships. Significance was set at p < 0.05 [19].
Results
This study involved 120 children, categorized into two groups: the 1 st one comprised 60 hepatic cases diagnosed with CLD, while the 2nd one included 60 healthy children serving as controls. A statistically significant increase in positive consanguinity and family history of liver diseases was observed among hepatic cases in contrast with the control group. In terms of anthropometric data, hepatic cases showed significantly lower height percentile, weight, weight percentile, and BMI percentile in comparison to controls. Both groups had comparable age and sex (Table 1). Table 1. Demographic, anthropometric and etiological distributions of the studied groupsVariablesHepatic Cases (n = 60)Controls (n = 60)P-valueAge (years)Mean ± SD9 ± 411 ± 20.19Median (min–max)7.5 (0.2–17)9.5 (0.5–17)0.09Sex Malesn (%)32 (53)22 (37)0.14 Femalesn (%)28(47)38 (63)Positive Consanguinityn (%)42 (70)3 (5)< 0.001FH of liver diseasesn (%)13 (21.7)0 (0)< 0.001Weight (KG)Mean ± SD25.1 ± 10.131.7 ± 14.90.005Weight (percentile)Median (min–max)10 (1—77)32 (1—84)< 0.001Height (cm)Mean ± SD120.2 ± 26.4127.3 ± 28.80.16Height (percentile)Median (min–max)6 (1—93)12 (1—98)0.002BMIMean ± SD15.1 ± 317.6 ± 4.1**< 0.001BMI (percentile)Median (min–max)19 (1—65)58 (1—98)< 0.001**Etiology of hepatic casesGSDsn (%)39 (65%)Type Ia13 (22%)Type Ib9 (15%)Type III15 (25%)Type IX2 (3%)Auto immune hepatitis14 (23%)Congenital hepatic fibrosis3 (5%)Idiopathic neonatal hepatitis3 (5%)Dorfman syndrome1 (2%)^^Significant P-value, SD Standard deviation, n Number, %: Percentage, FH Family history, KG Kilograms, cm Centimeters, BMI Body mass index, min minimum, max maximum, GSDs Glycogen storage diseases
The clinical presentations of hepatic cases reveal that most individuals exhibited abdominal distension and pain (85%), while jaundice was observed in 60% of cases and fatigue in 30%. A small percentage of cases presenting with convulsions was reported in 5% of the cases and bleeding (in the form of hematemesis and melena) in 3%. Also, it is noted that the age of onset of liver disease ranged from 0.2 to 16 years old, with an average age of 4.3 years, and the duration of liver disease ranged from 0.4 to 13.5 years, with a mean of 5.14 years. All cases were presented with hepatomegaly, with liver span ranging from 7.5 to 19 cm, and 32% of cases presented with splenomegaly, with spleen size ranging from 6 to 12.5 cm.
Glycogen storage disease (GSDs) is the most common diagnosis, affecting 39 cases (65%) of which there were 13 cases with Type Ia, 9 cases with Type Ib, 15 cases with Type III and 2 cases with Type IX. Autoimmune hepatitis (AIH) is detected in 23% of cases. Congenital hepatic fibrosis and idiopathic neonatal hepatitis each account for 5% of the diagnoses. Dorfman syndrome is identified in one case only (Table 1).
Hepatic cases demonstrated statistically elevated levels of TSB, DSB, AST, ALT, ALP, GGT, and total IgG in contrast with controls (p < 0.001). PT was slightly prolonged in the hepatic group. In contrast, Hb, albumin, and total serum protein titers were significantly lower in hepatic cases. No statistically significant differences were observed between the two groups regarding INR, PTT, white blood cell count (WBC), or platelet count (PLT) (p > 0.05). Additionally, 13% of hepatic cases tested positive for ASMA, while 10% were positive for ANA (Table 2). Table 2. Laboratory findings in the studied groupsVariablesHepatic Cases (n = 60)Controls (n = 60)P-valueTSB (mg/dl)Median (min–max)2.1 (0.3—17.6)0.8 (0.4—1)** < 0.001DSB (mg/dl)Median (min–max)0.3 (0.1—4.6)0.2 (0.1—0.3) < 0.001AST (U/l)Median (min–max)150 (55—401)28 (16—39) < 0.001ALT (U/l)Median (min–max)89 (61—410)21 (12—25) < 0.001ALK ph. (U/l)Mean ± SD572 ± 122162 ± 38 < 0.001GGT (U/l)Median (min–max)47 (22—520)24 (12—45) < 0.001PT (seconds)Mean ± SD14.1 ± 1.613.5 ± 0.90.011INRMean ± SD1.3 ± 0.11.1 ± 0.10.180PTT (seconds)Mean ± SD33 ± 532 ± 40.182Total Serum protein (g/dl)Mean ± SD4.9 ± 0.55.9 ± 0.4 < 0.001Albumin (g/dl)Mean ± SD3.2 ± 0.33.8 ± 0.2 < 0.001Median (min–max)3.1 (2.5—3.6)3.7 (3.4–3.9)Hb (g/dl)Mean ± SD10.4 ± 0.912.4 ± 0.60.010Median (min–max)9.2 (7.1–11.2)11.4 (10.3–13.5)WBC (10^3/ul)Mean ± SD7.9 ± 37.4 ± 20.267Median (min–max)6.2 (4.5–8.9)5.8 (4.1–9.3)PLT (10^3/ul)Mean ± SD240 ± 118278 ± 940.05Median (min–max)199 (49–374)205 (154–406)Total IgG (mg/dl)Mean ± SD1118 ± 377980 ± 1270.009Median (min–max)1212 (750–2016)995 (640–1310)Positive ASMAN (%)8 (13)Positive Anti-Mitochondrial AbsN (%)0Positive ANAN (%)6 (10)Positive Anti-LKM AbsN (%)0plasma VWF titer(ng/ml)Mean ± SD581.4 ± 279166.9 ± 78 < 0.001**Median (min–max)511.6(285.5—1190.1)142.3(55.4—395.3)^*^Significant P-value, TSB: Total serum bilirubin, DSB Direct serum bilirubin, AST Aspartate aminotransferase, ALT Alanine aminotransferase, ALK ph. Alkaline phosphatase, GGT Gamma-glutamyl transferase, PT Prothrombin time, INR International normalized ratio, PTT Partial thromboplastin time, Hb Hemoglobin, WBC White blood cell count, PLT Platelet count, IgG Immunoglobulin G. n Number, % Percentage, ASMA Anti-smooth muscle antibody, Abs Antibodies, LKM Liver kidney microsomal, ANA Antinuclear antibody, VWF von Willebrand factor, min minimum, max maximum
In hepatic cases, the degree of fibrosis is predominantly mild, affecting 70% of hepatic cases, with moderate fibrosis observed in 20% and severe fibrosis in 10%. Regarding histological activity, 65% of cases exhibit mild activity, 25% have minimal activity, and 10% have moderate activity. Also, the mononuclear inflammatory cells are the most prevalent, observed in 80% of hepatic cases. Lymphocytes are present in 20%, and plasma cells are identified in 15% of the cases, while eosinophils and multinucleated giant cells are each found in 10% of the cases (Table 3). Table 3. Liver biopsy among the studied cases according to the Ishak scoring systemVariablesn%Degree of FibrosisMild fibrosis1–2/64270Moderate fibrosis3–4/61220Severe fibrosis5–6/6610Histological activity indexMinimal1–3/181525Mild4–8/183965Moderate9–12/18610Severe13–18/1800Types of cellsMononuclear Inflammatory Cells4880Lymphocytes1220Eosinophils610Multinucleated giant cells610Plasma Cells915n Number, % Percentage
Plasma VWF titers were statistically increased in hepatic cases with a median of 511.6 ng/ml (range 285.5–1190.1) in contrast with 142.3 ng/ml (range 55.4–395.3) in controls (P < 0.001) **(Fig. 1) (Table 2).**Fig. 1. Boxplot showing the distribution of plasma VWF Ag levels (ng/ml) in CLD cases (n = 60) and controls (n = 60). The central line represents the median, the box spans the interquartile range (IQR; 25th–75th percentiles), and whiskers extend to the minimum and maximum values. Outliers are plotted as individual points
Plasma VWF titers have statistically positive correlations with TSB, DSB, AST, ALT, liver span, portal hypertension, MELD, PELD, Child–Pugh scores, APRI (AST to Platelet Ratio Index), and FIB-4 (Fibrosis-4) scores (P < 0.05). Furthermore, there is a negative correlation between plasma VWF titer and BMI, Hb, WBC, and PLT (P < 0.05). Other variables, including age, weight, height, ALP, PT, INR, PTT, total serum protein, albumin, total IgG, and ASMA, did not show statistical correlations with plasma VWF titer (P > 0.05) (Table 4). Table 4. Correlation between plasma VWF and other parameters in hepatic casesVariablesplasma VWF levelrPAge (years)0.0240.854Weight (KG)−0.1030.432Height (cm)0.0210.873BMI−0.3830.003*TSB0.3900.002DSB0.458 < 0.001AST0.6580.002ALT0.7650.003ALK ph0.0080.955GGT−0.0930.478PT0.0330.801INR−0.1920.141PTT−0.1980.128Total serum protein−0.0230.861Albumin−0.1260.337Hb−0.2760.033*WBC−0.2850.027PLT−0.3080.017Total IgG−0.060.648PELD score0.3030.036MELD score0.4170.021Child–Pugh score0.2970.046APRI0.4200.002FIB-40.3800.006ASMA0.1350.183Liver span0.680 < 0.001Portal hypertension0.5790.002**^*^Significant P-value, VWF von Willebrand factor, r Correlation coefficient, P P-value, KG Kilograms, cm Centimeters, BMI Body mass index, TSB Total serum bilirubin, DSB Direct serum bilirubin, AST Aspartate aminotransferase, ALT Alanine aminotransferase, ALK ph Alkaline phosphatase, GGT Gamma-glutamyl transferase, PT Prothrombin time, INR International normalized ratio, PTT Partial thromboplastin time, Hb Hemoglobin, WBC White blood cell count, PLT Platelet count, IgG Immunoglobulin, G PELD Pediatric end-stage liver disease, MELD Model for end-stage liver disease, ASMA Autoimmune specific marker antibody, APRI AST To Platelet Ratio Index, FIB Fibrosis
Plasma VWF titer was statistically elevated in hepatic cases with advanced degrees of fibrosis and elevated histological activity index. Also, cases with mononuclear inflammatory cells and lymphocytes have a statistically elevated median VWF titer of 831.2 ng/ml in contrast with those without mononuclear inflammatory cells and lymphocytes, who have a median of 425.1 ng/ml. Plasma cells are associated with an elevated median VWF titer of 650.8 ng/ml in contrast with 448.3 ng/ml in cases without plasma cells. Also, according to the many causes of liver fibrosis, the plasma titer of VWF in hepatic patients does not exhibit statistical significance (p > 0.05) (Table 5). Table 5. Plasma VWF according to results of liver biopsy and etiology of CLDVariablesVWF titer (ng/ml)P- valueDegree of FibrosisMildMean ± SD498 ± 99**< 0.001Moderate562 ± 102Severe603 ± 92Histological Activity IndexMinimalMean ± SD401 ± 95< 0.001Mild491 ± 87Moderate532 ± 101Severe0Type Of CellsMononuclear Inflammatory CellsYesMedian (min–max)831.2 (511.6–1190.1)< 0.001No425.1 (285.5–1097)LymphocytesYesMedian (min–max)831.2 (511.6–1190.1)< 0.001**No425.1 (285.5–1097)EosinophilsYesMedian (min–max)533.3 (511.6–554.9)0.674No479.9 (285.5–1190.1)Multinucleated giant cellsYesMedian (min–max)533.3 (511.6–554.9)0.674No479.9 (285.5–1190.1)Plasma CellsYesMedian (min–max)650.8 (590.3–1097)0.012*No448.3 (285.5–1190.1)Etiology of CLDAutoimmune HepatitisMedian (min–max)650.8 (590.3—1097)0.92Mean ± SD779.4 ± 239Congenital Hepatic FibrosisMedian (min–max)654.1 (552.1–861.6)0.92Mean ± SD689.2 ± 152.7Glycogen Storage DiseaseMedian (min–max)395.9 (285.5–1190.1)0.078Mean ± SD536.8 ± 298Idiopathic Neonatal HepatitisMedian (min–max)621.3 (511.2–699.5)0.92Mean ± SD610.7 ± 123.3
The ROC analysis for plasma VWF in predicting mild (F1-2) and severe (F5-6) liver fibrosis yields a statistically significant and excellent AUC, with a 95% confidence interval. The best cutoff value is > 266.5 ng/ml for mild fibrosis and > 590.3 ng/ml for severe fibrosis, at which sensitivity (100%), specificity (86.7%), positive predictive value (PPV) (88.2%), and negative predictive value (NPV) (100%) for mild fibrosis and sensitivity (100%), specificity (92.9%), PPV (85.7%), and NPV (100%) for severe fibrosis (Table 6) (Figs. 2 & 3). Table 6ROC analysis of plasma VWF to predict mild and severe liver fibrosis in CLD from controlsROC characteristicsMild fibrosis (F1-2)severe fibrosis (F5-6)AUC0.9730.98895% CI0.951–0.9960.969–1.0Best cutoff > 266.5 > 590.3Sensitivity100%100%Specificity86.7%92.9%PPV88.2%85.7%NPV100%100%P-value** < 0.001***** < 0.001***^*^Significant P-value, ROC Receiver operating characteristic, AUC Area under the curve, CI Confidence interval, PPV Positive predictive value, NPV Negative predictive valueFig. 2ROC analysis of plasma VWF to predict mild fibrosisFig. 3ROC analysis of plasma VWF to predict severe fibrosis
Discussion
Liver fibrosis is a severe condition resulting from persistent hepatic damage caused by various liver diseases, including viral hepatitis, metabolic liver diseases, autoimmune hepatitis, and hereditary disorders. It significantly increases liver-related mortality, regardless of the cause, and can also affect liver transplant outcomes in children [20].
GSDs emerged as the predominant diagnosis (65%), followed by AIH (23%), while congenital hepatic fibrosis and idiopathic neonatal hepatitis account only for 5% of cases. The high prevalence of glycogen storage disease reflects our center’s role as a referral site for metabolic disorders. Viral hepatitis was rare (0%), likely due to Egypt’s successful hepatitis C elimination program, while consanguinity (70% in cases) may increase autosomal recessive GSD.
VWF is a multimeric glycoprotein with adhesive properties, physiologically secreted by activated endothelial cells during the initial stages of hemostasis [21].
Notably, GSDs had lower median VWF levels (395.9 ng/ml) than AIH (650.8 ng/ml), possibly due to differing fibrogenic mechanisms. In metabolic diseases, fibrosis arises from hepatocyte accumulation, whereas autoimmune hepatitis drives endothelial activation via inflammation.
The current investigation was intended to determine if VWF Ag titer could identify and classify the degree of liver fibrosis in children with CLD.
When comparing hepatic cases to controls, the mean values of plasma VWF increased in a highly statistically notable manner (581.4 ± 279 vs. 166.9 ± 78) (P < 0.001). Additionally, there were negligible variations in VWF Ag titer with respect to the cause of liver illness (P > 0.05). Furthermore, it was shown that those with extensive fibrosis had considerably higher VWF Ag levels (P < 0.05). Moreover, hepatic individuals with portal hypertension and esophageal varices had a considerably higher VWF Ag titer than those without these conditions (P < 0.05).
Abdelrazek et al.'s [13] recent study in Egypt found that cirrhotic patients had a much higher mean VWF titer (167.1 ± 47.8 IU/dL) than healthy controls (112.9 ± 36.1 IU/dL) (P < 0.001). Both comparing cases to controls and stratifying cases by disease severity revealed this considerable increase: those with advanced fibrosis and varices had significantly higher VWF antigen titers (P < 0.05). Furthermore, strong statistical associations between VWF Ag titer and Child–Pugh score and fibrosis stage were found (P < 0.001). Higher VWF Ag levels in our study may reflect pediatric-specific pathophysiology or methodological variations (e.g., ELISA kit sensitivity).
The rise in VWF titer during liver fibrosis has been attributed to several mechanisms, including endothelial damage induced by bacterial components that enhance VWF secretion [22]. Cases with liver cirrhosis have been observed to have elevated VWF titers. Elevated VWF titer in cirrhosis may result from endotoxemia due to bacterial translocation and shear stress induced by hyperdynamic splanchnic circulation (portal hypertension), both of which may promote conformational changes in VWF that enhance its affinity for platelet binding [21].
These results are aligned with those of Goel et al. [23], who demonstrated the role of VWF:Ag and its glycoprotein Ib binding activity as non-invasive biomarkers in pediatric portal hypertension (PHT). Elevated VWF:Ag was significantly associated with clinically significant varices (223 IU/dl; p = 0.015) and variceal bleeding (174 IU/dl; p = 0.077), indicating their potential as predictors of PHT-related complications. Notably, our study confirms these findings, as VWF Ag correlated strongly with PHT (r = 0.579, P = 0.002) and fibrosis severity (Table 4), suggesting broader utility in pediatric CLD staging.
The current study's results demonstrate that VWF Ag is a major indicator of liver fibrosis (P < 0.001), demonstrating strong diagnostic performance across all evaluated cutoff values (> 266.5 in mild fibrosis and > 590.3 in severe fibrosis) with 100% sensitivity, specificity ranging from 86.7% to 92.9%, PPV ranging from 85.7% to 88.2%, and NPV 100%. The ROC analysis further validated plasma VWF as an excellent discriminator for both mild and severe fibrosis, with AUC values of 0.973 and 0.988, respectively. According to these results, plasma VWF is believed to be a promising simple indicator of the degree of fibrosis.
Also, the positive correlations between VWF Ag and markers of liver injury (e.g., AST, ALT, bilirubin, liver and spleen size) and the negative correlations with BMI, hemoglobin, WBC, and platelets affirm its relevance as a marker of liver pathology.
VWF Ag should be used in combination with conventional biomarkers and/or criteria for the identification of severe liver fibrosis in order to increase the ability to identify liver fibrosis stages [24].
Maieron et al. [25] used AUROC analysis to compare VWF's performance to METAVIR scoring system for staging liver fibrosis in order to investigate the diagnostic value of VWF in evaluating liver fibrosis. VWF was shown to be one of the best indicators for differentiating between instances with fibrosis (F1–F4) and those without (F0), with an AUROC of 0.703. The authors came to the conclusion that, in situations of chronic hepatitis C infection, VWF offers a straightforward yet useful method for grading liver fibrosis and detecting undetectable cirrhosis.
Similarly, Takaya et al. [23] found that VWF is a potentially useful biomarker to anticipate the onset of HCC and recognize severe forms of liver fibrosis. The VWF Ag AUC for the diagnosis of advanced liver fibrosis phase was 0.721.
VWF Ag titer and the degree of liver disease, as indicated by fibrosis stage, as well as PELD, MELD, and Child–Pugh scores among the patients under investigation, were shown to be statistically considerably associated in the current study (P ≤ 0.05). According to Lisman et al. [22], the median VWF propeptide titer in the reference group was 89% (p < 0.001), but the titers were significantly elevated in Child A, B, and C (488%, 711%, and 735%, respectively) with cirrhosis. Additionally, they noted that VWF and Child classification had a favorable association.
Since VWF Ag is an acute-phase reactant, fibrosis or inflammation (such as viral or autoimmune hepatitis) might cause its levels to increase [26]. Given the strong link between VWF Ag titer and both APRI and FIB-4 (P < 0.05), which suggests fibrosis, this study concludes that it is most likely caused by fibrosis. Also, its correlation with high liver span and portal hypertension (p < 0.05) was often due to fibrosis.
Conclusion
VWF Ag titer may be a useful predictive indicator in assessing the intensity of liver fibrosis in children with CLD, as evidenced by its positive linkages with liver function parameters, fibrosis grade, and histological activity index.
Limitations
The reliability of the findings may be impacted by the somewhat small sample size. Additionally, differences in VWF Ag titer across ages may affect the precision of the diagnosis. It is challenging to evaluate how VWF Ag titers fluctuate over time in response to therapy or as disease progresses without longitudinal follow-up. VWF activity should be measured alongside VWF Ag to detect functional deficits in cirrhotic patients. As we were a tertiary center, metabolic liver diseases were more predominant.
The reference list from the paper itself. Each links out to its DOI / PubMed record.