Uncovering abnormal gray and white matter connectivity patterns in Alzheimer’s disease spectrum: a dynamic graph theory analysis for early detection
Juanjuan Jiang, Tao Kang, Ronghua Ling, Yingqian Liu, Jiuai Sun, Yiming Li, Xiaoou Li, Hui Yang, Bingcang Huang

TL;DR
This study uses dynamic brain connectivity patterns to detect early signs of Alzheimer's disease before symptoms appear, improving early diagnosis and intervention.
Contribution
The novel approach combines dynamic gray-white matter functional connectivity with machine learning to enhance preclinical Alzheimer's detection.
Findings
Dynamic functional connectivity (DFC) with short sliding windows outperforms static connectivity in detecting early functional disruptions in Alzheimer's.
Key early abnormalities in the anterior cingulate and sensorimotor white matter networks correlate with Aβ deposition and APOE ε4 genotype.
Machine learning models using DFC achieve higher classification accuracy (AUCs 0.85–0.92) for Alzheimer's spectrum stages compared to static methods.
Abstract
Alzheimer’s disease (AD) requires early intervention at preclinical stages like subjective memory complaints (SMC). Traditional static brain network analyses lack sensitivity to detect early functional disruptions in SMC. This study aimed to improve preclinical AD stratification by integrating dynamic gray-white matter functional connectivity (DFC) and machine learning. Using multi-cohort ADNI data [N = 1,415 participants across cognitive normal[CN], SMC, and cognitive impairment [CI]groups],dynamic functional networks were constructed via sliding-window analysis (20–50 TR windows, 98% overlap) of 200 gray matter (Schaefer atlas) and 128 data-driven white matter nodes. DFC metrics (standard deviation of Fisher z-transformed correlations) were used to identify group differences and classify AD spectrum stages. Support vector machine (SVM) models were trained to differentiate CN/SMC/CI,…
Genes, proteins, chemicals, diseases, species, mutations and cell lines named across the full text — each resolved to its canonical identifier and authoritative record.
Click any figure to enlarge with its caption.
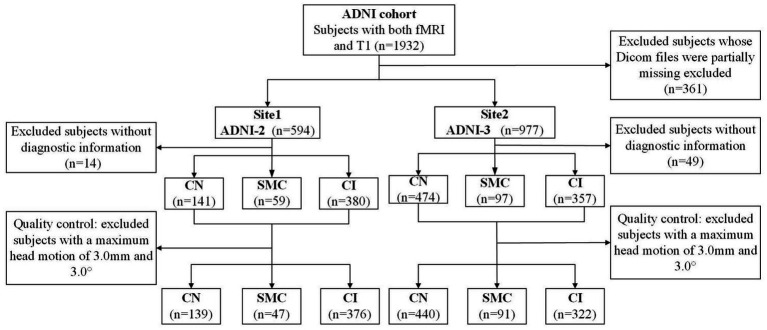 Figure 1
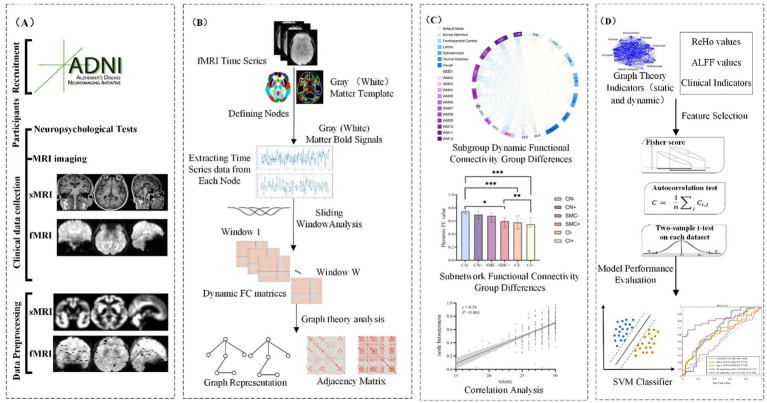 Figure 2
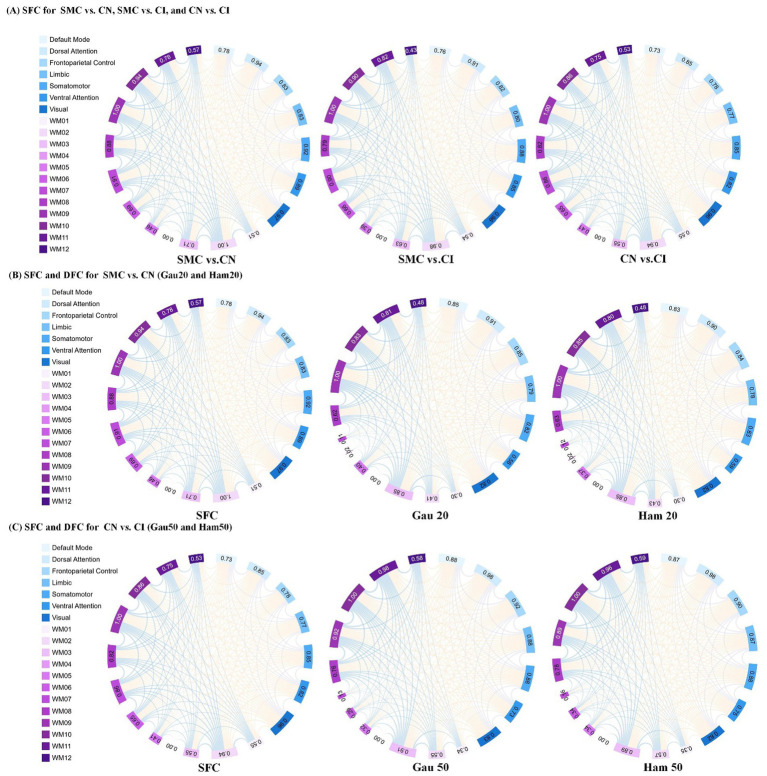 Figure 3
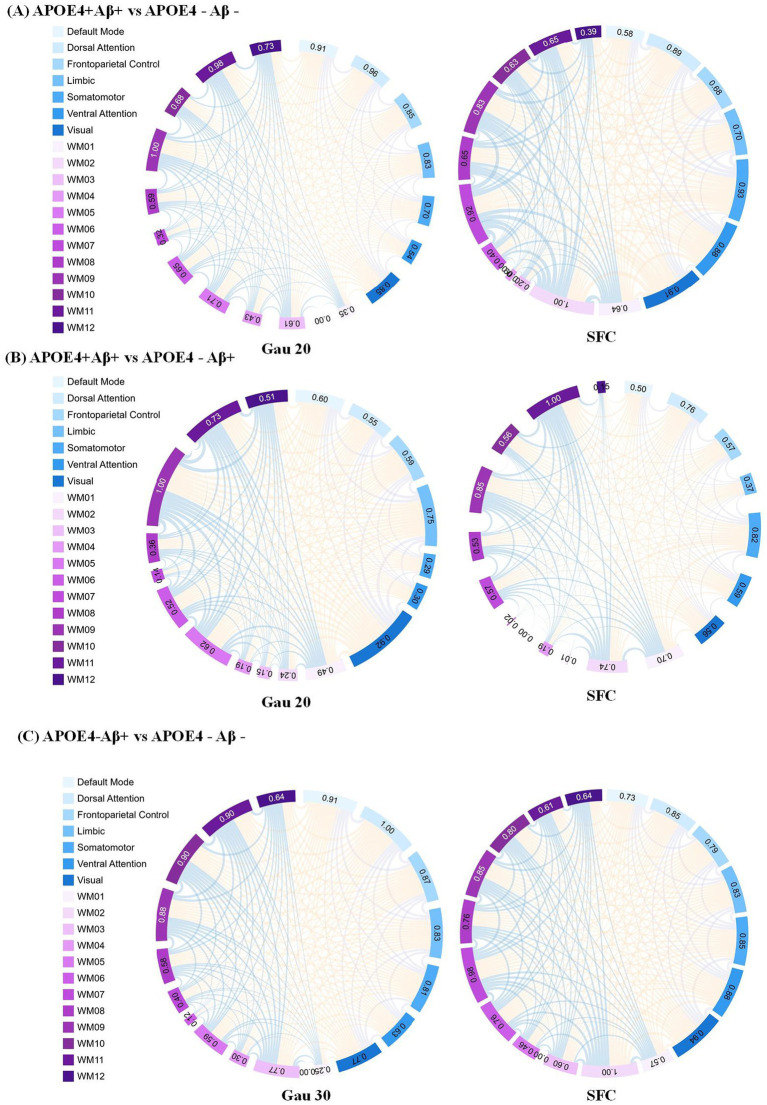 Figure 4
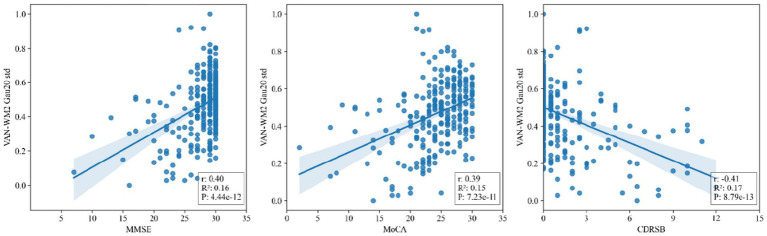 Figure 5
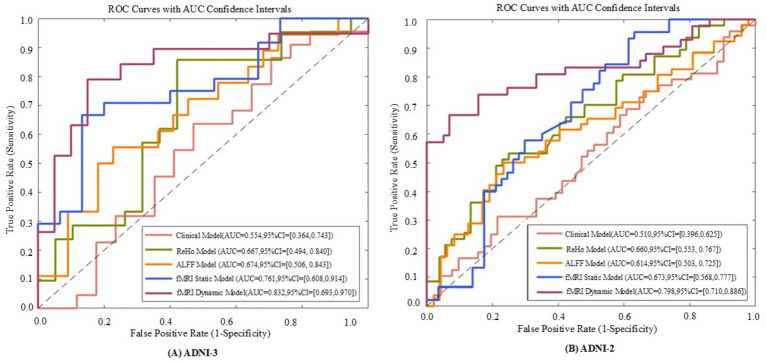 Figure 6
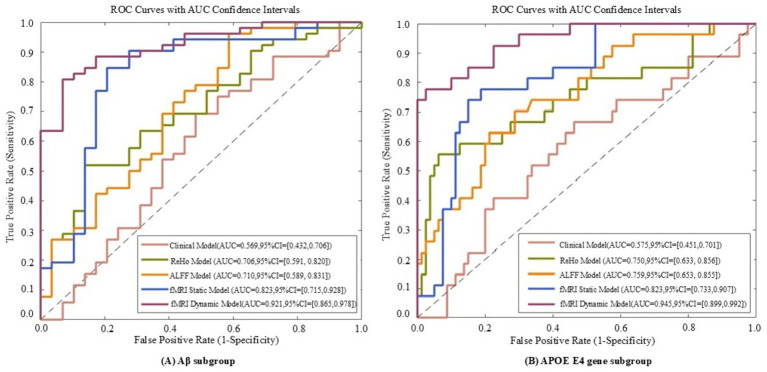 Figure 7
| Aβ subgroup | ApoE ε4 subgroup | |||||
|---|---|---|---|---|---|---|
| Classification features | Accuracy (%) | Sensitivity (%) | Specificity (%) | Accuracy (%) | Sensitivity (%) | Specificity (%) |
| Clinical | 55.47 ± 12.11 | 56.25 ± 11.46 | 54.07 ± 13.93 | 57.18 ± 8.97 | 51.33 ± 10.98 | 59.15 ± 10.54 |
| ReHo | 64.51 ± 2.03 | 66.92 ± 4.23 | 60.17 ± 8.10 | 68.55 ± 4.35 | 68.67 ± 5.03 | 68.51 ± 5.54 |
| ALFF | 66.72 ± 2.98 | 70.69 ± 5.68 | 59.59 ± 4.30 | 69.57 ± 2.71 | 66.07 ± 8.27 | 70.75 ± 5.23 |
| Static graph theory | 78.25 ± 6.73 | 78.77 ± 9.45 | 79.31 ± 9.48 | 77.91 ± 6.26 | 77.33 ± 8.36 | 80.11 ± 8.02 |
| Dynamic graph theory |
|
|
|
|
|
|
| ADNI-2 ( | ADNI-3 ( | |||||
|---|---|---|---|---|---|---|
| CN | SMC | CI | CN | SMC | CI | |
| Sex | 58/81 | 20/27 | 207/169 | 176/264 | 34/57 | 185/137 |
| Age | 75.0 ± 6.3 | 72.6 ± 5.2 | 73.4 ± 7.2 | 73.2 ± 7.4 | 76.6 ± 5.5 | 76.4 ± 8.2 |
| Education | 16.7 ± 2.1 | 16.9 ± 3.0 | 15.9 ± 2.6 | 16.8 ± 2.2 | 16.6 ± 2.4 | 15.7 ± 2.7 |
| ApoE ε4 | 83/56 | 31/16 | 163/213 | 261/142 | 62/29 | 172/121 |
| Aβ | 31/13 | 20/14 | 38/81 | 191/60 | 47/18 | 64/72 |
| MMSE | 29.0 ± 1.4 | 28.9 ± 1.1a* | 25.7 ± 3.8a* | 29.0 ± 1.8 | 29.0 ± 1.2b* | 25.9 ± 4.0b* |
| MoCA | 25.8 ± 2.25 | 26.1 ± 2.25a* | 21.2 ± 4.9a* | 26.2 ± 2.63 | 26.6 ± 2.8b* | 20.8 ± 4.6b* |
| CDR-SB | 0.09 ± 0.21 | 0.21 ± 0.72a* | 2.68 ± 2.18a* | 0.08 ± 0.27 | 0.39 ± 0.69b* | 2.76 ± 2.74b* |
| Differential connections (Pairs) | ADNI-3 | ||||||
|---|---|---|---|---|---|---|---|
| Site1 | Site2 | ||||||
| SMC vs. CN | SMC vs. CI | CN vs. CI | SMC vs. CN | SMC vs. CI | CN vs. CI | ||
| SFC | 2 | 54 | 118 | 2 | 22 | 94 | |
| DFC | Ham20 | 38 | 60 | 8 | 6 | 6 | 14 |
| Ham30 | 22 | 40 | 6 | 6 | 6 | 12 | |
| Ham40 | 10 | 28 | 8 | 8 | 18 | 16 | |
| Ham50 | 6 | 32 | 2 | 6 | 18 | 14 | |
| Gau20 | 36 | 60 | 12 | 10 | 6 | 16 | |
| Gau30 | 32 | 42 | 10 | 6 | 6 | 12 | |
| Gau40 | 16 | 22 | 8 | 10 | 16 | 14 | |
| Gau50 | 10 | 32 | 6 | 8 | 18 | 20 | |
| Differential connections (Pairs) | Within APOE4 + Group (Aβ + vs. Aβ-) | Within APOE4- Group (Aβ + vs. Aβ-) | APOE4 + Aβ + vs. APOE4-Aβ- | APOE4 + _Aβ- vs. APOE4-_Aβ+ | |
|---|---|---|---|---|---|
| SFC | 6 | 8 | 136 | 28 | |
| DFC | Gau20 | 4 | 34 | 12 | 120 |
| Gau30 | 10 | 22 | 26 | 96 | |
| Gau40 | 8 | 20 | 24 | 64 | |
| Gau50 | 6 | 14 | 18 | 54 | |
| Ham20 | 4 | 26 | 14 | 110 | |
| Ham30 | 12 | 22 | 24 | 76 | |
| Ham40 | 6 | 16 | 20 | 56 | |
| Ham50 | 12 | 12 | 16 | 50 | |
| Differential connections (Pairs) | Within Aβ + Group (APOE4 + vs. APOE4-) | Within Aβ- Group (APOE4 + vs. APOE4-) | |
|---|---|---|---|
| SFC | 82 | 70 | |
| DFC | Gau20 | 70 | 18 |
| Gau30 | 50 | 12 | |
| Gau40 | 46 | 8 | |
| Gau50 | 38 | 10 | |
| Ham20 | 62 | 12 | |
| Ham30 | 42 | 12 | |
| Ham40 | 34 | 6 | |
| Ham50 | 24 | 8 | |
| ADNI2 | ADNI 3 | |||||
|---|---|---|---|---|---|---|
| Kernel function | Accuracy (%) | Sensitivity (%) | Specificity (%) | Accuracy (%) | Sensitivity (%) | Specificity (%) |
| Linear | 70.19 ± 7.58 | 71.45 ± 11.95 | 69.65 ± 11.45 | 67.8 ± 5.3 | 66.81 ± 8.52 | 69.24 ± 9.76 |
| Polynomial | 69.06 ± 7.38 | 67.3 ± 11.19 | 72.07 ± 10.41 | 64.1 ± 5.12 | 63.16 ± 11.44 | 65 ± 11.05 |
| RBF | 76.7 ± 5.95 | 75.51 ± 6.12 | 78.27 ± 5.43 | 72.73 ± 5.86 | 73.33 ± 7.52 | 72.22 ± 5.86 |
| Sigmoid | 68.33 ± 8.13 | 68.2 ± 11.97 | 69.44 ± 12.89 | 65.66 ± 5.39 | 66.67 ± 8.2 | 64.91 ± 10.81 |
| ADNI2 | ADNI3 | |||||
|---|---|---|---|---|---|---|
| Classification features | Accuracy (%) | Sensitivity (%) | Specificity (%) | Accuracy (%) | Sensitivity (%) | Specificity (%) |
| Clinical | 54.27 ± 8.6 | 55.54 ± 6.99 | 58.41 ± 5.41 | 52.17 ± 6.92 | 58.65 ± 6.04 | 49.18 ± 10.51 |
| ReHo | 60.59 ± 6.38 | 57.82 ± 9.69 | 64.14 ± 11.41 | 60.33 ± 6.05 | 56.93 ± 11.51 | 62.51 ± 11.71 |
| ALFF | 63.66 ± 6.41 | 62.71 ± 8.55 | 65.95 ± 10.08 | 60.28 ± 4.28 | 57.55 ± 8.61 | 64.08 ± 7.54 |
| Static graph theory | 69.37 ± 6.91 | 68.41 ± 6.46 | 71.23 ± 5.68 | 62.01 ± 5.72 | 61.89 ± 6.36 | 62.11 ± 6.86 |
| Dynamic graph theory | 76.7 ± 5.95 | 75.51 ± 6.12 | 78.27 ± 5.43 | 72.73 ± 5.86 | 73.33 ± 7.52 | 72.22 ± 5.86 |
Peer Reviews
No public reviews on file for this paper yet. If you reviewed it on a platform where reviews are public (OpenReview, ICLR, NeurIPS, ICML), you can paste yours below so the community can read it here.
Videos
No videos yet. Explain this paper in a talk, walkthrough, or lecture? Add one.
Taxonomy
TopicsFunctional Brain Connectivity Studies · Dementia and Cognitive Impairment Research · Alzheimer's disease research and treatments
Introduction
1
Alzheimer’s disease (AD) is a prevalent neurodegenerative disorder with a progressive, irreversible course, significantly threatening elderly physical and mental health (Singh et al., 2016; Østerhus, 2020). Early intervention is critical due to AD’s irreversible damage and progression (Rasmussen and Langerman, 2019). Subjective memory complaints (SMC) represent a potential preclinical AD stage, where identification and treatment may delay progression (Choe et al., 2018; Warren et al., 2022; Amariglio et al., 2012). Amyloid-β (Aβ) and apolipoprotein E (APOE) E4 status are incorporated into AD spectrum classification criteria, playing key roles in early diagnosis (Schmechel, 1995; Castellano et al., 2011). Resting-state functional MRI (rs-fMRI)-based brain network analysis, effective for characterizing complex network topology, is a valuable early AD diagnostic tool (Supekar et al., 2008). Prior studies report altered functional network topology in AD and preclinical stages, such as declining node clustering and modularity with increasing Clinical Dementia Rating Scale (CDR) scores, indicating large-scale connectivity disruptions (Brier et al., 2012; Zhao et al., 2012). Global functional connectivity assessments show reduced efficiency and clustering coefficients in AD, particularly in bilateral hippocampi (Supekar et al., 2008; Yang et al., 2018).
Current dynamic functional magnetic resonance imaging (fMRI) methods often use fixed sliding windows with strong prior assumptions, limiting generalizability across ethnic groups and scanners (Qin et al., 2024; Liuzzi et al., 2019; Filippi et al., 2019). High individual heterogeneity in SMC further challenges existing approaches (Warren et al., 2022). Machine learning advancements have improved fMRI-based AD diagnosis by integrating detailed image features and optimizing classification (Klöppel et al., 2013; Khan et al., 2021; Jia and Lao, 2022). Unlike static functional connectivity (SFC), which assumes constant networks, dynamic functional connectivity (DFC) captures transient fluctuations, enhancing sensitivity to early pathology (Supekar et al., 2008) (Córdova-Palomera, 2017). For example, 20-TR sliding-window DFC detects subtle A𝛽-related disruptions in the posterior default mode network (DMN) and white matter tracts, correlating with amyloid PET load (Palmqvist, 2017; Ali et al., 2023; Reijmer et al., 2016).
Dynamic graph theory metrics (e.g., modularity, path length variability) reflect network integration/segregation dynamics (Ghanbari et al., 2023; Liao et al., 2018; Xia et al., 2010), outperforming static metrics in early AD classification (Chen et al., 2021; Yang et al., 2022; Hu et al., 2020). These spatiotemporal features improve machine learning models; e.g., Karim et al. achieved 92% AD classification accuracy using rs-fMRI and graph metrics with SVM (Karim et al., 2024), while Hojjati et al. reported 89–97% accuracy for MCI conversion prediction using multimodal MRI (Lin et al., 2023). Chen et al. distinguished SMC from controls with 79.23% accuracy via functional connectivity and graph parameters (Hao et al., 2019).
Despite progress, SMC-stage research remains limited (Sajid et al., 2024). Therefore, developing a computer-aided diagnosis model for SMC using dynamic brain network graph theory parameters and machine learning methods holds significant clinical value. Building on these prior findings, our study addresses this gap by integrating dynamic gray-white matter connectivity and machine learning. Using multi-cohort ADNI data, we hypothesized that short-window 20 TR DFC metrics would surpass SFC in detecting early SMC disruptions. Combining data-driven white matter parcellation with dynamic graph theory, we aimed to identify A𝛽/APOE E4-linked connectivity hubs (e.g., anterior cingulate WM4, sensorimotor WM5) and develop an SVM-based classifier for CN/SMC/CI discrimination, with subgroup analyses in A𝛽+ and APOE E4 + populations. Our findings seek to establish dynamic brain networks as reliable tools for preclinical AD stratification and timely SMC intervention (Figures 1–4).
The flowchart of all participants in this study.
The workflow of this study.
Presents an analysis of inter-group differences based on static and dynamic brain gray and white matter functional networks, visualized as chord diagrams that illustrate functional connectivity (FC) pairs showing group differences. At the ROI level, FC pairs with group differences were identified using two - sample t-tests. ROIs were categorized according to 7 gray matter sub- networks and 12 white matter sub-networks. For each sub-network, the sum of connection strengths exhibiting differences was computed. The circumference of each chord diagram is segmented into 7 parts, where the length of each segment represents the connection strength of the corresponding sub - network. The thickness of the connecting lines indicates the strength of connectivity between brain regions. Panel (A) displays SFC (static functional connectivity) for the group comparisons of SMC vs. CN, SMC vs. CI, and CN vs. CI. Panel (B) shows both SFC and DFC (dynamic functional connectivity) with Gaussian window of 20 s (Gau20) and Hamming window of 20 s (Ham20) for the SMC vs. CN comparison. Panel (C) presents SFC and DFC with Gaussian window of 50 s (Gau50) and Hamming window of 50 s (Ham50) for the CN vs. CI comparison.
Static functional connectivity (SFC) as a complement to dynamic network analysis in APOE4 × Aβ subgroups (A) SFC differences between APOE4 + Aβ + and APOE4 − Aβ − groups under the Gau20 window (20 s Gaussian). Thicker edges reflect stable connectivity disruptions, which persist despite transient dynamic changes (e.g., Ham20 window DFC). This highlights SFC’role in capturing long-term network damage from combined APOE4 and Aβ risk factors. (B) SFC differences between APOE4 + Aβ + and APOE4 − Aβ + groups under the Gau20 window. Static connectivity patterns here contrast with dynamic reverse regulation (e.g., Ham20 DFC), suggesting APOE4 × Aβ interactions modulate both stable and transient network states. (C) SFC differences between APOE4 − Aβ + and APOE4 − Aβ − groups under the Gau30 window (30 s Gaussian). Subtle static changes in APOE4-deficient subgroups align with dynamic instability (e.g., Ham30 DFC), supporting Aβ’s independent impact on both static and dynamic networks. Subnetworks include 7 gray-matter networks (e.g., Default Mode) and 12 white-matter tracts (WM01–WM12). SFC = Static Functional Connectivity; DFC = Dynamic Functional Connectivity; Gau20/30 = 20/30 s Gaussian windows.
Materials and methods
2
Participants
2.1
Data used in the preparation of this article were obtained from the Alzheimer’s disease Neuroimaging Initiative (ADNI) database (adni.loni.usc.edu). The ADNI was launched in 2003 as a public-private partnership, led by Principal Investigator Michael W. Weiner, MD. The primary goal of ADNI has been to test whether serial MRI, positron emission tomography, other biological markers, and clinical and neuropsychological assessment can be combined to measure the progression of MCI and early AD. This study utilized neuroimaging and clinical data from the Alzheimer’s disease Neuroimaging Initiative phases ADNI-2 and ADNI-3, with cohort partitioning based on fMRI temporal acquisition protocols. The combined sample comprised 1,415 participants: 562 from ADNI-2 (139 cognitive normal [CN], 47 SMC, 376 cognitive impairment [MCI/AD]) and 853 from ADNI-3 (440 CN, 91 SMC, 322 cognitive impairment). Inclusion criteria required: (1) complete T1-MRI and resting-state fMRI scans (ADNI-3 subjects had synchronized multimodal imaging); (2) APOE genotype and CSF Aβ42 data (for Aβ + classification: Aβ42 < 980 pg./mL); (3) stringent motion control (framewise displacement <0.5 mm). Diagnostic categorization followed ADNI criteria: CN (CDR = 0, MMSE ≥ 26, no cognitive deficits), SMC (self-reported memory decline >6 months with intact neuropsychological scores), MCI (CDR = 0.5, objective memory impairment >1.5 SD), and AD (CDR ≥ 1, MMSE < 24, NIA-AA criteria). The APOE4+/Aβ + subgroup required ε4 allele positivity and biomarker-confirmed amyloid pathology (Centiloid > 20). Ethical approval for all studies was obtained from the respective institutional review committees, and written informed consent was obtained from each participant.
fMRI imaging scanning and preprocessing
2.2
Structural and functional MRI data were preprocessed using the standardized pipeline implemented in DPARSF.1 Initial fMRI volumes (n = 10) were discarded to ensure magnetization equilibrium, followed by slice-timing correction and rigid-body motion realignment. Participants demonstrating excessive head movement (>3.0 mm translation or >3.0° rotation across any axis) were systematically excluded. Functional images were co-registered to individual T1-weighted anatomical scans and normalized to MNI space (3 × 3 × 3 mm^3^ isotropic resolution). Subsequent preprocessing included: (1) nuisance regression (24-parameter motion profiles, white matter/CSF signals) to mitigate physiological artifacts; (2) temporal bandpass filtering (0.01–0.08 Hz) for low-frequency drift removal; and (3) spatial smoothing (6 mm FWHM Gaussian kernel). Given the multi-site nature of ADNI-2/3 data, we addressed inherent heterogeneity arising from inter-scanner variability, acquisition parameter differences, and demographic confounders (age/gender distribution) through ComBat harmonization. This empirical Bayes framework, originally developed for genomic data integration, effectively removes site-specific technical biases while preserving biological variance, as demonstrated in recent neuroimaging applications (Fortin et al., 2018). Full acquisition parameter specifications across scanners are provided in online website.2
Dynamic brain network construction
2.3
This study constructs dynamic gray-white matter functional connectivity networks based on fMRI data, integrating gray matter and white matter information to investigate the dynamic interactions within the brain. The detailed process is as follows:
Node definition
2.3.1
Cortical gray matter nodes were defined using the Schaefer 200 atlas (Schaefer et al., 2018), partitioning the cerebral cortex into 200 functionally homogeneous regions reorganized into seven subnetworks: default mode, visual, somatomotor, limbic, frontoparietal control, dorsal attention, and salience/ventral attention. These include AD-susceptible regions like the posterior cingulate cortex and medial prefrontal cortex. For white matter, a data-driven clustering approach (Peer et al., 2017) was applied: a group-averaged white matter mask was created, and K-means clustering (2–22 clusters) identified 128 white matter regions across 12 functional networks, validated via four subsets with a Dice coefficient >0.85.
Functional network construction
2.3.2
Average blood oxygen level-dependent (BOLD) signals were extracted from gray/white matter regions, and Pearson correlations were computed for all node pairs (gray-gray, white-white, gray-white) to construct 200 × 200 gray matter, 128 × 128 white matter, and 328 × 328 gray-white matter functional connectivity matrices.
DFC network construction
2.3.3
To comprehensively assess the dynamic changes in brain functional networks, we employed a sliding window approach to construct DFC networks, quantifying the functional connections between gray matter, white matter, and gray-white matter regions.
Sliding window selection: 20, 30, and 50 TR windows (1 TR step, 98% overlap) were tested. The optimal 30 TR window balanced dynamic sensitivity and noise control, with permutation tests correcting autocorrelation.Window function selection: Hamming (reducing edge effects) and Gaussian (noise resistance) windows were used to comprehensively evaluate connectivity dynamics.Dynamic functional connectivity quantification:
For each sliding window, Pearson correlation coefficients were calculated between the time series of gray and white matter nodes. The formula is:
where and are the BOLD signals of two nodes, and and are their respective means.
- Fisher z-transformation: To normalize the distribution of correlation coefficients for accurate statistical comparisons, Fisher’s -to-z transformation was applied:
where denotes the correlation coefficient between node x and node y, denotes the transformed z-score.
- Dynamic variability metric: The dynamic variability of functional connectivity was quantified by calculating the standard deviation (SD) of the z-transformed correlation values across all windows:
This metric reflects the amplitude of connectivity strength fluctuations over time.
Machine learning analysis
2.4
To develop a robust classification model for distinguishing between different cognitive stages (CN, SMC, and CI) using DFC metrics, we employed a comprehensive machine learning pipeline with Support Vector Machine (SVM) as the classification model. The detailed analysis pipeline is described as follows:
Feature extraction
2.4.1
Dynamic connectivity metrics
2.4.1.1
We extracted dynamic connectivity metrics from the sliding-window analysis of the gray-white matter functional networks. These metrics included the standard deviation of Fisher z-transformed correlation values across all windows, reflecting the temporal variability of functional connections. This process generated a comprehensive set of features representing the dynamic interactions between gray matter and white matter regions.
Feature set size
2.4.1.2
The initial feature set included over 21,000 dynamic connectivity metrics derived from the 328 × 328 gray-white matter network. Each feature represented the dynamic variability of a specific functional connection between two nodes (gray-gray, white-white, and gray-white).
Feature selection
2.4.2
LASSO regularization
2.4.2.1
To identify the most relevant features for classification and reduce dimensionality, we applied LASSO (Least Absolute Shrinkage and Selection Operator) regression. LASSO helped in selecting a subset of features that contributed most significantly to the classification performance while minimizing overfitting. The optimal regularization parameter was determined through cross-validation. Ultimately, LASSO selected 1,200 features that were most relevant for distinguishing between the different cognitive stages.
Clinical relevance validation of selected features
2.4.3
To ensure the biological and clinical interpretability of the selected features, Pearson correlation analyses were performed between dynamic connectivity metrics (e.g., VAN-WM2 Gau20 std) and neuropsychological scales (MMSE, CDR-SB). This step aimed to assess whether the features aligned.
Model training and validation
2.4.4
Cross-validation
2.4.4.1
We employed 10-fold cross-validation to train and validate the SVM model, a robust approach to assess generalizability across the ADNI multi-cohort dataset (1,415 participants). The dataset was partitioned into 10 subsets, with 9 subsets used for training and 1 for validation in each iteration, ensuring each sample was validated once. This method minimized selection bias and provided reliable performance estimates, particularly for detecting subtle differences in the SMC stage.
Performance evaluation
2.4.5
Evaluation metrics
2.4.5.1
Model performance was quantified using accuracy, sensitivity, specificity, and AUC-ROC, with a focus on differentiating early (SMC) vs. late (CI) stages. For example, in Aβ + subgroups, the dynamic model achieved an AUC of 0.92 for SMC + vs. CI + discrimination (ΔAUC = 0.15 vs. static model, p < 0.001; Table 1), highlighting its sensitivity to early pathology.
Class imbalance handling
2.4.5.2
To address skewed class distributions (e.g., CI: SMC ratio ~8:1 in ADNI-2), SMOTE was applied to synthetically oversample minority classes during training. This improved the model’s ability to detect SMC cases, as evidenced by a 12% increase in F1 score for the SMC class (Supplementary Table S5). Confusion matrices confirmed balanced performance across CN/SMC/CI categories, with misclassification rates <15% in cross-validation.
Statistical analyses
2.5
In our study, one-way analysis of variance (ANOVA) was performed to analyze the demographic information, plasma biomarkers, and mean functional connectivity (FC) of subnetworks across different groups. To further explore differences between groups, Tukey’s multiple comparisons test was employed following the ANOVA. We applied two-sample t-tests to identify region of interest (ROI)-level FC pairs that exhibited differences between groups. The chi-square test was used to examine group differences for discrete variables, and the independent two-sample t-test was used to examine statistical differences between continuous variables. Significance level was set at p < 0.05. To establish the clinical relevance of identified dynamic connectivity features, Pearson correlation coefficients were calculated between dynamic metrics (e.g., standard deviation of Fisher z-transformed correlations for VAN-WM2, DMN-WM5, and other key connections across different window types) and clinical cognitive scales (MMSE, MoCA, and CDR-SB). A significance level of p < 0.05 was used, with Bonferroni correction applied to address multiple comparisons. These analyses were performed to evaluate whether temporal fluctuations in gray-white matter connectivity correlate with cognitive impairment severity. Receiver operating characteristic (ROC) curves were used to assess the ability to discriminate among different groups.
Results
3
Demographic and clinical characteristics
3.1
Table 2 summarizes the baseline characteristics of ADNI-2 and ADNI-3 cohorts. In ADNI-2, significant differences were observed between the SMC and CI groups in APOE ε4 allele frequency (34.0% vs. 56.7%, p < 0.001), Aβ positivity (29.8% vs. 21.5%, p = 0.032), MMSE scores (28.9 ± 1.1 vs. 25.7 ± 3.8, p < 0.001), and CDR-SB scores (0.21 ± 0.72 vs. 2.68 ± 2.18, p < 0.001). Similar trends were replicated in ADNI-3, with APOE ε4 prevalence (31.9% vs. 45.3%, p = 0.002) and MMSE scores (29.0 ± 1.2 vs. 25.9 ± 4.0, p < 0.001) differing significantly between SMC and CI groups. No significant age or gender differences were noted across cognitive stages (p > 0.05).
Stability and differential analysis of DFC and SFC across ADNI cohorts
3.2
Stability of functional connectivity (FC) networks across ADNI cohorts is presented in Supplementary Table S2. For cognitively normal (CN) groups, similarity coefficients of SFC were 0.769 (ADNI2 internal), 0.769 (ADNI3 internal), and 0.777 (ADNI2 vs. ADNI3). In subjective memory concern (SMC) groups, SFC coefficients ranged from 0.783–0.785. DFC showed higher consistency than SFC across all window types (Hamming/Gaussian, 20–50 TRs), with similarity coefficients spanning 0.862–0.933. The lowest DFC coefficient was 0.862 (Ham50, ADNI2 CN), while the highest was 0.933 (Gau20, ADNI2 vs. ADNI3 SMC), indicating stronger cross-cohort stability for short-window dynamic metrics.
Supplementary Table S3 and Table 3 (main text) show group-wise FC differences. In ADNI2 Site 3, SMC vs. CN revealed 30 differential DFC connections (Ham20) in ventral attention networks and white matter subnetworks (WM2/WM5), whereas CN vs. CI had 54 SFC connections in default mode and visual networks. In ADNI3 Site 1, CN vs. CI exhibited 118 SFC connections—significantly more than SMC vs. CN (2 connections)—reflecting progressive static network degradation in late stages.
Subgroup analyses (Supplementary Table S4; Table 4) showed that within Aβ + groups, APOE4 + carriers had 70 differential DFC connections (Gau20) compared to 34 in APOE4– carriers. The APOE4 + Aβ + vs. APOE4–Aβ– comparison revealed 136 SFC connections in default mode and limbic networks, indicating synergistic genetic-pathological effects. Additionally, Table 5 further analyzes the independent impact of APOE4 in Aβ + and Aβ- populations. Results show that within the Aβ + group, the number of SFC differential connections between APOE4 + and APOE4- was 82 pairs, and the number of DFC (such as Gau20) differential connections was 70 pairs. In the Aβ- group, the number of SFC and DFC differential connections between APOE4 + and APOE4- decreased significantly (70 pairs and 18 pairs, respectively). This suggests that the effect of APOE4 on brain networks is more pronounced in the context of Aβ positivity, possibly through accelerating amyloid-β deposition or independent neurodegenerative mechanisms, such as myelin maintenance abnormalities (Table 6).
Supplementary Figure S1 (chord diagrams) visualized that short-window DFC (e.g., Gau20) detected early-stage differences in ventral attention and WM2/WM5, while long-window DFC (e.g., Ham50) and SFC highlighted late-stage alterations in default mode and visual networks.
Classification performance of cross-validated models across ADNI cohorts and subgroups
3.3
Prior to presenting cross-validation results, the selection of SVM kernel functions was guided by Supplementary Table S6. The Gaussian radial basis function (RBF) kernel achieved the highest classification accuracy (76.7% ± 5.95%) for differentiating SMC from CN across ADNI2 and ADNI3 cohorts, outperforming linear (70.19% ± 7.58%), polynomial (69.06% ± 7.38%), and sigmoid (68.33% ± 8.13%) kernels. This superiority motivated its use in subsequent analyses.
Classification results for full cohorts are summarized in Table 7. The dynamic graph theory model with RBF-SVM achieved the highest accuracy: 76.7% ± 5.95% (ADNI2) and 72.73% ± 5.86% (ADNI3), significantly surpassing static graph theory, traditional metrics, and clinical models (all p < 0.001).
For Aβ and APOE ε4 subgroups (Table 1), the dynamic model achieved 83.63% ± 4.02% accuracy in Aβ + individuals and 85.16% ± 3.96% in APOE ε4 + subgroups. Notably, it showed a 0.15 AUC improvement in distinguishing SMC + from CI + within Aβ + subgroups, highlighting sensitivity to early pathology.
Figure 5 presents scatter plots of correlations between the salient dynamic connectivity feature VAN-WM2 (Gau20 std) and clinical cognitive scales (MMSE, MoCA, CDRSB). The feature demonstrated significant positive correlations with MMSE (r = 0.40, p = 4.44 × 10^−12^) and MoCA (r = 0.39, p = 7.23 × 10^−11^), and a negative correlation with CDRSB (r = −0.41, p = 8.79 × 10^−13^), indicating that reduced dynamic connectivity in this white matter–gray matter interface is associated with worse cognitive performance (Figures 6, 7).
Scatter plots of correlations between salient dynamic connectivity features (VAN - WM2) and clinical cognitive scales (MMSE, MoCA, CDRSB). VAN - WM2 stands for Voxel - wise Alteration of Network - White Matter 2; MMSE for Mini - Mental State Examination; MoCA for Montreal Cognitive Assessment; CDRSB for Clinical Dementia Rating Scale - Sum of Boxes.
The receiver operating characteristic (ROC) curves of five models evaluated on ADNI - 3 (A) and ADNI - 2 (B) datasets. The five models include the fMRI dynamic graph theory model, fMRI static graph theory model, fMRI traditional metric ReHo model, fMRI traditional metric ALFF model, and clinical model.
ROC curves of five models evaluated on Aβ subgroup (A) and APOE E4 gene subgroup (B) datasets. The five models include the fMRI dynamic graph theory model, fMRI static graph theory model, fMRI traditional metric ReHo model, fMRI traditional metric ALFF model, and clinical model.
Discussion
4
Implications of demographic and clinical characteristics
4.1
The significant differences in APOE ε4 allele frequency and Aβ positivity between SMC and CI groups in both ADNI-2 and ADNI-3 cohorts (Table 2) confirm APOE ε4 as a major genetic risk factor for Alzheimer’s disease (AD) and highlight the association between Aβ pathology and cognitive decline. APOE ε4 carriers are more susceptible to Aβ deposition and synaptic damage, which accelerates the transition from subjective memory complaints to clinical cognitive impairment. The progressive decline in MMSE and CDR-SB scores suggests that the SMC stage already involves potential neurofunctional degradation, supporting the necessity of using DFC as an early monitoring indicator.
Stage-dependent features of DFC and SFC
4.2
DFC demonstrated superior cross-cohort stability compared to SFC (Supplementary Table S2), especially for short-window DFC (e.g., 20 TRs), with high similarity coefficients (0.862–0.933) indicating the conservation of neural dynamic fluctuations across different scanning conditions. Early-stage differences in DFC (30 connections in ventral attention and white matter networks) were observed before changes in SFC, suggesting that synaptic transmission efficiency or local field potential abnormalities may be among the earliest functional impairments in AD. In contrast, the marked increase in SFC differences in the late CI stage (118 connections involving the default mode network) aligns with neurodegenerative processes leading to brain network disintegration, confirming the hypothesis that “static connectivity reflects cumulative structural damage.
Interactions between genetics and pathology
4.3
The synergistic effect of APOE ε4 and Aβ was particularly evident in static connectivity, with 136 SFC differences in the default mode and limbic networks for APOE4 + Aβ + groups (Table 4; Supplementary Table S4), likely due to APOE4 promoting Aβ aggregation and neuroinflammation. Notably, APOE4 independently affected DFC in Aβ-negative individuals (70 connections in WM4/WM5), suggesting APOE4’s role in white matter dynamic stability through pathways unrelated to amyloid, such as myelin maintenance or axonal transport deficits, findings that align with Carrasco-Gómez et al. (2025). Further combining the results of Table 5, the network perturbation of APOE4 in the Aβ + population was significantly stronger than that in the Aβ- population (for example, the number of DFC differential connections between APOE4 + and APOE4- in the Aβ + group was 3.9 times that in the Aβ- group). This supports the hypothesis that “APOE4 mainly accelerates AD progression by enhancing the pathological effect of Aβ.” At the same time, the independent effect of APOE4 in the Aβ- group (such as 18 DFC differential connections) suggests that it may pre - disrupt the dynamic balance of brain networks through other pathways (such as lipid metabolism abnormalities), providing imaging evidence for “APOE4 being an independent risk factor for AD.
Clinical translation value of machine learning models
4.4
The high accuracy of the RBF-SVM model in distinguishing SMC from CN (76.7% ± 5.95%) is attributed to its ability to capture non-linear features of multi-window DFC. In Aβ + and APOE ε4 + subgroups, the model’s accuracy further increased to over 83%, with a 0.15 AUC improvement in early pathological conversion, indicating that DFC can serve as a biomarker for genetic-pathological stratification. The strong correlation between the VAN-WM2 dynamic connectivity feature and cognitive scales directly links functional network abnormalities to clinical phenotypes, providing a basis for interventions targeting the ventral attention-white matter interaction network in Figure 5.
Limitations and future directions
4.5
This study is based on cross-sectional data and requires longitudinal follow-up to validate the predictive value of DFC changes. Although cross-cohort scanning protocol differences were standardized, residual technical biases may still exist. Future research could integrate PET imaging (e.g., tau distribution) and single-cell sequencing to further elucidate the molecular and cellular mechanisms underlying DFC abnormalities, promoting its application in early AD diagnosis and treatment monitoring.
Conclusion
5
Dynamic functional connectivity (especially short-window DFC) can sensitively capture early functional abnormalities in gray-white matter networks in AD, with better stability and genetic-pathological associations than static indicators. The classification model combining machine learning provides a new paradigm for precise stratification and early intervention in AD, potentially becoming a core biomarker linking molecular pathology with clinical phenotype.
The reference list from the paper itself. Each links out to its DOI / PubMed record.
- 1Ali D. G.Bahrani A. A.El Khouli R. H.Gold B. T.Jiang Y.Zachariou V.. (2023). White matter hyperintensities influence distal cortical. Imaging Neurosci. 3:13. doi: 10.1002/brb 3.3209 PMC 1057048837534614 · doi ↗ · pubmed ↗
- 2Amariglio R. E.Becker J. A.Carmasin J.Wadsworth L. P.Lorius N.Sullivan C.. (2012). Subjective cognitive complaints and amyloid burden in cognitively normal older individuals. Neuropsychologia 50, 2880–2886. doi: 10.1016/j.neuropsychologia.2012.08.011, PMID: 22940426 PMC 3473106 · doi ↗ · pubmed ↗
- 3Brier M. R.Thomas J. B.Snyder A. Z.. (2012). Loss of intranetwork and internetwork resting state functional connections with Alzheimer\u 0027 s disease progression. J Neurosci., 32, 8890–8899. doi: 10.1523/JNEUROSCI.5698-1122745490 PMC 3458508 · doi ↗ · pubmed ↗
- 4Carrasco-Gómez M.García-Colomo A.Nebreda A.Bruña R.Santos A.MaestúF. (2024). Dynamic functional connectivity is modulated by the amount of p-Tau 231 in blood in cognitively intact participants. bio Rxiv 2024:323. doi: 10.1101/2024.05.29.59632340446587 · doi ↗ · pubmed ↗
- 5Castellano J. M.Kim J.Stewart F. R.Jiang H.De Mattos R. B.Patterson B. W.. (2011). Human apo E isoforms differentially regulate brain amyloid-β peptide clearance. Sci. Transl. Med. 3:89ra 57. doi: 10.1126/scitranslmed.3002156, PMID: 21715678 PMC 3192364 · doi ↗ · pubmed ↗
- 6Chen Q.Lu J.Zhang X.Sun Y.Chen W.Li X.. (2021). Alterations in dynamic functional connectivity in individuals with subjective cognitive decline. Front. Aging Neurosci. 13:646017. doi: 10.3389/fnagi.2021.646017, PMID: 33613274 PMC 7886811 · doi ↗ · pubmed ↗
- 7Choe Y. M.Byun M. S.Lee J. H.Sohn B. K.Lee D. Y.Kim J. W. (2018). Subjective memory complaint as a useful tool for the early detection of Alzheimer’s disease. Neuropsychiatr. Dis. Treat. 14, 2451–2460. doi: 10.2147/NDT.S 174517, PMID: 30288043 PMC 6161713 · doi ↗ · pubmed ↗
- 8Córdova-Palomera A. (2017). Disrupted global metastability and static and dynamic brain connectivity across individuals in the Alzheimer’s disease continuum. Sci. Rep. 7:268. doi: 10.1038/srep 40268, PMID: 28074926 PMC 5225495 · doi ↗ · pubmed ↗