Establishment of Coala: a novel 3D and 2D cancer cell line derived from colorectal cancer liver metastasis
Sandra Mersakova, Juraj Marcinek, Dusan Brany, Olga Chodelkova, Martin Vorcak, Martin Cermak, Martina Poturnajova, Zuzana Kozovska, Henrieta Skovierova, Slavomira Novakova, Barbora Mitruskova, Dusan Loderer, Marian Grendar, Veronika Holubekova, Andrea Hornakova, Jana Melegova

TL;DR
Researchers developed a new 2D and 3D cancer cell line called Coala from colorectal cancer liver metastasis to improve cancer research models.
Contribution
The novel Coala cell line is derived from liver metastasis and can be cultured in both 2D and 3D formats.
Findings
Coala forms tumors in mice with features similar to the original tumor and expresses CDX2, SATB2, and CK20.
Whole exome sequencing revealed pathogenic mutations in genes like C8B, PRKCQ, APC, and TP53.
Coala expresses proteins Snail, Pdx-1, FoxA2, and E-cadherin, verified by antibody array chip analysis.
Abstract
Metastatic colorectal cancer is one of the most critical causes of cancer-related dead in patients suffering this type of malignancy. As the liver metastases are found in almost 25–50% of all colorectal cancer patients, there is an urgent need for suitable in vitro and in vivo models. To the best of our knowledge, only a limited number of well-described 2D or 3D organoid/spheroid cell lines originated from human liver metastases was reported for this type of malignancy and submitted to ATCC and other repository centers for general use. Here, we present a novel, well-characterized cell line Coala that was derived directly from liver metastasis of patient with colorectal cancer. Coala cancer cell line was derived by 2D and 3D culture technology and can be, therefore, cultured as standard 2D cell line or as 3D spheroid culture. When transplanted into athymic mice, Coala cell line forms…
Genes, proteins, chemicals, diseases, species, mutations and cell lines named across the full text — each resolved to its canonical identifier and authoritative record.
Click any figure to enlarge with its caption.
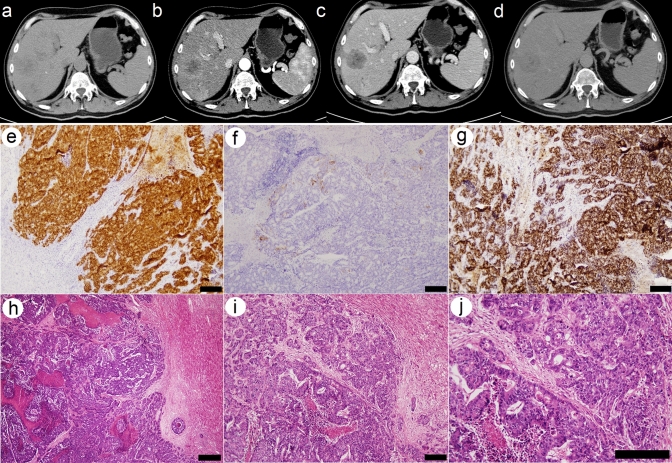 Figure 1
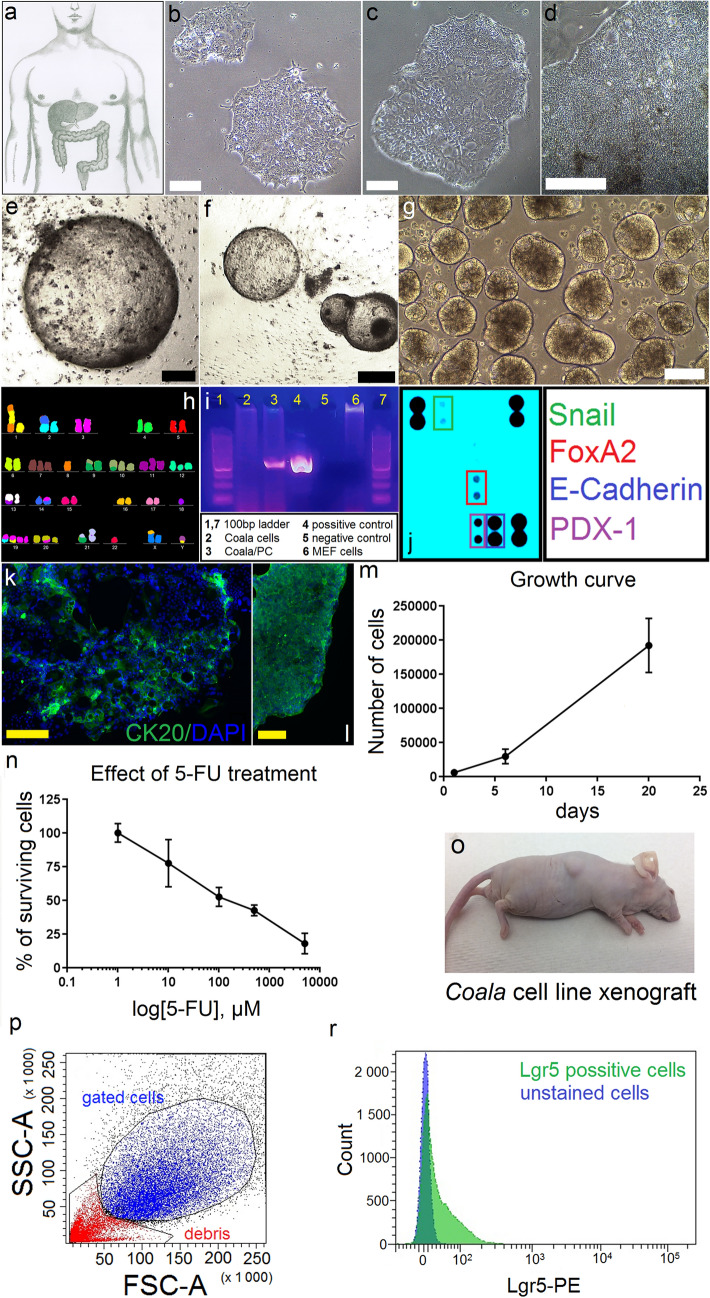 Figure 2
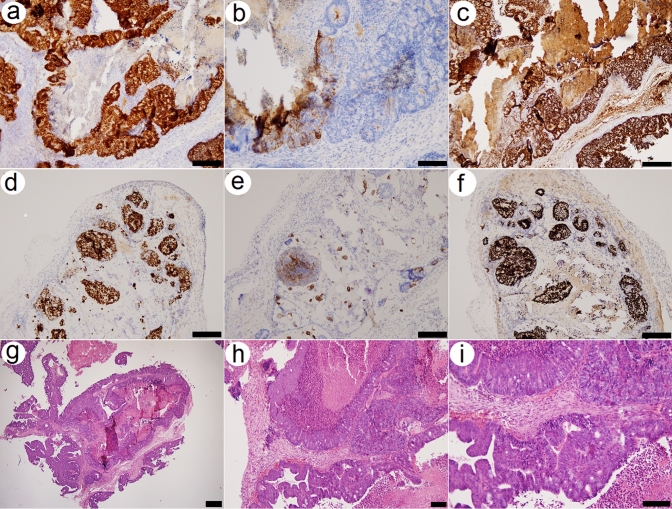 Figure 3
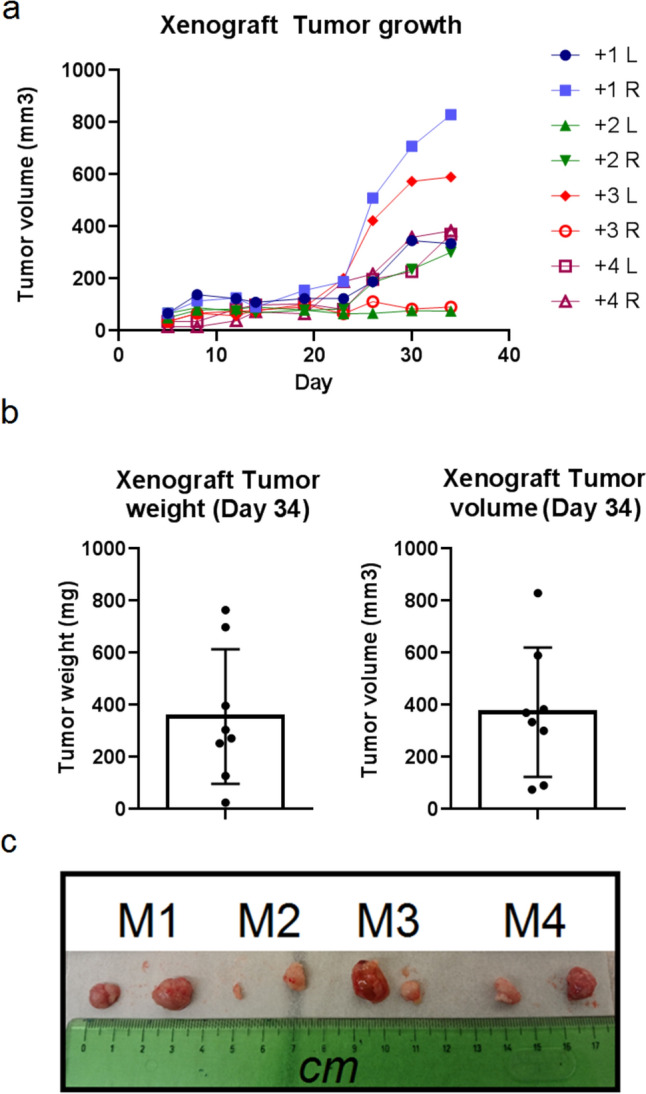 Figure 4
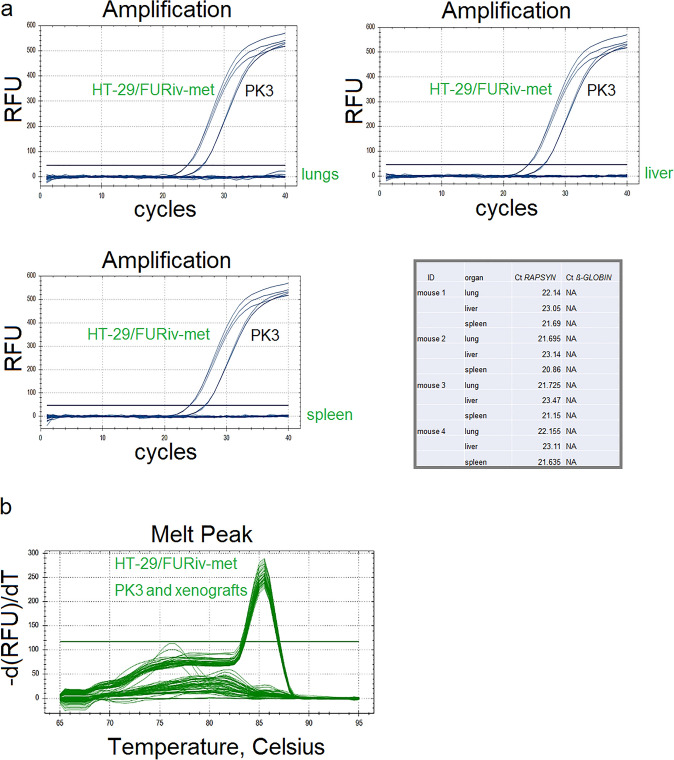 Figure 5
- —http://dx.doi.org/10.13039/501100005357Agentúra na Podporu Výskumu a Vývoja
- —http://dx.doi.org/10.13039/501100008530European Regional Development Fund
- —Next Generation EU
- —European Regional Development Fund.
- —http://dx.doi.org/10.13039/501100003194Agentúra Ministerstva Školstva, Vedy, Výskumu a Športu SR
- —Comenius University in Bratislava
Peer Reviews
No public reviews on file for this paper yet. If you reviewed it on a platform where reviews are public (OpenReview, ICLR, NeurIPS, ICML), you can paste yours below so the community can read it here.
Videos
No videos yet. Explain this paper in a talk, walkthrough, or lecture? Add one.
Taxonomy
TopicsCancer Cells and Metastasis · Cancer Research and Treatments · Cancer Genomics and Diagnostics
Background
According to WCRFI (World Cancer Research Fund International), colorectal cancer is the 3rd most common cancer worldwide [1]. In 2020, more than 1.9 million new cases were detected. In some countries, the incidence of colorectal cancer has increased over the last decades [2]. Although colorectal cancer is relatively easy to be detected as the symptoms are quite obvious, this type of cancer still kills thousands of patients every year. It is predicted that only in USA; more than 52,900 people will die this year from colorectal cancer [3], mainly from the metastatic spread of primary tumor to surrounding tissues and to distant organs. The most common organ of distant metastasis for colorectal cancer is liver. The character of venous supply to the liver together with immune-tolerance environment of the liver can be one of the explanations of the frequency of colorectal cancer metastasis to this organ [4]. Liver-specific metastasis of colorectal cancer cells can also be explained by their expression of some chemokines and by responding of colorectal cancer cell-expressed receptors to specific homing signals from liver (CXCL12). Metastatic organotropism and the escape of cancer cells from primary tumor site to the metastatic site are also connected with process of epithelial-mesenchymal transition (EMT) [5].
A quite limited number of well characterized metastatic colorectal cancer-derived cell lines are currently available for researchers (Table 1). Moreover, the cancer cell lines that are capable of growing as organoid/spheroid culture are preferred as according to studies they capture the heterogeneity and genetic features of the original tumors. These cell lines are also considered to be better models for predicting treatment responses [6–8]. Therefore, there is an urgent need for novel in vitro and in vivo models for this cancer [9, 10]. Here, we report the establishment and characterization of a novel cancer cell line derived from liver metastasis of patient with colorectal cancer. The cell line was derived with optimized protocol published previously by our group [11]. Coala cells showed aggressive phenotype in vivo when xenografted into athymic nude mice; in vitro Coala cells form tumorspheres and show the membrane expression of several typical CD markers. When compared, Coala cells share three pathological mutations with the original liver metastasis.Table 1. The summary of organoid culture and 2D colorectal cancer cell lines in repository centersATCC—American Type Culture CollectionColon cancer cell models derived from metastatic colon cancerAll cell models are organoids derived from primary patient samplesThese cell models are patient-derived next-generation cancer model generated by the Human Cancer Models Initiative (HCMI)No.Cell model nameATCC no.Cell model1.HCM-SANG-0265-C18PDM-42Organoids derived from primary patient samples2.HCM-CSHL-0736-C18PDM-425Organoids derived from primary patient samples3.HCM-CSHL-0726-C18PDM-419Organoids derived from primary patient samples4.HCM-CSHL-0653-C18PDM-410Organoids derived from primary patient samples5.HCM-CSHL-0603-C18PDM-372Organoids derived from primary patient samplesLeibniz Institute DSMZ—Deutsche Sammlung von Mikroorganismen und ZellkulturenColon cancer cell models derived from liver metastasisAll cell models are patient-derived 2D cell linesNo.Cell model name:DSMZ no.Cell model1.JVE103ACC 8072D cell line2.JVE114ACC 8122D cell line3.JVE187ACC 8182D cell line4.JVE253ACC 8232D cell line5.JVE371ACC 8252D cell lineRIKEN—Bioresource Research Center, JapanJCRB—Japanese Collection of Research Bioresources Cell BankNo colon cancer cell models derived from liver metastasis
Materials and methods
Clinical case
A 68-year-old man underwent (in 2020) an extensive right-sided hepatectomy due to presence of metastases (after previous sigmoid colectomy, performed in 2013) for clinical stage I colorectal adenocarcinoma (grade G3, L1, V1, B0, Pn1). Chemotherapy treatment was based on intravenous infusion of combination of irinotecan, oxaliplatin, calcium folinat and 5-fluorouracil (FOLFOXIRI). Patient signed informed consent letter, previously approved by the Ethical Review Committee of Jessenius Faculty of Medicine in Martin and donated residual tumor tissue for research. The postoperative course was without complications, the patient was discharged from hospital (University Hospital Martin, Slovakia) in good condition.
Establishment of new cancer cell line
Piece of viable tumor tissue (residual part from histological examination) was transferred from Department of Pathological Anatomy, in ice-cold culture medium (DMEM/F12 containing 10% FBS and 1% P/S) into the lab. Tumor was then processed in accordance with the protocol, published previously by our group [11]. Briefly, single-cell suspension was prepared from tumor tissue with collagenase IV and washed twice with PBS. The cells were then plated into Petri dishes and observed daily for epithelial cell-colony formation. When colonies were detected and expanded, they were embedded into Matrigel matrix and plated into ultra-low attachment 6-well plates (Corning, USA) as described [11]. Coala cell line was also shown to be able to grow in 3D culture conditions in form of Matrigel matrix-free floating spheroids. When placed back into standard, tissue culture-treated polystyrene plates, Coala cells continued to grow in form of 2-dimensional, sharp-edged colonies.
Histological analysis (histology)
For histological analysis, tumor extracted from patient, or tumor tissue from human cancer cell-xenograft were fixed in 10% paraformaldehyde (Cell Signaling, USA) for 72 h and then processed with standard procedures (graded ethanol dehydration followed with paraffin embedding of tissue). Five-micron-thick sections from paraffin blocks were used for the bright-field microscopy examination of tissue specimens. The list of antibodies, used for staining, is indicated in Supplementary Fig. 2*.*
STR analysis (DNA fingerprinting)
Coala cancer cell line was tested for the originality and possible contamination with other cells with ATCC Human Cell STR profiling service. The original tumor cells, isolated from the fresh tumor tissue were also included for the analysis to prove the same origin of tumor tissue sample and Coala cell line.
Mycoplasma testing
Commercial PCR Mycoplasma test kit (ATCC, USA) was used for detection of possible mycoplasma infection of Coala cells. Briefly, the cells were grown in the dish and processed at desired confluency as recommended by manufacturer. Standard PCR (with the detection of DNA on 2% agarose gel) was run for the detection of more than 60 species of mycoplasma, acholeplasma, spiroplasma, and ureaplasma. As a negative control, sample from commercially available cell line (mouse embryonic fibroblasts, and millipore) was included in the test. Negative PCR control was also included. Positive control from the ATCC kit and positive control mixed with sample from Coala cells were also added to the run.
Karyotype analysis and FISH
The chromosomes derived from cultured Coala cells were analyzed by standard cytogenetic G-banding method. This analysis revealed various numerical and structural aberrations including deletions and translocations. A specification of involved chromosomes was beyond the limits of standard cytogenetic G-banding procedure (Supplemental Fig. 1). For this reason, the multicolor FISH method (M-FISH with 24Xcyte Human Multicolor FISH probe (MetaSystems, Germany) was used. Fluorescent microscope Olympus BX51 (Olympus Optical, Japan) and ISIS imaging system (MetaSystems, Germany) were used for imaging.Fig. 1CT (computed tomography) scans of the liver in a patient with MTS involvement in primary CA of the sigmoid colon. CT shows multiple foci of the right lobe of the liver (depicted lesion in S8)—mildly hypodense non-enhanced scan (a), contrast enhanced scan at the arterial phase with peripheral hyper density (b), hypodense at the portal (c) and delayed phase (d). Image e shows positive staining for CDX2 homeobox protein in liver metastasis and f shows Cytokeratin 20 staining. Positive staining for SATB2 (Special AT-rich sequence-binding protein 2) is shown in image g. Hematoxylin/eosin staining (h–j) of metastatic tumor tissue in liver is also shown in this figure. Scale bar represents 50 µm
Flow cytometry analysis of surface markers
For surface marker screening, the standard flow cytometry with FACS Aria II cytometer (BD Biosciences, USA) for verification of Lgr5 and selected CD markers was used. We also used multiplex flow cytometry (designed for screening majority of CD markers). MACS Marker Screen (MiltenyiBiotech, Germany) plate kit and MACSQuant Instrument allowed screening of 376 human surface CD markers on newly derived Coala cancer cell line. The cells were prepared in accordance with manufacturer´s instructions and analyzed with MACSQuant instrument (MiltenyiBiotech, Germany), using the 640 nm and 488 nm lasers. Gating was used to exclude dead cells and debris from the analyses (Fig. 2p).Fig. 2. Characterization of newly-derived Coala cancer cell line. Cell line was derived from human colorectal cancer liver metastasis (a), forms sharply-edged, fast growing colonies in 2D (b–d), when embedded into Matrigel matrix, the cell line form spherically-shaped tumorspheres (e, f). Image g shows the phenotype of tumorspheres, when Coala cells are cultured in ultra-low attachment plates. Scale bars represent 50 µm (b–d and k, l) and 500 µm (e–g). Multicolor (M-FISH) analysis of Coala cells showing the abnormal karyotype (h). Negative PCR test (detection of multiple mycoplasma species) in Coala cell culture (i). Antibody array chip analysis shows the expression of Snail, FoxA2, E-Cadherin and Pdx-1 in Coala cell lysate. Cultured Coala cells show positivity for Cytokeratin 20 (DAPI was used for nuclei staining), scale bar represents 50 µm. Growth curve for Coala cells (m) and effect of 5-Fluorouracil treatment (n). Image (o) showing a tumor formed in athymic mouse 3 weeks after subcutaneous grafting of Coala cells. Images (p) and (r) show flow cytometry analysis of Lgr5 marker in early passage (P3) of Coala cells. Cells from passage No.21 were used in experiments
Xenotransplantation of human cancer cells
The in vivo ability of Coala cancer cells to form tumors, histologically similar to original human tumors was tested with xenotransplantation of cells into 7-week-old Crl:NU(NCr)-Foxn1nu athymic (nude) mice (The Jackson Laboratory, USA). Briefly, the mixture of cells (2 × 10^6^ cells/injection) and 30% Matrigel (Corning, USA) diluted in ice-cold PBS (200 µL, pH 7.4) was injected subcutaneously (into the right flank) with insulin syringe (precooled in ice-cold PBS). Animals (n = 3) were then periodically checked for tumor formation. Palpable tumors (Fig. 2o) were detected approx. 3 weeks after injection of cells. Before tumor extraction, the animals were euthanized by cervical dislocation. Tumor tissue was fixed in 10% paraformaldehyde and processed as described previously [12]. Immunohistology proved the similarity of tumor xenograft with original tumor (Fig. 3a–i). The animal experiments were approved by Ethical Review Committee of Jessenius Faculty of Medicine in Martin, Comenius University in Bratislava, and The State Veterinary and Food Administration of the Slovak Republic (Approval No. 4987-3/2022-220).Fig. 3. Immunohistology of Coala cancer cell line xenograft shows positive staining for CDX2 (a, d), Cytokeratin 20 (b, e) and SATB2 (c, f). Images (f–h) show hematoxylin/eosin staining of human Coala cancer cell line-derived xenograft tissue, isolated from athymic mice. Cells from passage No.21 were used in the analysis. Scale bar represents 50 µm
Next generation sequencing
For primary human tumor mutation analysis, the TruSight™ Oncology 500 (Illumina, USA) targeted, hybrid-capture based next-generation sequencing assay was used to analyze 523 genes (assessing all DNA and RNA variants types) for mutations. Sample preparation was in accordance with manufacturer’s instructions. Data analyses were performed in RUO mode of NextSeq 550DX instrument (from the same company), using the TSO500v2.0.0 Local App. Analysis (customized) pipeline from Clin. Genomics Workspace software from Pierian Dx was adapted in this project.
Whole exome sequencing
To identify the genetic variants (altering the protein sequences), whole exome sequencing (WES) experiment was performed on DNA sample, extracted from cultured Coala cells for sequencing the protein-coding regions. Kapa HyperPlus Kit, HyperCap Target Enrichment Kit, HyperCap bead Kit and HyperExome Probes were used for sample preparation and exonic DNA sequencing. The samples were then analyzed with Illumina HiSeq (Illumina, USA) instrument.
Immunocytochemistry
Immunocytochemical analyses of selected proteins were performed with Coala cells, grown on plastic microscopy chambers (Ibidi, USA). Cells were fixed in 4% paraformaldehyde (Cell Signaling, USA) and processed as described previously [12]. Olympus IX71 fluorescent microscope (Olympus, Japan) and ImageJ software was used for image processing and figure preparation.
Antibody array
Expression of 19 transcription factors was detected with Stem Cell Antibody Array (RD Systems, UK). The Coala cells were processed according to manufacturer´s recommendation and chemiluminescence detected with Blue X-ray photosensitive film (Kodak, USA). Scanned images were then analyzed with ImageJ software.
Doubling time
Briefly, the cell number was calculated with Biorad T20 cell counter and cells were seeded on Petri dishes and cultured for 20 days. Doubling time of Coala cancer cells was estimated to be around 2,5 day as calculated with doubling time calculation formula (doubling time = [t × (ln2)]/ [ln(N20/N0)].
Sensitivity of Coala cancer cell line to 5-fluorouracil
The sensitivity of Coala cancer cell line to 5-fluorouracil was evaluated by cell viability assay. Cells were plated on the six well plates and exposed to different concentrations of 5-fluorouracil (range from 0.1 to 10,000 µM of 5-fluorouracil). Percentage of surviving cells was counted and plotted on y-axis. Data are presented as means ± standard error of the mean (SEM) of quadruplicate analyses.
Pyrosequencing analysis
Coala cell line sample treated with sodium bisulfite also underwent pyrosequencing analysis for four selected genes. During the PCR reaction, cytosine residues were converted to uracil or thymine in the final PCR product, while methylated cytosines remained unchanged. We focused on identification of methylated regions within the sequences of four genes: CDKN2A, PROM1, MGMT, and ADAMTS16. As a control, completely methylated and completely unmethylated DNA was used. We analyzed 7CpGs for MGMT, 6CpGs for CDKN2A, 4CpGs for PROM1 and 3CpGs for ADAMTS16. For the analysis of the selected regions of PROM1 (4 CpG), CDKN2A (6 CpG), ADAMTS16 (3 CpG) and MGMT (7 CpG), commercially available CpG assays [PyroMark CpG Assay (200), URL address: https://geneglobe.qiagen.com/product-groups/pyromark-cpg-assays: Hs_PROM105 PM (Cat. No. PM00110194), Hs_ADAMTS1601_PM (Cat. No. PM00022106), Hs MGMT01_PM (Cat. No. PM00149702) and HsCDKN2A_02_PM (Cat. No. PM00039907)] were used.
Evaluation of metastatic potential
The in vivo study was approved by the Institutional Ethic Committee and by the State Veterinary and Food Administration of Slovak Agency under approval No: Ro-290-3/2020-220. Seven-week-old NSG® mice (NOD.Cg-PrkdcSCID IL2rgtm1Wjl/SzJ, Jackson Laboratories USA) were used under institutional guidelines and approved protocols. The approx. 7.5 × 10^6^ cells in 150 μL of 1:1 ECM/DMEM mixture were bilaterally administered subcutaneously into the flanks. Four mice were used for this experiment. Xenografts were measured by caliper three times a week, and volume was calculated using the following formula: V = 0.5236 × ((width + length)/2)^3^. Animals were euthanized after 34 days. Xenografts were excised and weighed, and mice were checked for visible metastasis. Xenografts, lungs, liver, and spleen were subjected to molecular analysis to detect micrometastases.
qPCR analysis
Genomic DNA was isolated by innuPREP DNA Kit (IST Innuscreen, Germany) using the manufacturer’s instructions. Human DNA sequences in mouse tissues were searched by quantitative PCR (qPCR) using GoTaq® Probe qPCR (Promega, USA) and thermocycler CFX 96 (Bio-Rad, USA). 200 ng of purified DNA was amplified in qPCR using primers and probes specific for mouse RAPSYN (receptor-associated protein of the synapse) gene and human β-GLOBIN gene (Supplementary Table 4).
The DNA isolated from mouse cell line NIH/3T3 (ATCC® CRL-1658™) was used as a positive mouse control. The DNA isolated from human cell line HT-29/FURiv-met (https://pubmed.ncbi.nlm.nih.gov/30143021/ and DNA from lung metastasis of human colorectal cancer (PK3) were used as positive controls for presence of human DNA.
The qPCR program was set up as follows: 95 °C initial denaturation for 2 min followed by 40 cycles at 95 °C for 20 s, 60 °C 1 min and then the plate was read. Final annealing was 10 min at 60 °C followed by a cooling step (7 °C). All samples were run in three or four technical replicates, in three independent experiments.
Results
Tumor histology
Macroscopically, the tumor isolated from liver metastasis (Fig. 1a–d) was significantly necrotic (about 50% of the volume), with the vital structures represented by a cribriform and tubular growth pattern (Fig. 1h–j). The tumor cells were cylindrical and polygonal with eosinophilic cytoplasm also with rare intraluminal deposits of mucin. The nuclei were vesicular with distinct nucleoli. Immunohistochemically, the tumor showed expression of CDX2, CK20 and SAT-B2 (Fig. 1e–g). Expression of Cytokeratin 20 was also verified with immunocytochemistry (Fig. 2k, l); the list of antibodies used is shown in Supplementary Fig. 2). The tumor propagated into blood and lymphatic vessels, without obvious intra ductal spread and without perforation of the superficial serosa. The original liver parenchyma was free of pathological changes.
Coala cancer cell line derivation
Isolated primary cancer cells grew in the form of small colony-like 2D structures (Fig. 2b–d) when standard culture plates were used, and also made typical, spheroid 3D structures, when grown in ultra-low attachment plates (Fig. 2g) or when embedded in Matrigel (Corning, USA) matrix gel (Fig. 2e, f). In 2D cultures, remaining tumor stromal cells were detected for several passages. The colorectal cancer cells were, therefore, isolated by manual picking of cancer colonies with the pipette (before picking, the position of cancer cell colonies was marked under microscope with permanent marker) and transferred into new culture plates. Cells were continuously cultured for more than 30 passages and cell aliquots from every passage were stored in freezing medium (10% DMSO and 90% culture medium). Mr. Frosty container filled with isopropanol was used for gentle cell freezing. Frozen aliquots were then transferred from − 80 °C freezer into Dewar container and stored in vapor phase of liquid nitrogen.
Recovery of Coala cells after freezing in liquid nitrogen
Interestingly, after plating the cells from freshly de-frosted frozen aliquots, the recovery of cells took approximately 2–3 days until the appearance of small, sharp-edged colonies was observed (Fig. 2b–d). To increase the recovery of cells after defrosting cryovials from liquid nitrogen, the addition of 10 μM ROCK inhibitor (Y-27632, StemCell Technologies) to the cell culture medium is recommended. During routine passaging, the addition of ROCK inhibitor is not essential.
FISH analysis
The multicolor FISH method (M-FISH) was used to characterize the Coala cell line and composite karyotype, which contains all clonally occurring abnormalities, was compiled as follows:51~54,X,der(X)t(X;16),der(Y)t(Y;1).ish,der(1)t(8;1;8),der(1)del(1p?),der(2)t(X;2),der(2)del(2q?),+7,t(9;10),+10,+11,+der(12),der(13)t(13;1),−18,+19,+19,der(19)t(1;19)[cp6] (Fig. 2h).
Mycoplasma test
PCR-based mycoplasma test for detection of more than 60 species of mycoplasma, acholeplasma, spiroplasma and ureaplasma proved that Coala cancer cell line was free of mycoplasma infection (Fig. 2i).
Analysis of transcription factors by antibody array
Human pluripotent stem cell antibody array analysis of 15 stem cell markers expression indicated that Coala cancer cell line express high levels of E-Cadherin, Fox-A2 and PDX-1 and moderate levels of Snail transcription factor (Fig. 2j).
Growth curve analysis
Doubling time of Coala cells was estimated to be around 2.5 day as calculated with doubling time calculation formula (doubling time = [t × (ln2)]/[ln(N20/N0)] (Fig. 2m).
Sensitivity to 5-fluorouracil
Coala cancer cell line was shown to be sensitive to 5-fluorouracil as shown in Fig. 2n.
Xenotransplantation of human cancer cells
Xenografting of human colorectal cancer cells into athymic mice proved the ability of newly derived human cancer cell line to induce fast-growing tumors, histologically similar to original tumor, isolated from patient (Fig. 3a-i).
Flow cytometry analysis of surface markers
Multiplex flow cytometry analysis of 376 human surface CD markers on newly derived Coala cancer cell line using MACS Marker Screen (Miltenyi Biotec, Germany) plate kit and MACSQuant Instrument showed that high percentage (more than 90%) of Coala cells express CD9, CD26, CD29, CD49B, CD49f, CD66acde, CD66ace, CD98, CD147, CD164 and CD326. Some other markers were also abundant—for full list of markers detected and % of positive cells see the Supplementary Fig. 3, Supplementary Fig. 4 and Supplementary Table 3). Interestingly, Claudin-3 was found to be expressed in 58.15% of cells, and SSEA-4 in 61.33% of cells. No expression was detected for few other markers (e.g., CD21, CD22, CD61, and CD69). Interestingly, the expression of Lgr-5 was found to be expressed in freshly-isolated cancer cells (Fig. 2p–r), but not in Coala cancer cell line at later passage (P21) (Supplementary Fig. 3, Supplementary Fig. 4 and Supplementary Table 3).
STR fingerprinting analysis
Based on STR fingerprinting analysis*,* Coala cell line was proved to be human, original and free of other cell type contamination as verified by comparing with the ATCC (American Type Culture Collection) reference database profile. STR fingerprinting also verified the same origin of tumor sample and isolated Coala cell line. Note: To protect the identity of the donor, only selected loci are shown as recommended by ATCC (Supplementary Fig. 5).
Whole exome sequencing
Whole exome sequencing of Coala cancer cell line discovered at least 7 mutations with clinical significance described as “pathogenic” (Supplementary Table 1, orange color) and several mutations that can be described as “likely pathogenic” (Supplementary Table 1, yellow color). The pathogenic mutations were found in C8B (Complement component 8), PRKCQ (gene encoding Protein kinase C theta), IRGM (Immunity-related GTPase family M protein), FGFR4 (Fibroblast growth factor receptor 4), POLR1C (RNA polymerase I and III Subunit C), APC (Adenomatous polyposis coli) and TP53 (tumor protein 53) genes (Table 2 and Supplementary Table 1, orange color).Table 2. The summary data and the sequencing statistics for TruSight™ Oncology 500 targeted, hybrid-capture based next-generation sequencing analysisA. Detailed information of mutations from report (variants from tiers IA, IB, IIC and IID)GeneDNA changeAA mutationCDS mutationClassificationTranscript—NCBI IDVAFDepthTP53chr17:g.7577538C>Tp.R248Qc.743G>AIBNM_000546.550.41250APCchr5:g.112175218_112175222del5p.E1309Dfs4c.3927_3931del5IICNM_000038.520.71333APCchr5:g.112175354delTp.S1355Lfs60c.4063delTIICNM_000038.536.81636BRCA1chr17:g.41244000T>Cp.K1183Rc.3548A>GIICNM_007294.322.91629ERBB2chr17:g.37884037C>Gp.P1170Ac.3508C>GNM_004448.220.61454FGFR4chr5:g.176520243G>Ap.G388Rc.1162G>AIICNM_213647.161.1529NOTCH1chr5:g.176520243G>Ap.R912Wc.2734C>TIICNM_017617.386.2817TP53chr17:g.7579472G>Cp.P72Rc.215C>GIICNM_000546.599.91642ASXL1chr20:g.31022959T>Cp.L815Pc.2444T>CIIDNM_015338.5100.03512PARP1chr1:g.226555302A>Gp.V762Ac.2285T>CIIDNM_001618.338.11226RETchr10:g.43613908A>Tp.Y791Fc.2372A>TIIDNM_020975.438.61356B. The sequencing statistics of TSO500 analysisTotal number of reads66,635,811% Mapped reads99.56%On target reads55,372,700% On target reads83.47%Number of UMI families43,770,836% Unique on target reads79.05%% Positions > 50 × unique98.67%% Positions > 250 × unique95.60%Average unique coverage1284.0C. Detailed information of CNVs from report (CNVs from tiers IA, IB, IIC and IID)GeneCNV typeCopy numberClassificationCCND3Copy number gain3 copiesIICAKT2Copy number gain5 copiesIIDBRCA2Copy number gain4 copiesIIDFGF9Copy number gain4 copiesIIDMYCCopy number gain3 copiesIIDCCNE1Copy number gain5 copiesIIC
Next generation sequencing of original tissue
The TruSight™ Oncology 500 (Illumina, USA) targeted, hybrid-capture based next-generation sequencing assay detected several mutations (variants of strong clinical significance and variants of potential clinical significance)—Level IB (MYC, TP53), IIC (APC, BRCA1, CCND3, CCNE1, ERBB2, FGFR4, NOTCH1, and TP53) and IID evidence (AKT2, ASXL1, BRCA2, FGF9, PARP1 and RET), see Table 3 and Supplementary Fig. 6).Table 3. The summary data and the sequencing statistics for whole exome sequencing analysis of Coala cancer cell lineAChromStartEndRefAltFunc.Ref. GeneGenRef. GeneExonicFunc.refGeneCLIN DIAGNCLIN SIGNDEPTHVAF156,940,96556,940,965GAExonicC8BStopgainComplement_component_6_deficiencyPathogenic690.4061198,807,802198,807,802CADownstreamMIR181A1HG–Acute_myeloid_leukemia_with_maturationPathogenic560.2321198,826,991198,826,991CTncRNA_intronicMIR181A1HG–Acute_myeloid_leukemia_with_maturationPathogenic220.2271198,898,549198,898,549GTncRNA_intronicMIR181A1HG–Acute_myeloid_leukemia_with_maturationPathogenic331.01198,898,955198,898,955GAncRNA_intronicMIR181A1HG–Acute_myeloid_leukemia_with_maturationPathogenic301.01198,900,385198,900,385TCncRNA_intronicMIR181A1HG–Acute_myeloid_leukemia_with_maturationPathogenic431.0106,485,1816,485,181GAExonicPRKCQNonsynonymous SNVInflammatory_bowel_disease_1Pathogenic810.506177,674,2207,674,220CTExonicTP53Nonsynonymous SNVLi-Fraumeni_syndrome_1|Hepatocellular_carcinoma|NeoplasmPathogenic401.051,216,7851,216,785GAIntronicSLC6A19–Hyperglycinurialiminoglycinuria_digenicPathogenic1350.1855112,839,515112,839,519AAAAG–ExonicAPCFrameshift deletionGastric_polyposis|Duodenal_polyposis|Adenomatous_colonicPathogenic660.3945150,848,436150,848,436CTExonicIRGMSynonymous SNVInflammatory_bowel_disease_19Pathogenic720.4315177,093,242177,093,242GAExonicFGFR4Nonsynonymous SNVCancer_progression_and_tumor_cell_motilityPathogenic570.439643,520,07843,520,078GAExonicPOLR1CNonsynonymous SNVLeukodystrophy_hypomyelinating_ 11Pathogenic1070.196847,931,49647,931,496–TIntronicPRKDC–Immunodeficiency_26_with_or_without_neurologic_abnormalitiPathogenic600.2BTotal number of sequenced reads (in thousands)32,222,600Total number of uniquely mapped non-duplicate reads28,259,220Percentage of target bases with coverage > 30x76%Median coverage per targeted base61The percentage of targeted bases with coverage > 2097.10%
Pyrosequencing of Coala cell line
We analyzed 7CpGs for MGMT, 6CpGs for CDKN2A, 4CpGs for PROM1 and 3CpGs for ADAMTS16. Out of four CRC biomarkers, three showed certain degree of hypomethylation. Percentage of methylation in each CpG island for every gene is shown in Supplementary Table 2. The percentage of methylation for MGMT was found to be 4% in CpG1, 2% in CpG2, 1% in CpG3, 3% in CpG4, 3% in CpG5, 3% in CpG6 and 9% in CpG7, whereas for CDKN2A it was 2% in CpG1, 3% in CpG2, 9% in CpG3, 5% in CpG4, 3% in CpG5 and 1% in CpG6. For PROM1, it was 1% in CpG1, 10% in CpG2, 1% in CpG3 and 4% in CpG4. The average percentage of methylation for unmethylated and methylated DNA was 1,85% (unmethylated) and 97.71% (methylated) for MGMT, 6% (unmethylated) and 72.3% (methylated) for CDKN2A and 1.5% (unmethylated) and 88.75% (methylated) for PROM1. Last CRC biomarker, ADAMTS16, showed a certain degree of hypermethylation in its selected region according to pyrosequencing analysis. The percentage of methylation was 98% in CpG1, 97% in CpG2 and 96% in CpG3. The unmethylated and methylated DNA showed average methylation to be 9% (unmethylated) and 92.3% (methylated) (Supplementary Table 2).
Evaluation of metastatic potential
During the growth of xenograft (34 days, Fig. 4a–c), mice showed no sign of cachexia or pain. During the autopsy, no visible metastases were detected. The lungs, livers, and spleens were subjected to detection of human β-GLOBIN gene by qPCR, which would point to the presence of micrometastases in the mouse tissue. As no human β-GLOBIN was detected in any lungs, livers, or spleens (Fig. 5a), we assumed that after 34 days, no micrometastases disseminated from Coala cancer cell line-induced subcutaneous xenografts. Human β-GLOBIN was only detected in Coala xenografts (XL means left xenograft, XR means right xenografts), confirming their human origin (Fig. 5b). The sequences of primers and probes used in the study are indicated in Supplementary Table 4.Fig. 4. The analysis of Coala cancer cell line xenograft tumor growth (a), weight and volume (b) of tumors (c) in evaluation of metastatic potential of Coala cancer cell line. Cells from passage No.21 were used in experimentFig. 5The qPCR analysis of human β-GLOBIN gene in samples from the lungs, livers and spleens of xenografted mice (a). Human β-GLOBIN was only detected in Coala cancer cell line-derived xenografts (b), confirming their human origin
Discussion
The incidence of colorectal cancer has increased over the last decade [2]. Development of the new therapies for this cancer requires presence of adequate in vitro and in vivo models. In vitro models are typically represented by two-dimensional cell lines that are available for researchers via repository centers (like ATCC, Manassas, USA), or commercial companies. However, two-dimensional cell lines do not mimic the real human tumor three-dimensional architecture and therefore, do not represent the optimal model systems [13]. On the other hand, recent advances in 3D culture systems, tissue engineering and even 3D printing [14] allow researchers to use special form of culture conditions and grow cells in form of spheroid or organoids. Cells growing in such environment will assemble into structures that share some similarities with the real tumors [15]. Moreover, in future, these 3D culture systems will be probably preferred by pharmacological companies for new chemotherapy testing as tumor organoids have tendency to respond in the same way as real tumors [16]. Non-effective drugs are, therefore, pre-selected directly at the beginning of the new drug development process. The ability of cancer cells to form tumorspheres and grow in 3D is therefore another valuable characteristic of new in vitro model as some cancer cell lines do not have this ability and when placed in 3D culture, they only form atypical cell clumps.
Cancer cell lines retain many features of original tumors, but in the same time, they are known to acquire alternations (mutations) during the in vitro culture [17]. When genomic and expression profiles were compared by several research groups, it was found that some already existing cancer cell lines differ from the tumors of their origins and cannot be therefore considered as a really good models [17]. The next generation sequencing of our original tumor sample (liver metastasis) revealed several pathological mutations (Table 3, full list of the mutations is indicated in Supplementary Fig. 6), from them, three mutations (APC, TP53 and FGFR4) were also found to be conserved in Coala cancer cell line (Table 2 and Supplementary Table 1). Histology of the original tumor sample (liver metastasis) showed a weak signal for Cytokeratin 20 (Fig. 1f). This is a well-known phenomenon, observed by many pathologists, that some tumor-specific antibodies show a weak signal (or no signal) at metastatic sites [18]. When fluorescent immunocytochemistry analysis was performed for Coala cells, it proved expression of Cytokeratin 20 in this cell line (Fig. 2k, l).
Multiplex flow cytometry analysis of all 376 human CD markers revealed expression of several surface markers that are associated with colorectal cancer. High expression (more than 90% of positive cells) was detected for several CD markers (e.g., CD 326 (EpCAM, one of the first cancer-associated antigens identified [19]), CD164 (promising new target for diagnosis and treatment of colon cancer [18]), CD147 (a potential 5-FU resistance biomarker for colorectal cancer patient [20]), CD98 (a potential prognostic biomarker for colorectal carcinoma [21]), CD29 (cell surface marker associated with cancer self-renewal [22]), CD26 (reported as a marker for colorectal cancer stem cells [23]) and CD9 to name a few) was detected. Interestingly, expression of CD9 (a member of tetraspanin superfamily, high expression of this tumor suppressor was connected to a favorable disease-free survival in colorectal cancer patients [24]) was comparable with expression of CD9 detected in SW480 colorectal cancer cells [25]. Interestingly, our newly developed Coala cancer cells express CD133 (10.99%). This CD marker is, according to several studies, one of the cancer stem cell markers [26, 27]. As many studies are now focused on research of rare cancer stem cell population, we believe that the new cancer cell line proposed by our group will become a useful research tool in the field.
Coala cell line was also tested for the sensitivity to 5-fluorouracil (Fig. 2n), standard first-line treatment for colorectal cancer patients [28]. The sensitivity of Coala cell line to 5-fluorouracil after 48-h exposure was comparable to sensitivity of HT-29 colorectal carcinoma cells (HT-29 is an adherent epithelial cell line derived from patient with colorectal adenocarcinoma primary tumor) [29]. On the other hand, Coala cancer cell line shows a higher level of resistance when compared with two newly derived colorectal cancer cell lines, published recently (in 2024) by Cheng and co-authors [30]. This could be associated with the high expression of CD147 (a potential 5-FU resistance biomarker for colorectal cancer patient [20]).
Liver metastasis is the major contributor in colorectal cancer-related death. As the liver microenvironment take part in many steps of metastatic cascade from pre-metastatic niche formation, tumor cell colonization to metastatic tumor establishment, better understanding of mechanisms orchestrating the formation of a hepatic metastatic niche is necessary for the development of effective therapies. Until 2018, only a limited number of cell lines originated from human liver metastasis was reported by researchers [31–34]. Interestingly, no examples of 3D growth or tumorsphere formation were shown by authors of these studies. As already mentioned, the ability of cancer cell line or cancer cells to form organoids/tumorspheres is of interest in recent years as this feature is typically used to determine the percentage of cancer stem cells—a minor population of cancer cells with self-renewal and multi-lineage differentiation ability.
Recently published colorectal cancer cell lines (a pair of primary colorectal cancer-derived and corresponding synchronous liver-metastasis–derived organoid cell lines and patient-derived 3D cancer cell lines) were derived as organoid culture, capable of growing in form of 3D organoid structures [30]. These two cell lines were deposited into repository center (CCTCC, China Center for Type Culture Collection) for general use [30].
Interesting approach for utilizing the 3D culture to study metastatic colorectal cancer was used by D’Angelo et al. [35]. In this study, researchers showed an increased HT-29 cancer cell line proliferation and migration capability (together with some signs of epithelial–mesenchymal transition process) when cancer-derived scaffolds were used and compared with scaffold from liver tissue or healthy colon.
At ATCC (American Type Culture Collection), a collection of five patient-derived next generation cancer models—3D organoids (generated by the Human Cancer Models Initiative (HCMI) program) from primary tumor tissue of metastatic colon cancer is available to the researchers (Table 1). Five 2D cell lines derived from liver metastasis of colorectal cancer patient were deposited at the Leibniz Institute DSMZ (Deutsche Sammlung von Mikroorganismen und Zellkulturen) (Table 1). In 2025, two new 3D organoid cell lines were derived and deposited into repository center (CCTCC, China Center for Type Culture Collection) for general use [30]. Therefore, the lack of established and well-characterized 2D/3D cancer cell lines, derived from liver metastatic tissue of colorectal patients still remains.
In conclusion, Coala cancer cell line represents a new cancer cell line model and will be available to the researchers and research groups via local and international repository centers.
Supplementary Information
Below is the link to the electronic supplementary material.Supplementary Fig.1 The chromosomes derived from cultured Coala cells, analyzed by standard cytogenetic G-banding method (TIF 102 KB)Supplementary Fig.2 The list of antibodies, used in the study (TIF 53 KB)Supplementary Fig.3 Multiplex flow cytometry analysis of all 376 human surface CD markers (both positive and negative CD markers are show) (TIFF 2469 KB)Supplementary Fig.4 Multiplex flow cytometry analysis of positively-stained CD markers of newly derived Coala cells. Image (heat map) shows the percentage of positive cells detected for each CD marker. Negative CD markers are not included (TIF 1329 KB)Supplementary Fig.5 Selected loci from STR fingerprinting analysis confirming the same origin of tumor sample and isolated Coala cell line. Cells from passage No.21 were used (TIF 421 KB)Supplementary Fig.6 The list of mutations found in the original metastasis with The TruSight Oncology 500 (Illumina, USA) targeted; hybrid-capture based next-generation sequencing assay (TIF 315 KB)Supplementary Table 1 (XLSX 48414 KB)Supplementary Table 2 (TIF 968 KB)Supplementary Table 3 (TIF 2902 KB)Supplementary Table 4 (TIF 54 KB)
The reference list from the paper itself. Each links out to its DOI / PubMed record.
- 1Hashiguchi Y, Muro K, Saito Y, et al., Japanese Society for Cancer of the Colon and Rectum. Japanese society for cancer of the colon and rectum (JSCCR) guidelines 2019 for the treatment of colorectal cancer. Int J Clin Oncol. 2020;25(1):1–42. 10.1007/s 10147-019-01485-z. (Epub 2019 Jun 15. PMID: 31203527; PMCID: PMC 6946738).10.1007/s 10147-019-01485-z PMC 694673831203527 · doi ↗ · pubmed ↗