Ethnic differences in pain, function, and catastrophizing in South Florida adults with knee osteoarthritis
Daniel Quintero, Jacob Jahn, Jean Jose, Eric Kholodovsky, Levi M. Travis, Joseph P. Costello II, Olivia Perez, Alberto J. Caban-Martinez, Thomas M. Best

TL;DR
Hispanic patients with knee osteoarthritis report more pain, worse function, and higher pain catastrophizing than non-Hispanic White patients, even after adjusting for socioeconomic status and disease severity.
Contribution
The study expands on previous findings by including a larger Hispanic cohort and analyzing the influence of sex, socioeconomic status, and radiographic severity.
Findings
Hispanic patients had significantly higher pain intensity, functional limitation, and pain catastrophizing scores than non-Hispanic White patients.
These differences remained significant even after adjusting for socioeconomic status and radiographic severity.
Male and female Hispanic patients both reported higher pain severity compared to non-Hispanic White patients.
Abstract
Ethnicity is associated with varying reporting of pain, coping mechanisms, and disease severity in patients with knee osteoarthritis (KOA). However, few studies have evaluated its importance in ethnicity, particularly the Hispanic population. This study compares pain intensity (VAS), function (WOMAC), and pain catastrophizing (PCS) between Hispanic (HP) and non-Hispanic White patients (NHWP) stratified by socio-economic status (SES) and osteoarthritis radiographic K-L grade. A cross-sectional study of patients from a tertiary care clinic between July 2021 and December 2022 was performed. Patients with knee pain, radiographs, and doctor-diagnosis of KOA completed questionnaires in English or Spanish. Descriptive statistics characterized demographic differences between NHWP and HP in VAS, WOMAC, and PCS. Two one-way analyses of variance evaluated the effect of both ethnicity and sex,…
Genes, proteins, chemicals, diseases, species, mutations and cell lines named across the full text — each resolved to its canonical identifier and authoritative record.
Click any figure to enlarge with its caption.
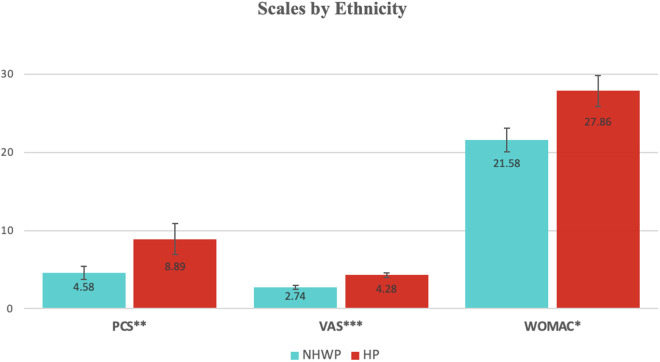 Fig 1
Fig 1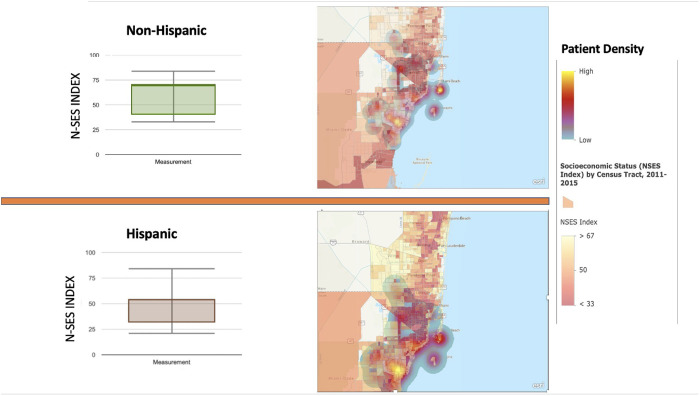 Fig 2
Fig 2Peer Reviews
No public reviews on file for this paper yet. If you reviewed it on a platform where reviews are public (OpenReview, ICLR, NeurIPS, ICML), you can paste yours below so the community can read it here.
Videos
No videos yet. Explain this paper in a talk, walkthrough, or lecture? Add one.
Taxonomy
TopicsOsteoarthritis Treatment and Mechanisms · Musculoskeletal pain and rehabilitation · Total Knee Arthroplasty Outcomes
Introduction
Osteoarthritis (OA) is the most common form of arthritis worldwide, with a higher incidence in high-income countries and older individuals. In the United States alone, over 32.5 million individuals have been diagnosed with OA, 3 million of which are Hispanic, a minoritized ethnicity [1–4]. The burden of OA in the Hispanic community is significant, contributing to increased disruption to daily activities, health disparities, and prevalence. Studies have shown that Hispanic individuals (HP) with OA often experience greater pain severity and disability compared to non-Hispanic White patients (NHWP), highlighting the importance of addressing OA in this population [5,6]. Additionally, HP are less likely to receive appropriate OA management, which can negatively influence health outcomes [7]. Knee OA (KOA) is the leading cause of lower extremity disability, and as of 2010, was ranked the 11th highest contributor to global disability [8]. Accordingly, studies including diverse populations and larger sample sizes are needed to more fully understand the total burden of OA to better inform unmet needs of both the patient and the medical community serving them.
The diagnosis of OA is typically based on clinical assessment and confirmed by routine plain radiographs [6]. Patients typically report activity-related joint pain that is associated with morning stiffness of less than 30 minutes duration [9,10]. However, this presentation is not consistent across all patient populations. Like other chronic diseases, the presentation and subsequent morbidity of KOA demonstrates considerable variability across different races and, more recently, ethnicities [11–15]. For example, the Johnston County OA project demonstrated statistically significant differences in both pain severity and radiographic severity (Kellgren and Lawrence [K-L]) scores between African Americans and Caucasians with symptomatic KOA at initial presentation [16,17]. Other investigators have corroborated this finding by reporting greater pain severity among African Americans compared to NHWP with hip and knee OA [18–24]. Both studies utilized race, an observable characteristic with social implications, as the independent variable between groups. Recently, Hoffman et al. denoted that there are no biological differences in pain experience based on race alone yet there are racial biases in the treatment and assessment of pain [25].
Ethnicity, on the other hand, may or may not carry a different race; however, the term attempts to capture the culture of people in a given geographic region, including their language, heritage, religion and customs [18]. Hollingshead et al. discussed how ethnicity is involved in the processing and reporting of pain in individuals with one or more chronic diseases [26,27]. Moreover, the investigations by Hollingshead observed that Hispanic persons (HP) report greater pain sensitivity and less pain tolerance than NHWP [26]. Furthermore, a study by Wang included four different ethnicities (East Asian, African American, Hispanic and Caucasian) and found differences in pain sensitivity between ethnicity after capsaicin administration [28,29]. Finally, Levy et al. highlighted differences in symptom severity on presentation for a well-known chronic illness, alcoholic liver disease, between Caucasians and Hispanics [30].
Although current data indicating an association between pain experience, disease severity, and ethnicity are limited, there are findings specific in Hispanics with chronic pain and arthritis regarding pain intensity and coping mechanisms. Studies utilizing population-based data from the third National Health and Nutrition Examination Survey (NHANES-III) demonstrated that HP with self- reported arthritis are twice as likely to self-report symptoms of activity limitation when compared to NHWP [2]. HPs with an assigned diagnosis of arthritis also tend to report greater pain scores as measured by the Visual Analog Scale (VAS) [18]. Furthermore, when compared to NHWP, HPs have a greater propensity to utilize pain-catastrophizing coping mechanisms to address any physical manifestation of chronic pain [18,27]. The psychosocial aspect of arthritic pain and how implications in socioeconomic, psychological, and environmental factors have a substantial influence on an individual’s perception of their self-efficacy and quality of life have been highlighted [29–31].
One maladaptive strategy utilized more commonly in Hispanics for coping with chronic pain is pain catastrophizing (PCS). Pain catastrophizing is the tendency to develop a belief that the pain will not resolve (helplessness), a constant repetitive dwelling on the negative aspects of the pain (rumination) and exaggerating/ falsely intensifying the perceived pain stimulus (magnification) [32]. Greater pain catastrophizing is associated with greater pain and functional limitation [33]. Additionally, greater pain catastrophizing has been independently associated with lower socio-economic status [12,34–37]. Green et al. expanded on this claim and underlined that neighborhood socioeconomic status (NSES) mediated chronic pain experience in younger White and Black individuals [38]. They argued that NSES mediated the pain experience differences identified between races. Therefore, to explore if differences in pain experiences exists between ethnicity, NSES or a surrogate measure may be noteworthy [36,38].
As in a number of chronic diseases, the elements contributing to OA symptomology are multifactorial; therefore, it is important to consider whether ethnic differences in pain sensitivity or PCS might be moderated by biological sex. To investigate this further, our study conducts specific demographically based analyses, such as breaking down participants by sex, to investigate ethnic differences in pain outcome measures like PCS. For instance, previous research has shown that sex differences in pain perception and coping strategies are notable, with women often reporting higher pain sensitivity and greater pain catastrophizing compared to men [39–41]. Additionally, the intersectionality of sex and ethnicity may further elucidate these disparities in pain experiences, as cultural norms and expectations related to sex and ethnicity can also impact pain reporting and management [42,43]. Therefore, it has been hypothesized that sex may influence the relationship between ethnicity and pain outcomes, with Hispanic women possibly reporting higher pain sensitivity and greater pain catastrophizing compared to their male counterparts and NHWP women [44,45].
The purpose of the present study was to determine if there are differences in pain severity, functional limitation, and pain catastrophizing between HP and NHWP with KOA after adjusting for the possible confounders including socioeconomic status (SES) and radiographic disease severity. Investigating a convenience sample of patients from southern Florida, a region somewhat unique with its high prevalence of HP, our hypothesis was that there are differences in reporting of pain severity, functional limitations, and pain catastrophizing between the two ethnicities that will persist after controlling for covariates including NSES and KL grade.
Materials and methods
Study population and data source
All procedures were approved by the University of Miami Institutional Review Board (IRB). 195 study participants were recruited between July 1st, 2021 and December 22^nd^, 2022 from our tertiary care medical center in Miami-Dade County, Florida via convenient sampling contingent on investigator (DQ, JPC) availability and patient willingness. Patient eligibility was limited to those eligible to be seen at our clinic (valid insurance coverage, age greater than 18) presenting for the first time to our clinic with knee pain and/or stiffness and subsequently diagnosed with KOA by history, physical exam, and knee radiographs (i.e., AP, lateral and skyline Merchant views). Clinical OA was determined by a sports medicine attending (TMB) during the encounter. OA grade was determined by a blinded musculoskeletal radiologist (J Jose) using the KL grading system (4). Location of OA (tibiofemoral and/or patellofemoral) was also noted. Following written patient consent, one of four interviewers (DQ, SH, JPC, EK) administered a series of standard questionnaires in either English or Spanish depending on patient preference. All required data were collected using REDCap, an electronic data capture tool hosted at the University of Miami. The data were handled by a single investigator (DQ), de-identified by random sequence software using a university- approved computer and stored on an encrypted hard drive. Written consent was obtained for each patient and was provided in both English and Spanish. The study research protocol was reviewed and approved by the University Institutional Review Board (#20190389) at the University of Miami.
Survey instrument and study measures
We administered a 61-item study questionnaire during the clinical encounter to collect information about participants’ sociodemographic characteristics, including age, sex, occupation, smoking status, race, and body mass index. As part of the questionnaire, we issued the Charles comorbidity index (CCI) to quantify participants’ chronic comorbid conditions. Nineteen different conditions were assessed among study participants including, myocardial infarction, congestive heart failure, peripheral vascular disease, cerebrovascular disease (except hemiplegia), dementia, chronic pulmonary disease, connective tissue disease, ulcer disease, mild liver disease, diabetes (without complications), diabetes with end organ damage, hemiplegia, moderate or severe renal disease, solid tumor (metastatic and non-metastatic), leukemia, lymphoma, multiple myeloma, moderate or severe liver disease, and HIV infection. These conditions were included as they represent a wide spectrum of chronic diseases that can impact overall health and function, providing a comprehensive measure of the existing comorbidity burden. The presence of individual diseases was quantified using a weighted point system and added to produce a single value per participant [36].
Patient pain scores were quantified at the time of presentation to the clinic using a scale from 0 to 10 (visual analog scale – VAS). Before answering, the patient was told that 0 represented being pain-free and 10 represented the worse pain imaginable. We also administered a standardized pain catastrophizing scale (PCS) questionnaire. This scale was developed to assess three components of catastrophizing: rumination, magnification, and helplessness [37]. The scale included 13 validated questions that required responses on a point scale of 0–4, and the scores were summed to produce a single value representing the total pain catastrophizing exhibited by each participant, with higher PCS indicating greater pain catastrophizing [37]. Participant functional limitation was assessed using the Western Ontario and McMaster Universities Osteoarthritis Index (WOMAC) [11], a validated tool specifically designed to evaluate pain, stiffness, and physical functionality in daily life in individuals with OA.
Spanish validation and testing administration
Investigators (DQ and JPC) are qualified per IRB requirements to gather consent and subsequently administered the 61-item questionnaire in Spanish to study participants. All questionnaires CCI, PCS, VAS, and WOMAC were previously validated in Spanish [46–50].
Geocoding socioeconomic status
We replicated the approach used by Feldman et al. and utilized the Geographic Information System (GIS) to geocode individual home addresses [34]. For each patient’s individual address, we obtained a Federal Information Processing Standard (FIPS) code and linked it to U.S. Census and American Community Survey data at the block group level. The block group is the smallest geographic unit for which the variables are published. For each block, we collected the Neighborhood Socioeconomic Status (NSES) Index, a previously validated measure for socioeconomic status [51]. This measure includes unemployment (percentage of persons ≥16 years of age in the labor force who are unemployed and actively seeking work), income (percentage of persons below the federally defined poverty line and median household income), wealth (median value of owner-occupied homes), education (percentage of persons aged >25 with less than a 12th-grade education and percentage of persons aged >25 years with at least four years of college) and crowding (percentage of households containing ≥1 person per room). SES index scores were reported on a scale of 0–100. NSES index values for each identified block pertaining to a single ethnicity were averaged and reported as a mean and standard deviation.
Data analysis
Continuous values were reported as the mean and standard deviation for each sample. For descriptive data defined by dichotomous selection, the total percentage within a category was reported.
Comparisons
Sample means were compared between groups via Student’s T-test for comparison of means. For comparisons of normally distributed continuous variables between two independent groups, independent samples t-tests were used. Comparisons of the study parameter that failed F-testing required a Mann-Whitney test for averages of unequally distributed sample values. Statistical comparisons of survey data were performed with GraphPad Prism Version 9.4.1 software (GraphPad Software, San Diego, California USA,).
Sub-group analysis
Descriptive statistics were generated with means and standard deviations for continuous variables and frequencies with proportions for categorical variables. The three primary dependent variables evaluated included VAS (1–10 scale), PCS, and WOMAC. K-L grade was evaluated as both an independent variable, and as a secondary dependent variable given specific secondary independent variables (Age, BMI, etc.) may influence disease severity radiographically.
Stratified analyses were performed based on a priori hypotheses and supported by observed trends in interaction terms. Although formal interaction testing was not always statistically significant, stratification helped to explore clinically meaningful trends by sex and radiographic severity. For comparisons of outcomes between ethnic groups within each K-L grade stratum, independent samples t-tests were used.
ANOVA analysis
One-way analyses of variance (ANOVA) were performed to evaluate the effect of both dichotomous independent variables: Ethnicity (NHWP or HP) and Sex (M or F). WOMAC, PCS, VAS, and K-L grade were analyzed as dependent variables. One-way ANOVAs were also performed comparing WOMAC, PCS, and VAS of ethnicities while stratifying by K-L grade and Sex. A one-way ANOVA was performed comparing the effect of K-L grade on WOMAC, PCS, and VAS, while stratifying by Ethnicity. One-way ANOVAs were also performed to compare means of Age, Height, CCI, and NSES between NHWP and HP.
While mean K-L grade values were reported descriptively, comparisons by K-L grade category were conducted using non-parametric tests and ANOVA treating K-L as categorical. Any analysis involving K-L as a covariate in multivariable models treated it as ordinal with fixed levels
Linear regressions
Linear regressions were performed to evaluate the effects of all continuous or scale independent variables (NSES, CCI, Height, BMI, and Age) on each of the three primary dependent variables, as well as K-L grade. The relationships between continuous covariates such as BMI and outcome variables (PCS, WOMAC, and VAS) were evaluated using linear regression. Observed cumulative probability was plotted against expected cumulative probability. Standardized residuals were plotted in histogram form to validate sample distribution, and standardized predicted residuals were plotted against actual standardized residuals to check validity of each regression model.
Multivariate analysis
Multivariate general linear models were computed for primary independent variables and their interaction between each other and various secondary independent variables, including key continuous variables. Selected variables were based on the results of one-way ANOVAs and linear regressions, which demonstrated isolated effects of particular independent variables and therefore had to be cross-analyzed with primary independent variables to see interaction and confounding effects. Variables found to have potential confounding effects on primary independent variables, such as socioeconomic status and K-L grade, were then tested in multivariate general linear models as covariates both separately and in the same model. Post-hoc Tukey and Bonferroni tests were computed for analyses that contained 3 or more subgroups, which for this sample included only K-L grade. Similarly, univariate general linear models were computed for primary independent variables and secondary independent variables found to have statistically significant effects on VAS, PCS, or WOMAC.
Graphs were created to demonstrate both the effects of primary independent variables, as well as primary independent variables stratified by other variables shown to have significant or non-significant effect on VAS, PCS, or WOMAC. Scatterplots were generated to demonstrate correlation and R^2^ values of linear regressions. Mean and median plots were generated, depending on the scale of the dependent variable and the vulnerability of the variable to have significant outliers, such as PCS. All graphs were generated using IBM SPSS statistics version 29.0.2.0 or Microsoft Excel version 16.83.
All statistical analysis was conducted using IBM SPSS Statistics version 29.0.2.0. Statistical significance was considered alpha values <0.05 and within a 95% confidence interval.
Results
Outcomes by ethnicity
VAS, PCS, and WOMAC were greater in HP when compared to NHWP (Table 1, Fig 1). The mean PCS score was greater in HP (p = 0.004, t(193) = −2.919, d = −.479) at 8.89 (STE = 0.814, CI = 95% [7.28–10.50]) while NHWP had a mean PCS of 4.58 (STE = 0.862, CI = 95% [2.85–6.31]). For VAS, the mean was again greater in HP (p < 0.001, t(193) = −3.474, d = −.570) at 4.28 (STE = 0.236, CI = 95% [3.81–4.74]) while NHWP had a mean VAS rating of 2.74 (STE = 0.313, CI = 95% [2.11–3.37]). The mean WOMAC in HP was greater than NHWP (p = 0.029, t(193) = −2.195, d = −.360) with an average of 27.86 (STE = 1.536, CI = 95% [24.82–30.89]) in HP and 21.58 (STE = 1.960, CI = 95% [17.64–25.52]) in NHWP. K-L grade demonstrated no difference between HP and NHWP (p = 0.581, t(193) = 0.553, d = .091) with mean grades of 1.66 (STE = 0.096, CI = 95% [17.64–25.52]) and 1.76 (STE = 1.960, CI = 95% [17.64–25.52]) respectively. When stratifying by ethnicity, K-L grade showed no significant effect on VAS, PCS, or WOMAC in NHWP. However, increased K-L grade showed a significant increase in VAS, PCS, and WOMAC in HP (Table 2). Population sizes for NWHP at each K-L grade ranged from n = 5 to n = 17, while in HP they ranged from n = 14 to n = 52 (Table 3).
Table 1: Comparison of VAS, PCS, and WOMAC in HP and NHWP populations, as well as comparisons of demographic information such as Age, Height, CCI, and NSES. Bolded values indicate significance.
Table 2: Comparison of VAS, PCS, and WOMAC by K-L grade, stratified by Ethnicity.
Table 3: Comparison of outcomes VAS, PCS, and WOMAC between HP and NHWP, stratified by K-L grade.
Comparison of outcomes PCS, VAS, WOMAC between HP and NHWP.Values with asterisk () indicate significance. p values for ()= < .05, ()=<.01, ()=<.001.*
In terms of secondary demographic characteristics, height (STE = .577, CI = 95% [66.56–68.88], p = .006, t(193)= −2.752*,* d = −.451), Age (STE = 1.521, CI = 95% [57.12–63.24], p = .028, t(193) = −2.218, d = −.364), and NSES (STE = 2.33, CI = 95% [59.09–68.45], p < .001, t(193) = −3.684, d = −.604) in NHWP were all significantly greater when compared to Height (STE = .328, CI = 95% [65.28–66.57]), Age (STE = .920, CI = 95% [54.36–58.00]), and NSES (STE = 1.11, CI = 95% [53.03–57.39]) in HP (Table 1). Otherwise, BMI was less (p = .048, t(193) = 1.993, d = .327) in NHWP (STE = .783, CI = 95% [26.25–29.40]) when compared to HP (STE = .533, CI = 95% [28.80–30.91]). There was no difference in CCI (p = .450, t(193) = −.757, d = −.124) between NWHP (STE = .218, CI = 95% [1.50–2.38]) and HP (STE = .137, CI = 95% [1.47–2.01]). Subjects with tricompartmental disease had significantly lower VAS than Patellofemoral (p = .002) or Patellofemoral + Medial (p = .001) locations. Controlling for location, VAS (p = .005), PCS (p = .030), and WOMAC (p = .033) remained greater in HP compared to NHWP. Ethnicity*K-L grade yields no difference in WOMAC (p = 0.345), PCS (p = 0.292), or VAS (p = 0.322). Stratifying primary outcomes with ethnicity withNSES analyzed as a covariate demonstrated a similar difference in PCS (p = 0.008) and VAS (p = 0.003) as reported previously, however in this condition WOMAC is no longer different between NHWP and HP (p = 0.066). When K-L grade is tested as a covariate, WOMAC (p = 0.016), PCS (p = 0.003), and VAS (p < 0.001) remain significantly greater in HP.
Multivariable models
General linear models were computed with Ethnicity as the primary independent variable and NSES and K-L grade included as covariates. These models confirmed that HP had significantly greater PCS (p = 0.005), WOMAC (p = 0.033), and VAS scores (p < 0.001) than NHWP after adjusting for both NSES and K-L grade.
Outcomes by sex
VAS (p = .031) and WOMAC (p = .008) was greater in females when compared to males. Mean VAS in females was 4.27 (STE = .277, CI = 95% [3.73–4.82]) while in males it was 3.42 (STE = .278, CI = 95% [2.86–3.97]). Mean WOMAC in females was 29.28 (STE = 1.694, CI = 95% [25.92–32.64]) and in males was 22.63 (STE = 1.824, CI = 95% [19.00–26.25]). Neither PCS (p = .436) nor K-L grade (p = .737) was significantly different between sexes. However, mean PCS was greater in females (x̄ = 8.25, STE = .906, CI = 95% [6.46–10.05]) when compared to males (x̄ = 7.22, STE = .955, CI = 95% [5.33–9.12]). Analysis of means by Sex*Ethnicity yields no significant difference between WOMAC (.886), PCS (.393), nor VAS (p = .930).
Stratifying by sex and comparing means of primary outcomes was performed (Table 4). In males, HP (x̄ = 3.83, STE = .352, CI = 95% [3.13–4.53]) had greater mean VAS (p = .021) than NHWP (x̄ = 2.42, STE = .360, CI = 95% [1.68–3.16]). Male HP (x̄ = 8.83, STE = 1.260, CI = 95% [6.31–11.34]) had greater PCS (p = .008) than NHWP (x̄ = 3.35, STE = .776, CI = 95% [1.75–4.95]). Male HP (x̄ = 24.38, STE = 2.265, CI = 95% [19.85–28.91]) had nonsignificantly greater WOMAC (p = .136) than NHWP (x̄ = 18.38, STE = 2.870, CI = 95% [12.47–24.30]). Female HP (x̄ = 4.62, STE = .315, CI = 95% [4.00–5.25]) had greater mean VAS (p = .019) than female NHWP (x̄ = 3.08, STE = .521, CI = 95% [2.01–4.16]). In females, there was no significant difference between HP and NHWP in PCS (p = .164) or WOMAC (p = .177); the mean and median for both were not significantly greater in HP females compared to NHWP females. Median comparisons yield the same results, in which median VAS in females are different between HP and NHWP while median PCS and WOMAC scores in HP females do not significantly differ from NHWP.
Table 4: Comparison of outcomes VAS, PCS, WOMAC between HP and NHWP, stratified by sex.
Outcomes by NSES, CCI, height, BMI, age, and KOA location
Comparison of socioeconomic status (SES) by group ethnicity demonstrated a statistically significant difference between the normalized socio-economic status index of HP and NHWP (p = < 0.0001) non-Hispanics more commonly resided in more affluent communities, had greater income and reported greater values in the remaining 8 parameters accounted for in the NSES index. On average, non-Hispanics on average had an NSES value of 66.9 + /- 12.4 while Hispanics resided in areas with an average NSES value of 55.5 + /- 13.6 (Fig 2).
Box and Whisker plot of Neighborhood Socioeconomic Status (NSES) Index, adjacent are heat maps representative of participant address location overlayed on block-distributions for Miami-Dade County, Florida.
Despite these findings, neither NSES (p = 0.091), CCI (p = 0.052), Height(p = 0.173), BMI (p = 0.474), or Age (p = 0.537), had any significant relationship with VAS. BMI demonstrated a direct linear relationship with PCS (p = 0.012), with a R^2^ value of 0.038 and an unstandardized beta value of 0.276. NSES (p = 0.676), CCI (p = 0.849), Height(p = 0.228), and Age (p = 0.977), showed no relationship with PCS. BMI demonstrated a positive relationship with WOMAC as well (p < 0.001), with a R^2^ value of 0.058 and an unstandardized beta value of 0.676. None of NSES (p = 0.382), CCI (p = 0.895), Height(p = 0.0.59), nor Age (p = 0.111), had a relationship with WOMAC. Both Age (p < 0.001, R^2^ = 0.207, B = 0.045) and BMI (p < 0.001, R^2^ = 0.052, B = 0.045) were positively associated with K-L grade. R^2^ value 0.207 for Age, and 0.052 for BMI. NSES demonstrated a negative association with VAS (p = 0.028, R^2^ = 0.025, B = −0.03), but no significant relationship with PCS (p = 0.190), WOMAC (p = 0.116), or K-L grade (p = 0.353). When NSES is modeled with VAS and stratified by ethnicity, the significant linear relationship no longer exists (Table 5).
Table 5: ANOVA testing evaluating the effect of NSES on VAS between HP and NHWP.
In the HP group, there was a comparable prevalence of tricompartmental, medial, and bicompartmental (medial and patellofemoral) OA with percentages of 37%, 31%, and 25% respectively. For the NHWP group, 64% of subjects’ radiographs demonstrated tricompartmental OA, 24% depicted medial compartment OA and 7% were bicompartmental (medial and patellofemoral) (Table 6).
Table 6: Experimental data of Hispanic and Non-Hispanic White subjects included in the study. Measurements are reported as % (n).
Discussion
In the present study, we recruited three times as many HP compared to NHWP with KOA. Therefore, our sample accurately reflects the ethnicity distribution of people in southeastern Florida and builds upon recent studies that, perhaps for the first time, begin to elucidate the burden of KOA in HP [52,53]. Our findings that HP reported greater VAS, PCS and WOMAC scores compared to NHWP supports our first hypothesis. Perhaps more importantly, the differences between these two groups persisted after controlling for both socioeconomic status and radiographic KOA severity, further highlighting the clinical significance of ethnicity in caring for patients with this chronic disease. Our findings add new insight into the impact of NSES and radiographic grading in Hispanics with KOA, thereby contributing to the growing literature on ethnic differences in the overall burden of KOA.
Previous studies have shown that HP experience higher levels of pain and functional limitations than NHWP. A recent investigation demonstrated that HP reported higher pain and symptom scores despite fewer changes on plain radiographs compared with NHWP with KOA [52]. Interestingly, a recent review by Hollingshead et al concluded that HP report more severe chronic pain, chronic joint pain, average chronic pain over the past week, and fewer pain free days in national surveys [26]. Our observations build upon these studies by showing that HP with KOA continue to report higher levels of pain in surveys when potential confounding variables including NSES and radiographic grading are accounted for, thereby suggested a true need for tailored care.
It has also been shown that Non-Hispanic Black patients similarly report greater values for PCS, VAS, and WOMAC in comparison to NHWP with KOA [25,53–59]. The Dunlop et al. study noted non-Hispanic black and Hispanic older adults reported having symptomatic arthritis at a substantially higher frequency than did non-Hispanic whites [60]. Fabian et al. explored these cultural differences and found that catastrophizing varied by ethnicity, with African Americans reporting greater catastrophizing than Asian/Pacific Islanders and Caucasians [61]. The authors also found that situational catastrophizing significantly mediated pain intensity [61]. Similarly, Bishop et al. associated intensification of pain and a greater level of pain catastrophizing for individuals with chronic low back pain [49]. Dagenias et al. conducted a systematic review for acute lower back pain and arrived at the same conclusion; PCS and pain intensity were positively associated [62]. Furthermore, Miller et al. noted that pain catastrophizing is positively associated with pain experience and functional limitation [63]. Moreover, this association is influenced by ethnicity even after accounting for social economic status (SES) and disease severity [63].
We also evaluated NSES as a possible mediator of pain, pain catastrophizing, and functional limitation in our patients with KOA. Interestingly, we identified that Hispanics tended to be more concentrated in lower NSES communities that were situated more inland within Miami-Dade County, Fla. Non-Hispanic participants tended to reside closer to the county coastline and tended to have greater NSES status. Yet, after pairing individuals based on NSES value, HP reported greater pain, pain catastrophizing, and functional limitations. These differences can likely be explained in part by two prior investigations using the Catastrophizing subscale of the CSQ* that found individuals of Hispanic ethnicity with chronic pain used catastrophizing as a coping method more than NHWP [55,63]. Moreover, we did not analyze the relationships between NSES and PCSs within group therefore a statement of NSES and PCS correlation would be inappropriate. Nevertheless, work by Feldman and others have noted that lower NSES is usually associated with greater PCS scores possibly due to reduced access to healthcare, inadequate treatment, or specific occupational hazards [34].
As K-L grade increased in our patient sample, a worsening VAS, PCS, and WOMAC trend was seen in both NHWP and HP, though this trend was only significant for each outcome in HP. Of note, HP had a greater prevalence of OA in the medial and patellofemoral compartments when compared with NHWP. We propose that this difference in anatomic distribution of OA among the 2 groups may help to account for the differences in VAS [55]. Further study is needed however to confirm our theory and how that may potentially affect treatment and outcome.
The findings of our study may be further explained by theories not tested in our study. Cultural aspects of HPs may play a significant role in the experience of pain. Research has shown that children are more likely to develop chronic pain if their parent or sibling also experiences chronic pain [64]. Therefore, a patient’s experience of chronic pain may be influenced by their kin in a cycle that continues to propagate values higher than NHWP. Additionally, HP tend to work in occupations that expose them to greater levels of safety risk [65], which may play a role in higher reporting to these surveys. Future investigations are required to isolate these variables due to the multifactorial nature of the pain experience in order to further understand why HP report higher than NHWP to these surveys [66]. The findings of our study may also influence future studies done in predominantly Hispanic regions to take ethnicity into account when evaluating pain experience or aid providers in coordinating a unique treatment plan based on patient ethnicity.
As with any study, there are limitations. First, our data collection was carried out at a tertiary clinic, making our patient population biased to those who can access our healthcare center including availability, transportation, and insurance. Second, when utilizing NSES data we inferred individual NSES based on neighborhood values which are an approximation and do not report the individual’s level of education, type of occupation nor individual disposable income among other characteristics. Accordingly, this measurement may be subject to error. In the same vein, our analysis was restricted to Miami-Dade County and failed to include 9 individual NHWP who lived in Broward County and 1 individual who lived in Colorado. Given the limited sample size in the sub analysis (n = 40), the inclusion of these individuals would likely have influenced study results. Moreover, we used a cross-sectional study design where our evaluation of pain was at single time point that is likely not representative of the individual patient’s overall pain experience. Our study however has several strengths. Participant sampling was conducted in Miami-Dade County, Florida, with a large diaspora of the Hispanic population providing greater access to this minority population and to our knowledge the largest sample size to date of this minority group. Our data collection tools have been validated for Hispanic persons and were administered in a culturally competent manner. Finally, our GIS application for NSES has been previously utilized as a measure for NSES in various populations, including Hispanic persons [34].
Conclusion
Disparities in the treatment of patients with OA involving different racial, ethnic, and socioeconomic groups are well described [67]. We examined the pain experience of HP and NHWP presenting with symptomatic KOA and demonstrated that differences between the 2 groups are significant for VAS, PCS and WOMAC, which persisted after controlling for NSES and K-L grade. This observation highlights the impact of both K-L grade and NSES on pain, function, and pain catastrophizing coping for individuals with KOA. Given that the treatment of individuals with OA is based largely on patient reported symptoms, our findings suggest including a PCS inventory that provides information to the expected severity pain experience may be of value in the assessment and treatment of Hispanic patients.
The reference list from the paper itself. Each links out to its DOI / PubMed record.
- 1Lane NE, Brandt K, Hawker G, Peeva E, Schreyer E, Tsuji W, et al. OARSI-FDA initiative: defining the disease state of osteoarthritis. Osteoarthritis Cartilage. 2011;19(5):478–82. doi: 10.1016/j.joca.2010.09.013 21396464 · doi ↗ · pubmed ↗
- 2Reyes C, Leyland KM, Peat G, Cooper C, Arden NK, Prieto-Alhambra D. Association between overweight and obesity and risk of clinically diagnosed knee, hip, and hand osteoarthritis: a population-based cohort study. Arthritis Rheumatol. 2016;68(8):1869–75. doi: 10.1002/art.39707 27059260 PMC 4966641 · doi ↗ · pubmed ↗
- 3Leyland KM, Gates LS, Sanchez-Santos MT, Nevitt MC, Felson D, Jones G, et al. Knee osteoarthritis and time-to all-cause mortality in six community-based cohorts: an international meta-analysis of individual participant-level data. Aging Clin Exp Res. 2021;33(3):529–45. doi: 10.1007/s 40520-020-01762-2 33590469 PMC 7943431 · doi ↗ · pubmed ↗
- 4Cisternas MG, Murphy L, Sacks JJ, Solomon DH, Pasta DJ, Helmick CG. Alternative methods for defining osteoarthritis and the impact on estimating prevalence in a US population-based survey. Arthritis Care Res (Hoboken). 2016;68(5):574–80. doi: 10.1002/acr.22721 26315529 PMC 4769961 · doi ↗ · pubmed ↗
- 5Deshpande BR, Katz JN, Solomon DH, Yelin EH, Hunter DJ, Messier SP, et al. Number of persons with symptomatic knee osteoarthritis in the US: impact of race and ethnicity, age, sex, and obesity. Arthritis Care Res (Hoboken). 2016;68(12):1743–50. doi: 10.1002/acr.22897 27014966 PMC 5319385 · doi ↗ · pubmed ↗
- 6Cruz-Almeida Y, Sibille KT, Goodin BR, Petrov ME, Bartley EJ, Riley JL 3rd, et al. Racial and ethnic differences in older adults with knee osteoarthritis. Arthritis Rheumatol. 2014;66(7):1800–10. doi: 10.1002/art.38620 24729357 PMC 4077911 · doi ↗ · pubmed ↗
- 7Reyes AM, Katz JN. Racial/Ethnic and socioeconomic disparities in osteoarthritis management. Rheum Dis Clin North Am. 2021;47(1):21–40. doi: 10.1016/j.rdc.2020.09.006 34042052 PMC 8161947 · doi ↗ · pubmed ↗
- 8Cross M, Smith E, Hoy D, Nolte S, Ackerman I, Fransen M, et al. The global burden of hip and knee osteoarthritis: estimates from the global burden of disease 2010 study. Ann Rheum Dis. 2014;73(7):1323–30. doi: 10.1136/annrheumdis-2013-204763 24553908 · doi ↗ · pubmed ↗