Measured spectrum environment map dataset with multi-radiation sources in urban scenarios
Haotian Zou, Qiuming Zhu, Qianhao Gao, Jie Wang, Zhipeng Lin, Yang Huang, Qihui Wu, Weizhi Zhong

TL;DR
This paper introduces a detailed dataset of radio signal strengths in urban areas with multiple radiation sources.
Contribution
The novelty lies in providing a high-resolution, multi-source urban spectrum dataset for realistic wireless research.
Findings
The dataset covers 30 MHz, 115 MHz, and 2 GHz frequency bands with 1m×1m spatial resolution.
It captures non-linear propagation characteristics in multi-source urban environments.
Applications include improving wireless channel models and optimizing network performance.
Abstract
This paper presents a measured spectrum strength dataset in the urban scenario with multiple radiation sources, aiming to address the limitation of open datasets for spectrum environment map (SEM) in realistic multi-source dynamic scenarios. The dataset was collected through high-precision measurements, covering the 30 MHz, 115 MHz, and 2 GHz frequency bands, with a spatial resolution of 1m×1 m. It includes spectrum strength or received signal strength (RSS) data in dBm for 80×105 grids. Each grid includes the information such as longitude, latitude, altitude, and time. The experiment utilizes three radiation sources with isotropic antennas and a mobile signal receiving system equipped with a spectrum analyzer and a GPS module. It collects data along a pre-defined path at a constant speed. The key feature of this dataset is its realistic representation of nonline ar characteristics of…
Genes, proteins, chemicals, diseases, species, mutations and cell lines named across the full text — each resolved to its canonical identifier and authoritative record.
Click any figure to enlarge with its caption.
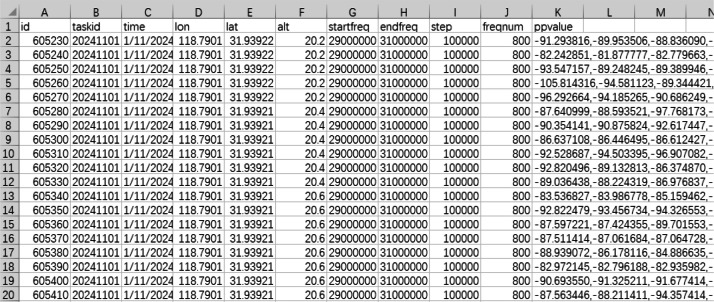 Figure 1
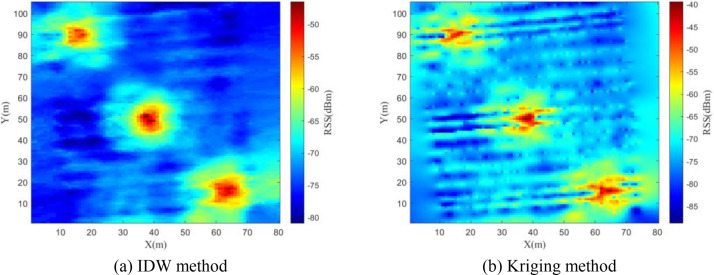 Figure 2
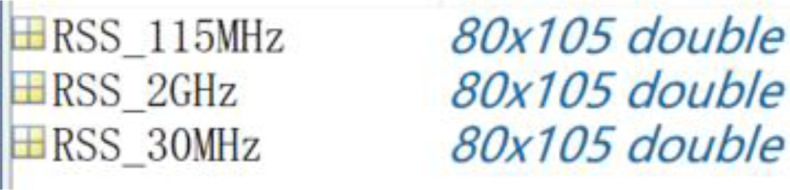 Figure 3
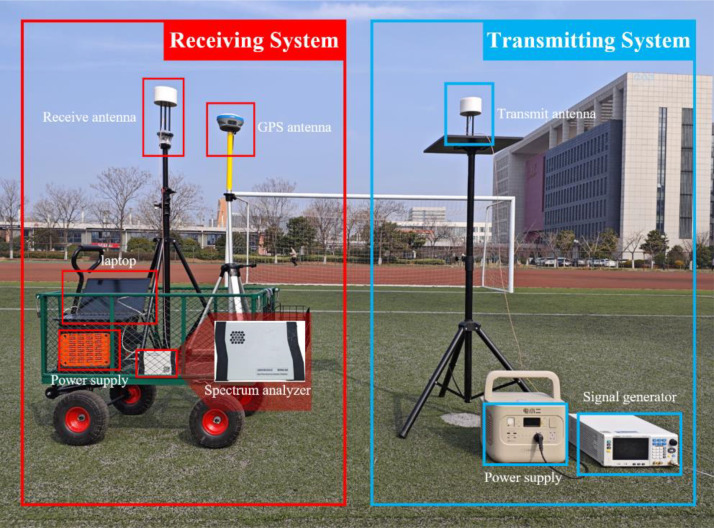 Figure 4
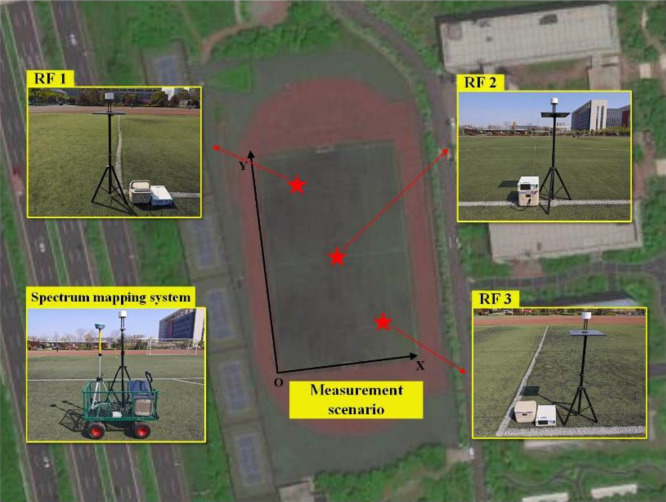 Figure 5
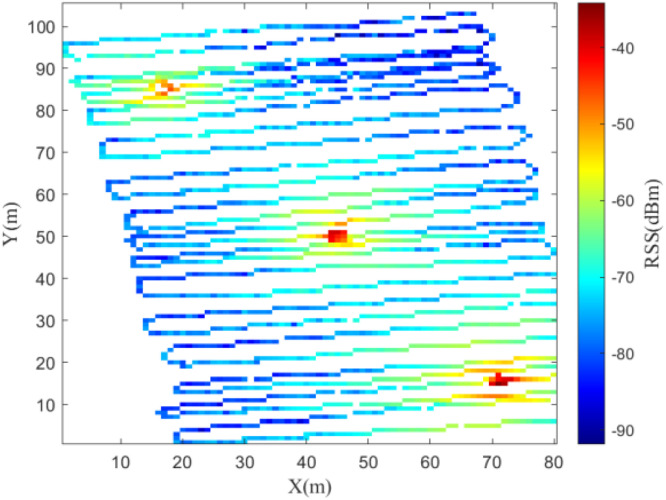 Figure 6
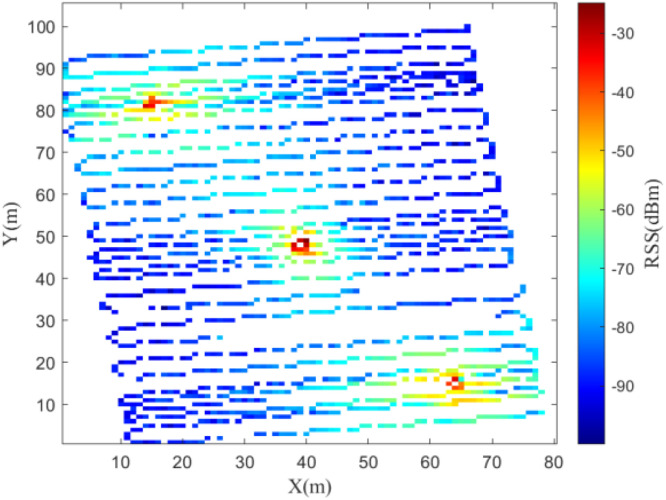 Figure 7
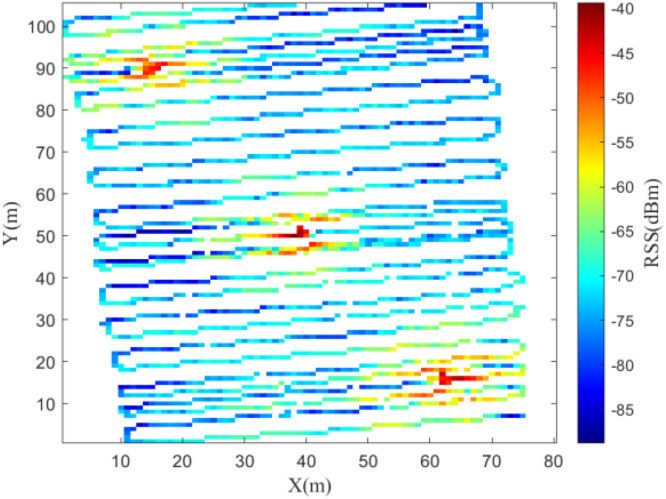 Figure 8
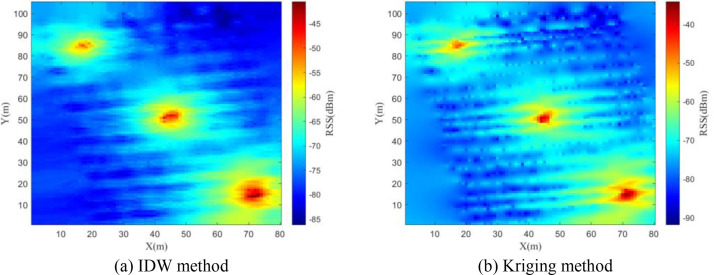 Figure 9
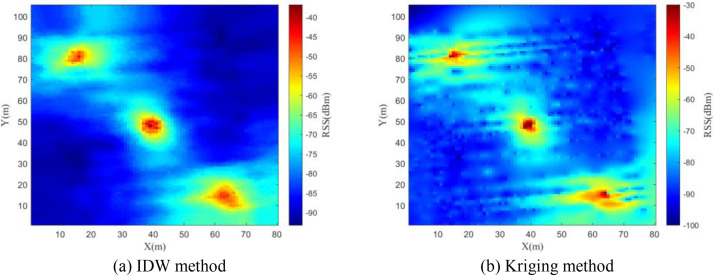 Figure 10
Peer Reviews
No public reviews on file for this paper yet. If you reviewed it on a platform where reviews are public (OpenReview, ICLR, NeurIPS, ICML), you can paste yours below so the community can read it here.
Videos
No videos yet. Explain this paper in a talk, walkthrough, or lecture? Add one.
Taxonomy
TopicsUAV Applications and Optimization · Video Surveillance and Tracking Methods · Telecommunications and Broadcasting Technologies
Specifications TableSubjectComputer SciencesSpecific subject areaTelecommunication EngineeringType of dataRaw dataset, TableData collectionThe hardware used in this article includes three transmission systems with isotropic antennas and one mobile signal receiving system. Each set of transmission system consists of one power supply, one signal generator and one isotropic antenna. The signal receiving system contains one spectrum analyzer, one laptop equipped with 32GB memory and an Intel Core i5–12500H processor, one isotropic antenna and one GPS module. The software used is independently developed using the graphical user interface (GUI) development tool of MATLAB. Multiple signal measurement experiments were conducted in urban scenarios with multiple radiation sources. The collected data are stored in .csv and .mat file formats.Data source locationInstitution: Nanjing University of Aeronautics and AstronauticsCity/Town/Region: Jiangning District, Nanjing CityCountry: ChinaLatitude and longitude (GPS coordinates) for collected samples/data: 118.795806, 31.943062Data accessibilityRepository name: Mendeley DataData identification number: 10.17632/9wfy8pcxdb.1Direct URL to data: https://data.mendeley.com/datasets/9wfy8pcxdb/1Related research articleCompared to [12], which uses a dataset from a similar scenario at a single frequency (1300 MHz) and lacks detailed measurement procedures, this work provides more comprehensive multi-frequency measurements, along with thorough documentation of the measurement setup and parameters.
Value of the Data
1
- •This dataset provides the measured spectrum strength data of urban scenarios, covering the RSS distribution at different spatial positions. It provides reliable empirical support for the study of propagation channel characteristics. [[1], [2]]
- •The SEM information provided by this dataset is helpful for conducting comparative analysis and evaluation of existing and new algorithms for SEM completion and prediction. [[3], [4], [5]]
- •This dataset is collected based on consistent hardware and software setup, with file formats of .csv and .mat. This ensures the reliability and reproducibility of the data, enabling it to provide high-quality measured data for both the academic community and the industrial sectors.
- •The dataset can facilitate the optimization of wireless networks in intelligent urban environments, such as the deployment of Wi-Fi, cellular networks and sensor networks. Through RSS analysis, it can enhance the coverage effect of wireless networks and improve user experience and system performance. Moreover, by integrating with AI models for smart cities, this dataset can support intelligent tasks such as interference detection and dynamic spectrum allocation, thereby enabling more efficient wireless network management in smart cities. [[6], [7]]
- •This dataset reflects the real-world spectrum distribution under scenarios of multi-source coexistence, providing a valuable reference for regulatory planning for electromagnetic interference and the formulation of spectrum policies for next-generation communication systems.
Background
2
With the rapid advancement of wireless communication technologies, the Internet of Things (IoT) and low-altitude aviation operations, the efficient management of electromagnetic spectrum resources has become increasingly challenging [[8], [9]]. The spectrum environment map (SEM), serving as an intuitive depiction of spatial electromagnetic field distribution, has proven to be of significant value in domains including dynamic spectrum sharing, interference mitigation, and radio environment perception [10]. This is particularly relevant given the pressing application requirements in unmanned aerial vehicle (UAV) communication, IoT node localization, and 5G/6 G network optimization[11]. However, existing publicly available datasets predominantly focus on signal acquisition from single radiation sources or static environments. In contrast, real-world complex electromagnetic environments commonly feature multiple radiation sources (e.g., base stations, Wi-Fi access points, sensor nodes). Furthermore, simulation-based data derived from theoretical propagation models often falls short in accurately capturing the channel characteristics in complex environments. Consequently, the development of a high-precision multi-radiation source RSS measured dataset can provide support for channel propagation characteristics, SEM construction and prediction algorithms, and urban wireless network optimization, etc.
Data Description
3
This research, targeting the complex electromagnetic environment with multiple radiation sources, proposes a measured RSS dataset for SEM construction. RSS data of 30 MHz, 115 MHz and 2 GHz were collected using measurement equipment and stored in real time. The stored data were saved in CSV format and included longitude, latitude, altitude, time, collected frequency points, and RSS. Detailed data specifications are provided in Table 1 and the data format is shown in Fig. 1.Table 1. Description of each field of the collected data.Table 1. FieldDescriptionidThe number of each piece of data collectedtaskidId of the collection tasktimeThe exact time when the data was received.lonThe longitude of the receiver at the time of receiving this datalatThe latitude of the receiver at the time of receiving this dataaltThe altitude of the receiver at the time of receiving this datastartfreqThe starting frequency of data collectionendfreqThe termination frequency of the data collectionstepThe frequency interval of data acquisition within the set frequency bandfreqnumThe number of frequency points collected in the set frequency bandppvalueThe collected received signal strength dataFig. 1Snapshot of the .csv file from the 30 MHz experiment.Fig 1
The SEM of the urban scenario is stored in .mat format, which is obtained by processing the original .csv files. The RSS data collected is stored in a 80×105 matrix, where x and y represent the spatial grid dimensions, and the values are of double type, indicating the signal strength (unit: dBm). Each file is about 18 KB in size. These files are suitable for the data call requirements of scientific computing environments such as MATLAB. Users can directly access the data content through the import function of the corresponding platform. Fig. 2 shows a screenshot of the MATLAB workspace after the file is imported.Fig. 2. Snapshot of MATLAB workspace.Fig 2
This dataset is published under the CC BY 4.0 license, allowing free sharing and use provided the original authors are credited. The dataset complies with the GB/T 19710.1-2023 and GB/T 31074-2014 metadata standards.
Experimental Design, Materials and Methods
4
Hardware setup
4.1
The measurement device consists of three sets of signal transmission systems and one set of signal receiving system. Each set of signal transmission system includes a power supply, a signal generator and an isotropic antenna, as shown in Fig. 3. The signal receiving system comprises: a spectrum analyzer, a laptop with 32GB memory and an Intel Core i5–12500H processor, an isotropic antenna and a GPS module.Fig. 3. Hardware setup for data collection.Fig 3
Software setup
4.2
The software is independently developed using the graphical user interface (GUI) development tool of MATLAB. This software aims to achieve efficient processing, situation reconstruction, and performance evaluation of collected spectrum data. The software consists of two parts: the data acquisition module and the SEM construction module.
In the data acquisition module, parameters such as the starting frequency, ending frequency, and frequency interval of the collected signals can be set to determine the spectrum range and resolution. The detailed configuration parameters of the spectrum analyzer are presented in Table 2.Table 2. Configuration parameters of the spectrum analyzer.Table 2. Parameter categoryConfiguration valueCenter frequency30 MHz\115 MHz\2.0 GHzStarting frequency29 MHz\114 MHz\1.999 GHzTermination frequency31 MHz\116 MHz\2.001 GHzResolution bandwidth100 kHzVideo bandwidth10 kHzReference level0 dBmDetectorRMS
Additionally, to compensate for the energy loss of the signals during their transmission within the equipment (such as transmission lines, amplifiers, and connectors.), the collected data is corrected. According to the signal propagation model, the received signal power can be expressed as
where is the transmitted signal power, and are the gains of the transmitting and receiving antennas, is the path loss, and is the system loss that needs to be obtained. Based on the free-space propagation model, the path loss can be calculated as
where is the transmission frequency, and is the distance between the transmitter and the receiver. Accordingly, the system loss can be calculated to adjust the measured RSS values, ensuring that the corrected data more accurately reflects the real signal strength.
The SEM construction module can construct a complete spectrum environment map using the completion algorithms based on the collected RSS data.
Experimental procedure
4.3
The measurement area covers a rectangular region of 80 m × 105 m, consisting of different types of buildings with heights from 10–30 m, open grassland, trees, and roads. The tests were conducted in the morning under favorable weather conditions. As illustrated in Fig. 4, three sets of signal transmission systems are sequentially deployed at the designated positions in the measurement area. Table 3 summarizes all the important parameters. The RSS is collected in real time by a signal receiving system. It moves at a constant speed of 1 m per second along an ``S'' shaped route, starting from one end of measurement area until the entire area is covered. The signal receiving system traverses the measurement area exhaustively without path repetition, ensuring comprehensive yet non-redundant data collection for precise signal strength mapping.Fig. 4. Different realistic views of the playground for conducting experiments.Fig 4. Table 3Measurement parameters.Table 3parameter valuesSerial Numberheight (m)Horizontal position (m)Vertical position (m)Power (dBm)Antenna typeSource configuration10.6289010isotropic20.6505810isotropic30.6782510isotropicMeasured region80m105mSignal frequency2GHz,115MHz,30MHzReceiving system’s height1mGrid size1m1m
In experiments with different frequencies, the positions remain fixed. The frequency of signal generator and spectrum analyzer are changed. Fig. 5, Fig. 6, Fig. 7 show the trajectories in the field when the frequencies are set to 30 MHz, 115 MHz, and 2 GHz respectively. The entire map is regarded as 80×105 grids, with each grid cell colored according to its RSS value. Each grid represents a size of 1 m*1 m in reality.Fig. 5. Trajectory of data collection in the 30 MHz experiment.Fig 5. Fig. 6Trajectory of data collection in the 115 MHz experiment.Fig 6. Fig. 7Trajectory of data collection in the 2 GHz experiment.Fig 7
This dataset can be used for the construction and prediction of SEMs, providing data training, performance verification and evaluation benchmarks for different algorithms. Additionally, it can be utilized to study wireless channel modeling, propagation characteristic analysis and communication environment cognition, as well as network optimization and resource management.
In the research of constructing SEMs based on this dataset, we adopted the inverse distance weighting (IDW) and kriging interpolation methods within the SEM construction module. Fig. 8, Fig. 9, Fig. 10 respectively present the constructed SEMs of 30 MHz, 115 MHz and 2 GHz frequency bands. The experimental results demonstrate that the SEM constructed using IDW method significantly outperforms the Kriging interpolation method in terms of reconstruction accuracy and computational efficiency.Fig. 8. Constructed REM at 30MHz.Fig 8. Fig. 9Constructed REM at 115MHz.Fig 9. Fig. 10Constructed REM at 2GHz.Fig 10
Limitations
None.
Ethics Statement
The authors have read and follow the ethical requirements for publication in Data in Brief and confirming that the current work does not involve human subjects, animal experiments, or any data collected from social media platforms.
CRediT Author Statement
Haotian Zou: Data curation, Writing - original draft, Software. Qiuming Zhu: Conceptualization, Methodology, Writing - review & editing. Qianhao Gao: Software, Validation. Jie Wang: Data curation, Investigation. Zhipeng Lin: Resources. Yang Huang: Resources. Qihui Wu: Supervision. Weizhi Zhong: Project administration.
The reference list from the paper itself. Each links out to its DOI / PubMed record.
- 1Mao K.Zhu Q.Wang C.A survey on channel sounding technologies and measurements for UAV-assisted communications[J]IEEE Trans. Instrum. Meas.73202412410.1109/TIM.2024.3436128 · doi ↗
- 2Hua B.Han L.Zhu Q.Ultra-wideband nonstationary channel modeling for UAV-to-ground communications[J]IEEE Transactions on Wireless Communications 202510.1109/TWC.2025.3537766 · doi ↗
- 3Zhao Y.Zhu Q.Lin Z.Temporal prediction for spectrum environment maps with moving radiation sources[J]IET Commun.175202353854810.1049/cmu 2.12560 · doi ↗
- 4Wang J.Zhu Q.Lin Z.Sparse bayesian learning-based hierarchical construction for 3D radio environment maps incorporating channel shadowing[J]IEEE Transac. Wireless. Commun.23102024145601457410.1109/TWC.2024.3416447 · doi ↗
- 5Yeduri S.R.Kumar A.Pandey O.J.Spectrum cartography techniques, challenges, opportunities, and applications: a survey [J]Pervasive Mob. Comput.79202110151110.1016/j.pmcj.2021.101511 · doi ↗
- 6Denkovski D.Rakovic V.Atanasovski V.Power and channel optimization for Wi Fi networks based on REM data[J]Wireless Pers. Commun.9720171753177910.1007/s 11277-017-4655-8 · doi ↗
- 7Zhong W.Zhang L.Jin H.Image-based beam tracking with Deep learning for mm Wave V 2I communication systems[J]IEEE Transac. Intell. Transport. Syst.25112024191101911610.1109/TITS.2024.3438875 · doi ↗
- 8Shrestha R.Romero D.Chepuri S.P.Spectrum surveying: active radiomap estimation with autonomous UA Vs[J]IEEE Transac. Wireless. Commun.221202362764110.1109/TWC.2022.3197087 · doi ↗