Correction: Electrical impedance tomography-guided the optimal awake prone position in a moderate ARDS patient
Yongzhen Sun, Jiale Tao, Jinjun Jiang, Shujing Chen

Abstract
Genes, proteins, chemicals, diseases, species, mutations and cell lines named across the full text — each resolved to its canonical identifier and authoritative record.
Click any figure to enlarge with its caption.
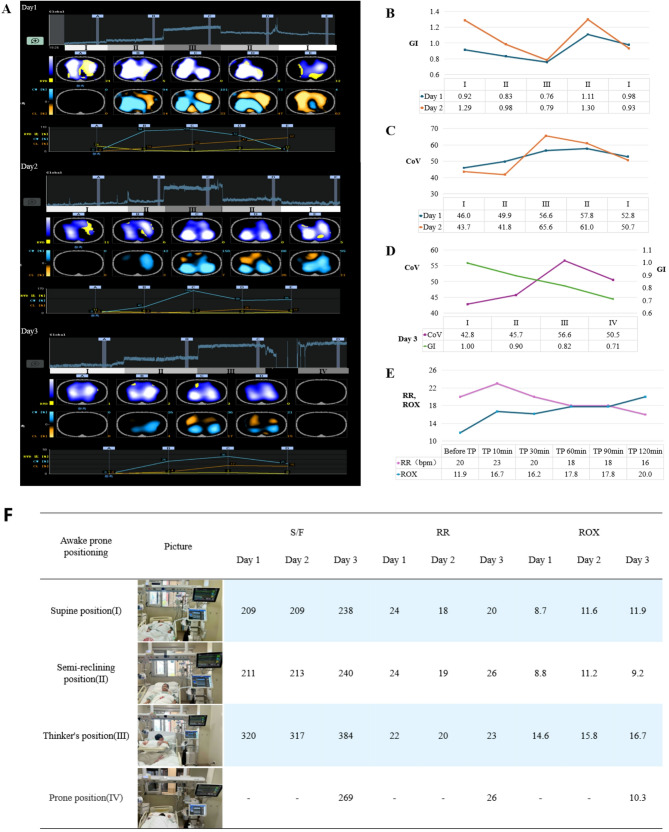 Figure 1
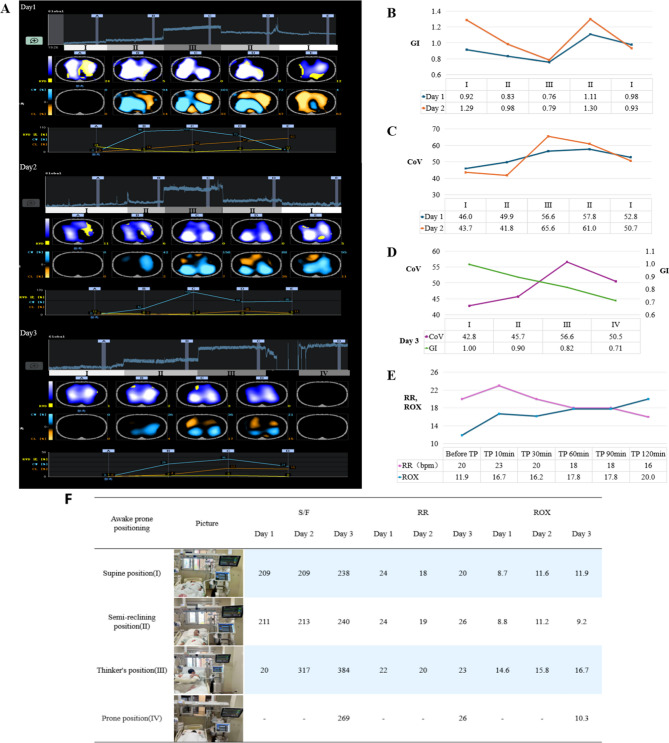 Figure 2
Peer Reviews
No public reviews on file for this paper yet. If you reviewed it on a platform where reviews are public (OpenReview, ICLR, NeurIPS, ICML), you can paste yours below so the community can read it here.
Videos
No videos yet. Explain this paper in a talk, walkthrough, or lecture? Add one.
Taxonomy
TopicsHemodynamic Monitoring and Therapy · Electrical and Bioimpedance Tomography
Correction: Crit Care (2025) 29:95 10.1186/s13054-025-05332-8
Following publication of the original article [1], the authors identified an error in Fig. 1F. Thinker’s position should be 320, however it appeared as 20. Both the incorrect and correct Fig. 1 is given hereafter.
The incorrect Fig. 1:
Fig. 1 Changes in lung ventilation status and S/F, RR, and ROX of the patient in different positions under EIT monitoring. A shows the EIT images from the first day to the third day. The images in each panel from top to bottom are: global impedance waveforms, tidal impedance variation distribution (RVD: region ventilation delay, in yellow), difference image (CW: compliance win, in turquoise; CL: compliance loss, in orange), and data trend chart. (I), (II), (III), and (IV) in Figure A represent the supine position, semi-recumbent position, “Thinker’s position”, and prone position respectively, and each position was maintained for 10 min. B shows the changes in the global inhomogeneity index (GI) of the lungs in different positions monitored by EIT on the first and second days.** C** shows the changes in the ventilation center (CoV) of the lungs in different positions monitored by EIT on the first and second days.** D **shows the changes in GI and CoV of the lungs in different positions monitored by EIT on the third day. E shows the changes in the patient’s respiratory rate and ROX index during the 2-h maintenance of the“Thinker’s position (TP)”. F shows the changes in S/F, RR, and ROX of the patient in different positions from the first day to the third day
The correct Fig. 1:Fig. 1. Changes in lung ventilation status and S/F, RR, and ROX of the patient in different positions under EIT monitoring. A shows the EIT images from the first day to the third day. The images in each panel from top to bottom are: global impedance waveforms, tidal impedance variation distribution (RVD: region ventilation delay, in yellow), difference image (CW: compliance win, in turquoise; CL: compliance loss, in orange), and data trend chart. (I), (II), (III), and (IV) in Figure A represent the supine position, semi-recumbent position, “Thinker’s position”, and prone position respectively, and each position was maintained for 10 min. B shows the changes in the global inhomogeneity index (GI) of the lungs in different positions monitored by EIT on the first and second days.** C** shows the changes in the ventilation center (CoV) of the lungs in different positions monitored by EIT on the first and second days.** D **shows the changes in GI and CoV of the lungs in different positions monitored by EIT on the third day. E shows the changes in the patient’s respiratory rate and ROX index during the 2-h maintenance of the“Thinker’s position (TP)”. F shows the changes in S/F, RR, and ROX of the patient in different positions from the first day to the third day
Figure 1(F) has been updated in this correction article and the original article [1] has been corrected.