The Association Between Thromboembolic Events and ALK , ROS1 , RET Rearrangements or EGFR Mutations in Patients With Advanced Lung Adenocarcinoma: A Retrospective Cohort Study
Xiaohan Qian, Mengjiao Fu, Jing Zheng, Junjun Chen, Cuihong Cai, Jianya Zhou, Jianying Zhou

TL;DR
This study found that patients with ROS1 gene rearrangements in lung cancer have a higher risk of blood clots, especially around the time of diagnosis.
Contribution
The study identifies ROS1 rearrangements as a novel risk factor for thromboembolic events in lung adenocarcinoma patients.
Findings
ROS1 rearrangements were significantly associated with increased thromboembolic event risk.
Thromboembolic events occurred most frequently during the peri-diagnostic period in ROS1-positive patients.
Multiple comorbidities and elevated CRP levels were additional risk factors for thromboembolic events.
Abstract
Previous studies have reported inconsistent findings regarding the associationbetween ALK and ROS1 rearrangements in lung cancer and thromboembolic risk. This retrospective study aimed to investigate this association in advanced lung adenocarcinoma patients with ALK, ROS1, RET rearrangements, and EGFR mutations. We retrospectively collected information on patients with advanced lung adenocarcinoma in the First Affiliated Hospital of Zhejiang University School of Medicine from January 2013 to March 2021. All patients with confirmed ALK, ROS1, or RET rearrangements, as well as a comparison cohort of those with EGFR mutation, were included. Clinical characteristics were analyzed, and the association between driver genes and TE risks was analyzed using competing risk and logistic regression. A total of 546 patients were included in the study. Among them, those with ROS1 rearrangements…
Genes, proteins, chemicals, diseases, species, mutations and cell lines named across the full text — each resolved to its canonical identifier and authoritative record.
Click any figure to enlarge with its caption.
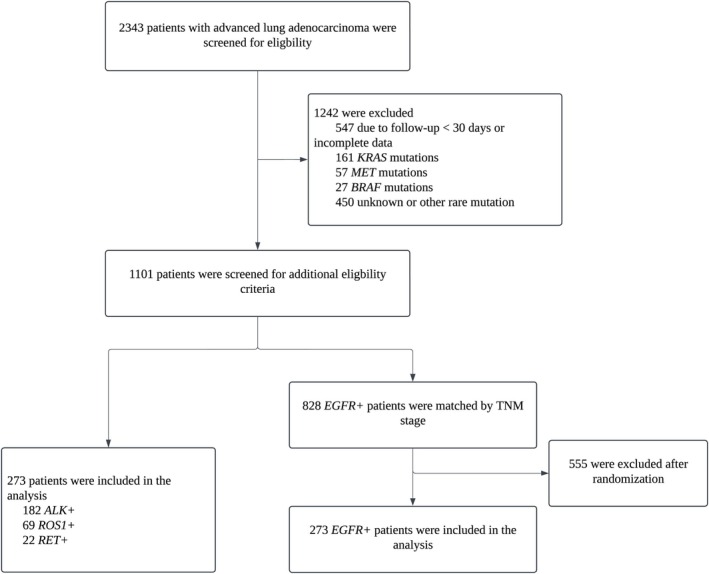 FIGURE 1
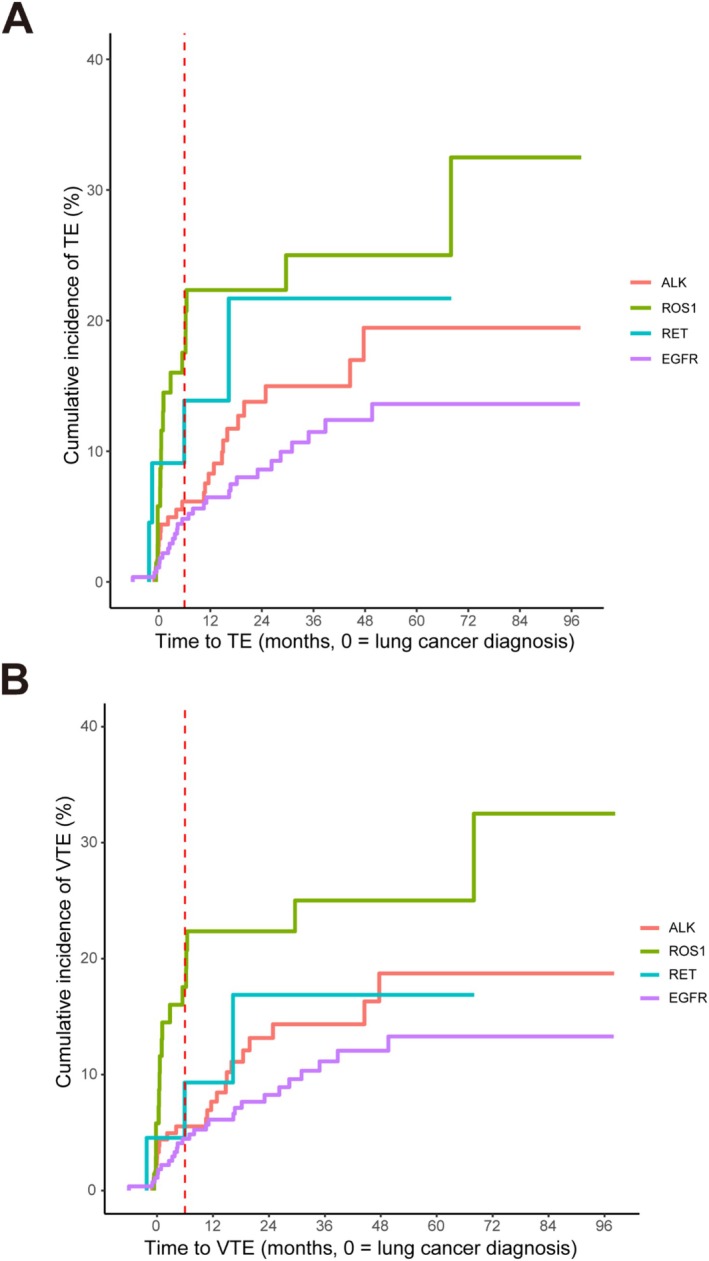 FIGURE 2
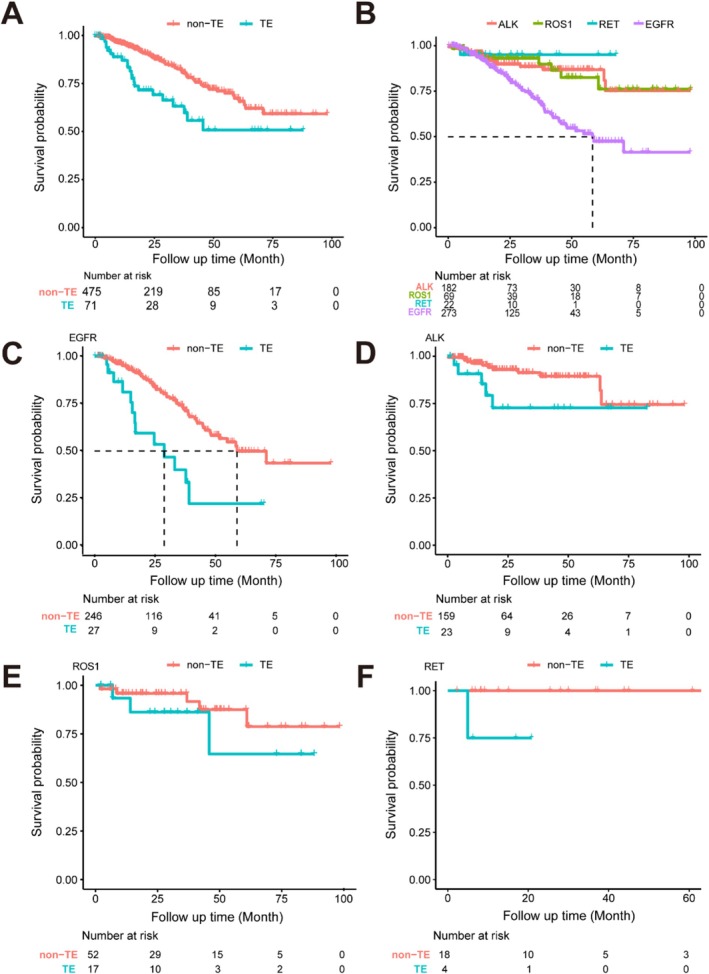 FIGURE 3
|
|
|
|
|
| |
|---|---|---|---|---|---|
| Sex (%) | 0.327 | ||||
| Male | 87 (47.8) | 32 (46.4) | 6 (27.3) | 129 (47.3) | |
| Female | 95 (52.2) | 37 (53.6) | 16 (72.7) | 144 (52.7) | |
| Median age (range) | 53 (21–81) | 52 (26–82) | 61 (37–89) | 61 (27–85) |
|
| BMI | 22.9 (21.2–24.5) | 23.6 (21.6–25.9) | 23.3 (21.7–24.7) | 22.3 (20.3–24.8) | 0.111 |
| ECOG (%) | 0.523 | ||||
| 0–1 | 141 (77.5) | 56 (81.2) | 16 (72.7) | 232 (85.0) | |
| 2–4 | 41 (22.5) | 13 (18.8) | 6 (27.3) | 41 (15.0) | |
| Smoking status (%) | 0.866 | ||||
| Never | 130 (71.4) | 47 (68.1) | 15 (68.2) | 185 (67.8) | |
| Former/current | 52 (28.6) | 22 (31.9) | 7 (31.8) | 88 (32.2) | |
| Stage (%) | 0.844 | ||||
| IIIB‐IIIC | 29 (15.9) | 12 (17.4) | 3 (13.6) | 44 (16.1) | |
| IVA | 53 (29.1) | 22 (31.9) | 11 (50.0) | 86 (31.5) | |
| IVB | 100 (54.9) | 35 (50.7) | 8 (36.4) | 143 (52.4) | |
| Number of comorbidities (%) | 0.110 | ||||
| 0–1 | 174 (95.6) | 61 (88.4) | 19 (86.4) | 247 (90.5) | |
| ≥ 2 | 8 (4.4) | 8 (11.6) | 3 (13.6) | 26 (9.5) | |
| Khorana Score (%) |
| ||||
| 1–2 | 172 (94.5) | 65 (94.2) | 22 (100.0) | 271 (99.3) | |
| ≥ 3 | 10 (5.5) | 4 (5.8) | 0 (0.0) | 2 (0.7) | |
| ONKOTEV Score (%) |
| ||||
| 0–1 | 107 (58.8) | 37 (53.6) | 16 (72.7) | 215 (78.8) | |
| ≥ 2 | 75 (41.2) | 32 (46.4) | 6 (27.3) | 58 (21.2) | |
| Median follow‐up time (IQR) | 19 (10–43) | 28 (12–50) | 19 (8–37) | 23 (12–39) | 0.103 |
| TE (%) | 29 (15.9) | 24 (34.8) | 7 (31.8) | 36 (13.2) |
|
|
|
|
|
|
| |
|---|---|---|---|---|---|
| Longest diameter of the primary lesion (cm) (Median, IQR) | 3.1 (2.1–4.5) | 3.3 (1.9–5.0) | 2.8 (1.6–3.8) | 3.4 (1.7–4.6) |
|
| Location of the primary lesion (%) | 0.055 | ||||
| Peripheral | 112 (61.5) | 47 (68.1) | 18 (81.8) | 197 (72.2) | |
| Central/mediastinum | 70 (38.5) | 22 (31.9) | 4 (18.2) | 76 (27.8) | |
| Short diameter of mediastinal lymph nodes (cm) (Median, IQR) | 1.4 (1.0–1.8) | 1.3 (1.0–1.9) | 1.2 (0.7–1.8) | 1.0 (0.0–1.4) |
|
|
|
| ||||
| N0–2 | 72 (39.6) | 16 (23.2) | 8 (36.3) | 164 (60.1) | |
| N3 | 110 (60.4) | 53 (76.8) | 14 (63.6) | 109 (39.9) | |
| Serous cavity effusions (%) | |||||
| Pleural effusions | 72 (39.6) | 40 (58.0) | 9 (40.9) | 126 (46.2) | 0.067 |
| Pericardial effusions | 28 (15.4) | 12 (17.4) | 2 (9.1) | 22 (8.1) |
|
| Number of distant metastatic sites (%) | 0.812 | ||||
| 0 | 58 (31.9) | 23 (33.3) | 9 (40.9) | 101 (37.0) | |
| 1–2 | 102 (56.0) | 40 (58.0) | 11 (50.0) | 141 (51.6) | |
| ≥ 3 | 22 (12.1) | 6 (8.7) | 2 (9.1) | 31 (11.4) | |
| Metastatic sites at diagnosis (%) | |||||
| Lung | 46 (25.3) | 22 (31.9) | 7 (31.8) | 99 (36.3) | 0.107 |
| Brain | 43 (23.6) | 17 (24.6) | 1 (4.5) | 40 (14.7) |
|
| Bone | 61 (33.5) | 16 (23.2) | 4 (18.2) | 113 (41.4) |
|
| Liver | 25 (13.7) | 5 (7.2) | 2 (9.1) | 15 (5.5) |
|
| Lymph nodes | 13 (7.1) | 8 (11.6) | 4 (18.2) | 8 (2.9) |
|
| Adrenal gland | 13 (7.1) | 5 (7.2) | 3 (13.6) | 18 (6.6) | 0.595 |
| Other | 14 (7.7) | 3 (4.3) | 0 (0.0) | 8 (2.9) | 0.106 |
| Systematic therapy (%) | |||||
| TKI (%) | 164 (90.1) | 56 (81.2) | 7 (31.8) | 266 (97.4) |
|
| Chemotherapy (%) | 54 (29.7) | 21 (30.4) | 15 (68.2) | 91 (33.3) |
|
| Immune therapy (%) | 2 (1.1) | 1 (1.4) | 8 (36.4) | 6 (2.2) |
|
| Antiangiogenic therapy (%) | 23 (12.6) | 8 (11.6) | 10 (45.5) | 41 (15.0) |
|
| Radiotherapy (%) | 47 (25.8) | 19 (27.5) | 4 (18.2) | 67 (24.5) | 0.827 |
| Untreated (%) | 11 (6.0) | 11 (15.9) | 4 (18.2) | 3 (1.1) |
|
|
|
|
|
|
| |
|---|---|---|---|---|---|
| White blood cell, ×109/L (%) | 0.149 | ||||
| > 11 | 8 (4.4) | 5 (7.2) | 0 (0.0) | 6 (2.2) | |
| ≤ 11 | 171 (94.0) | 64 (92.8) | 22 (100.0) | 267 (97.8) | |
| Hemoglobin, g/L (%) |
| ||||
| < 100 | 15 (8.2) | 6 (8.7) | 1 (4.5) | 8 (2.9) | |
| ≥ 100 | 164 (90.1) | 63 (91.3) | 21 (95.5) | 265 (97.1) | |
| Platelet, ×109/L (%) |
| ||||
| > 350 | 29 (15.9) | 7 (10.1) | 2 (9.1) | 20 (7.3) | |
| ≤ 350 | 150 (82.4) | 62 (89.9) | 20 (90.9) | 253 (92.7) | |
| Aspartate aminotransferase, U/L (%) | 0.474 | ||||
| > 40 | 14 (7.7) | 3 (4.3) | 1 (4.5) | 12 (4.4) | |
| ≤ 40 | 168 (92.3) | 66 (95.7) | 21 (95.5) | 258 (94.5) | |
| Albumin, g/L (%) | 1.000 | ||||
| < 35 | 21 (11.5) | 6 (8.7) | 1 (4.5) | 34 (12.5) | |
| ≥ 35 | 157 (86.3) | 62 (89.9) | 21 (95.5) | 239 (87.5) | |
| Creatinine, μmol/L (%) | 0.105 | ||||
| > Upper limit of normal creatinine | 7 (3.8) | 2 (2.9) | 2 (9.1) | 23 (8.4) | |
| ≤ Upper limit of normal creatinine | 175 (96.2) | 67 (97.1) | 20 (90.9) | 247 (90.5) | |
| Fibrinogen, g/L (%) | 0.669 | ||||
| > 4 | 66 (36.3) | 21 (30.4) | 6 (27.3) | 90 (33.0) | |
| ≤ 4 | 112 (61.5) | 48 (69.6) | 16 (72.7) | 181 (66.3) | |
| Prothrombin time, second (%) |
| ||||
| > 13.5 | 14 (7.7) | 4 (5.8) | 0 (0.0) | 7 (2.6) | |
| ≤ 13.5 | 164 (90.1) | 65 (94.2) | 22 (100.0) | 265 (97.1) | |
| D‐dimer, μg/L (%) | 0.165 | ||||
| > 1500 | 60 (33.0) | 28 (40.6) | 6 (27.3) | 78 (28.6) | |
| ≤ 1500 | 106 (58.2) | 40 (58.0) | 16 (72.7) | 191 (70.0) | |
| CRP, mg/L (%) |
| ||||
| > 10 | 68 (37.4) | 23 (33.3) | 6 (27.3) | 76 (27.8) | |
| ≤ 10 | 90 (49.5) | 43 (62.3) | 14 (63.6) | 190 (69.6) | |
| CEA, ng/mL (%) |
| ||||
| > 5 | 107 (58.8) | 32 (46.4) | 16 (72.7) | 201 (73.6) | |
| ≤ 5 | 68 (37.4) | 37 (53.6) | 6 (27.3) | 69 (25.3) | |
|
|
|
|
|
| |
|---|---|---|---|---|---|
| Type (%) | |||||
| DVT | 20 (69.0) | 18 (75.1) | 4 (44.4) | 29 (74.4) | 0.382 |
| Upper extremity and neck | 8 (27.6) | 1 (4.2) | 0 (0.0) | 2 (5.1) | |
| Lower extremity and pelvis | 12 (41.4) | 16 (66.7) | 4 (44.4) | 26 (66.7) | |
| Upper and lower extremity | 0 (0.0) | 1 (4.2) | 0 (0.0) | 1 (2.6) | |
| PE | 8 (27.6) | 5 (20.8) | 1 (11.1) | 7 (17.9) | 0.815 |
| Segmental/subsegmental | 0 (0.0) | 2 (8.3) | 0 (0.0) | 2 (5.1) | |
| Above segmental | 8 (27.6) | 3 (12.5) | 1 (11.1) | 5 (12.8) | |
| ATE | 1 (3.4) | 1 (4.2) | 4 (44.4) | 3 (7.7) |
|
| Symptoms present (%) | 0.987 | ||||
| Symptomatic | 21 (72.4) | 18 (75.0) | 7 (77.8) | 27 (69.2) | |
| Asymptomatic | 8 (27.6) | 6 (25.0) | 2 (22.2) | 12 (30.8) | |
| Recurrent TE (%) | 0.309 | ||||
| With anticoagulant treatment | 2 (6.9) | 1 (4.2) | 2 (22.2) | 4 (10.3) | |
| Without anticoagulant treatment | 2 (6.9) | 1 (4.2) | 1 (11.1) | 4 (10.3) | |
| Therapeutic status at TE (%) | |||||
| Untreated | 9 (31.0) | 10 (41.7) | 5 (55.6) | 8 (20.5) | 0.104 |
| TKI | 17 (58.6) | 13 (54.2) | 1 (11.1) | 22 (56.4) | 0.056 |
| Chemotherapy | 2 (6.9) | 0 (0.0) | 3 (33.3) | 9 (23.1) |
|
| Others | 7 (24.1) | 2 (8.3) | 3 (33.3) | 3 (7.7) | 0.067 |
| RECIST assessment at TE (%) |
| ||||
| At diagnosis | 11 (37.9) | 11 (45.8) | 4 (44.4) | 8 (20.5) | |
| Disease progression | 11 (37.9) | 5 (20.8) | 2 (22.2) | 22 (56.4) | |
| Stable disease | 6 (20.7) | 5 (20.8) | 3 (33.3) | 4 (10.3) | |
| Partial response | 1 (3.4) | 3 (12.5) | 0 (0.0) | 5 (12.8) | |
| Median time of TE (days, IQR) | 164 (6–464) | 58 (11–194) | 139 (−9–179) | 315 (71–691) | 0.177 |
| TE in the peri‐diagnostic period OR (95% CI) | TE throughout the course OR (95% CI) | |
|---|---|---|
| Driver gene | ||
|
| 0.77 (0.38–1.59), | 1.32 (0.73–2.38), |
|
| 3.51 (1.68–7.31), | 2.98 (1.51–5.86), |
|
| 2.14 (0.60–7.57), | 2.02 (0.64–6.42), |
| Age | 1.04 (1.01–1.07), | 1.02 (1.00–1.04), |
| BMI (per 1 kg/m2 increase) | 1.06 (0.96–1.17), | 1.07 (0.99–1.16), |
| TNM stage | 0.95 (0.61–1.46), | 0.92 (0.66–1.29), |
| Khorana score (≥ 3 vs. 1–2) | 0.86 (0.11–6.67), | 0.44 (0.06–3.40), |
| ONKOTEV score (≥ 3 vs. ≤ 2) | 2.22 (1.15–4.28), | 1.14 (0.67–1.93), |
| Comorbidities | ||
| Number of comorbidities | 1.87 (1.26–2.75), | 1.51 (1.09–2.09), |
| Risk of cardiovascular disease | 2.24 (1.15–4.35), | 1.82 (1.09–3.03), |
| Hypertension | 2.44 (1.26–4.71), | 2.02 (1.21–3.39), |
| Diabetes | 3.23 (1.25–8.38), | 1.53 (0.61–3.85), |
| Metastatic characteristics at diagnosis | ||
| Short diameter of mediastinal lymph nodes | 1.99 (1.36–2.90), | 1.36 (1.01–1.83), |
| N stage | 1.60 (1.08–2.36), | 1.29 (1.00–1.66), |
| Distant lymph node metastasis | 2.52 (0.91–6.93), | 1.89 (0.79–4.53), |
| Laboratory test at baseline | ||
| D‐dimer (> 1500 μg/L vs. ≤ 1500 μg/L) | 0.67 (0.28–1.57), | 0.61 (0.32–1.19), |
| CRP (> 10 mg/L vs. ≤ 10 mg/L) | 3.48 (1.77–6.82), | 2.58 (1.20–5.56), |
| Firstline treatment | ||
| TKI | 1.10 (0.25–4.92), | 0.49 (0.16–1.51), |
| Chemotherapy | 1.95 (0.71–5.32), | 1.39 (0.75–2.56), |
| Chemotherapy and anti‐angiogenic therapy | NA | 0.56 (0.07–4.31), |
| Anti‐angiogenic therapy | NA | 0.86 (0.37–1.99), |
| Radiotherapy | NA | 1.12 (0.57–2.18), |
| TE in the peri‐diagnostic period OR (95% CI) | TE throughout the course OR (95% CI) | |||
|---|---|---|---|---|
| Univariate analysis | Multivariate analysis | Univariate analysis | Multivariate analysis | |
| Driver genes | ||||
|
| 0.77 (0.38–1.59), | / | 1.32 (0.73–2.38), | / |
|
| 3.51 (1.68–7.31), | 3.17 (2.37–3.97), | 2.98 (1.51–5.86), | 2.45 (1.81–3.09), |
|
| 2.14 (0.60–7.57), | / | 2.02 (0.64–6.42), | / |
| Hypertension | 2.44 (1.26–4.71), | / | 2.02 (1.21–3.39), | 2.00 (1.47–2.54), |
| Number of comorbidities | 1.87 (1.26–2.75), | 1.86 (1.42–2.29), | 1.51 (1.09–2.09), | / |
| Short diameter of mediastinal lymph nodes/cm | 1.99 (1.36–2.90), | 1.69 (1.26–2.12), | 1.36 (1.01–1.83), | / |
| CRP (> 10 mg/L vs. ≤ 10 mg/L) | 3.48 (1.77–6.82), | 2.67 (1.94–3.40), | 2.58 (1.20–5.56), | / |
Peer Reviews
No public reviews on file for this paper yet. If you reviewed it on a platform where reviews are public (OpenReview, ICLR, NeurIPS, ICML), you can paste yours below so the community can read it here.
Videos
No videos yet. Explain this paper in a talk, walkthrough, or lecture? Add one.
Taxonomy
TopicsLung Cancer Treatments and Mutations · Lymphoma Diagnosis and Treatment · Lung Cancer Diagnosis and Treatment
Introduction
1
Thromboembolic events (TEs), encompassing venous thromboembolism (VTE), arterial thromboembolism (ATE) and other related occurrences, are common complications in patients diagnosed with lung cancer [1]. VTE, which includes pulmonary embolism (PE), deep vein thrombosis (DVT) and venous thrombosis at other sites, is a major cause of morbidity and mortality in lung cancer [2, 3]. Compared with cancer patients without VTE, those with VTE face a 3‐ to 5‐fold heightened risk of mortality [4]. Notably, lung cancer has a comparatively elevated risk of VTE compared with other malignant tumors, with an incidence ranging from 7% to 13% [2, 5]. Furthermore, the incidence of thrombosis in adenocarcinoma is three to four times higher than that in squamous cell carcinoma and small‐cell lung cancer [6, 7]. Additionally, lung cancer seems to be associated with an increased risk of ATE, with an incidence ranging from 2% to 9% [8, 9].
Currently, some studies have reported an association between lung cancers with ALK and ROS1 rearrangements and an elevated risk of TEs [10]. However, the results remain controversial [11]. The highest reported incidence of TEs in patients with ALK rearrangements comes from small real‐world cohorts (47%, N = 17; 42%, N = 55) [12, 13]. Nevertheless, the incidence of TEs significantly decreases in larger real‐world cohorts (17%, N = 70; 22%, N = 193) [11, 14]. In cohorts from clinical trials, the reduction was even more pronounced (1%–6%) in patients with ALK fusions [15, 16, 17, 18]. Regarding ROS1 fusions, which share homology with ALK fusions [19, 20], several studies have indicated that patients with ROS1 fusions have a significantly increased risk of TEs [12, 14, 21, 22, 23]. Similarly, prospective randomized controlled clinical trials of ROS1‐TKI did not demonstrate a higher incidence of TEs [15, 16, 18, 24]. ALK, ROS1, and RET are the most frequent recurring kinase fusions identified [25], all belonging to the receptor tyrosine kinase fusion family [26]. It has been reported that patients with RET fusions exhibit similarities to those with ALK and ROS1 fusions in terms of histological characteristics and metastasis patterns [27, 28, 29]. A retrospective analysis found that the incidence of TEs in patients with RET fusions was as high as 48% [30], suggesting that, like ALK and ROS1, RET may also be associated with an increased risk of thromboembolism. However, due to the rarity of RET fusions, further evidence is needed to establish a robust correlation between RET fusions and the elevated risks of thromboembolism.
We conducted a retrospective study of patients with advanced lung adenocarcinoma harboring ALK, ROS1, and RET fusions, comparing them with cohorts harboring EGFR mutations. This study aimed to determine whether ALK, ROS1, and RET rearrangements are associated with increased thromboembolic risk compared to EGFR mutations, particularly during the peri‐diagnostic period (within 6 months before and after diagnosis). Additionally, we assessed TE risk over the entire follow‐up period, examined the influence of clinical features associated with driver gene status on TE occurrence, and analyzed the potential impact of TEs on overall survival (OS).
Methods
2
Study Population
2.1
Patients diagnosed with unresectable, locally advanced, or metastatic ALK+, ROS1+, and RET+ lung adenocarcinoma were identified through a comprehensive search of electronic medical records from January 2013 to March 2021 at the First Affiliated Hospital of Zhejiang University School of Medicine. As a control cohort, patients with EGFR mutations were selected by random stratification of TNM staging at a ratio of 1:1. The cohort with EGFR mutation was chosen as the control cohort to minimize confounding factors. Given the diverse expression of driver genes commonly observed in lung adenocarcinoma populations, selecting an EGFR+ cohort with its homogeneous genetic profile helps avoid the variability introduced by other driver genes. Individuals with other driver genes (e.g., KRAS, BRAF, MET exon 14 skipping) and those with less than 30 days of follow‐up were excluded from the analysis. EGFR mutations were identified by ARMS‐PCR (amplification refractory mutation system–polymerase chain reaction) or next‐generation sequencing (NGS), while ALK, ROS1, and RET rearrangements were detected by fluorescence in situ hybridization (FISH), immunohistochemistry (IHC) and/or NGS. All molecular tests were performed in the hospital's central laboratory following standardized protocols.
Patient Demographics and Risk Factors for TEs
2.2
Data on clinical characteristics, treatment response, and TEs were extracted from electronic medical records. TEs encompass VTE and ATE, with VTE including PE and DVT, and ATE including myocardial infarction and cerebrovascular events. Patients with clinical symptoms underwent imaging studies to confirm the presence of TEs. All incidentally detected TE cases were included in this study and reviewed by a panel of vascular and radiology experts. The last follow‐up date and survival status (alive or deceased) of each participant were recorded for survival analysis.
Other clinical and laboratory variables potentially influencing TE risks were categorized for univariate and multivariable analyses to retain statistical power and facilitate data collection. Among these, the Khorana risk score and the ONKOTEV score were included as key variables. The Khorana risk score, widely validated for assessing VTE risk in patients with cancer receiving chemotherapy [31], comprises five variables: cancer type (including lung cancer), platelet count, hemoglobin level or use of erythropoiesis‐stimulating agents, leukocyte count, and body mass index (BMI). Patients are stratified into low (score of 0), intermediate (score of 1–2), and high‐risk (score ≥ 3) categories. The ONKOTEV score, a more recently validated model, includes a high Khorana score, presence of metastatic disease, vascular or lymphatic compression, and a history of VTE [32]. The risk of cardiovascular disease was assessed according to the COMPASS‐CAT (Computerized Registry of Patients with Solid Tumors for the Assessment of Venous Thromboembolism in Cancer—Clinical Assessment Tool) model for venous thrombosis risk. The factors considered include peripheral artery disease, ischemic stroke, coronary heart disease, hypertension, hyperlipidemia, diabetes mellitus, and obesity (BMI ≥ 30 kg/m^2^) [33].
In accordance with the regulations of the Clinical Research Ethics Committee of the First Affiliated Hospital, Zhejiang University School of Medicine (Approval Number: IIT20220496), this study was approved by the ethics committee, and the requirement for informed consent was waived.
Study Endpoints
2.3
The primary endpoint of the study was the association between TEs and oncogenic driver alterations, specifically ALK, ROS1, and RET rearrangements compared with EGFR mutations, during the peri‐diagnostic period (defined as 6 months before or after the diagnosis of advanced lung adenocarcinoma) in patients with advanced lung adenocarcinoma. This time frame was chosen to minimize potential confounding and capture early thrombotic events potentially related to tumor biology.
Secondary endpoints included: (1) the association between driver gene alterations and TEs over the entire follow‐up period; (2) the cumulative incidence of TEs during both the peri‐diagnostic period and the entire follow‐up period; (3) the identification of additional clinical factors independently associated with TE risks; and (4) OS in the entire cohort and in subgroups stratified by TE occurrence and driver gene status.
Statistical Analysis
2.4
Patient characteristics are presented as median (inter‐quartile range, IQR) for continuous variables and as frequencies for categorical variables. Baseline characteristics were compared using variance analysis, Kruskal‐Wallis test, Fisher's exact test, and the Mantel–Haenszel trend test. p values for pairwise comparisons within groups were adjusted using the Bonferroni method.
The cumulative incidence of TE was calculated from 1 year before cancer diagnosis to the time of TEs, death, or the last medical follow‐up record (November 1, 2021). The peri‐diagnostic period was defined as 6 months before and after the diagnosis of lung adenocarcinoma. The Fine‐Gray competitive risk regression model was used to evaluate the cumulative incidence of TEs [34], with deaths regarded as competing risks.
Univariate and multivariate analyses were performed using logistic regression analysis. We tested for collinearity using the variance inflation factor (VIF) and defined problematic collinearity as a VIF > 10 [35]. Variables with biological rationality and p < 0.05 in the univariate analysis results for the entire follow‐up or peri‐diagnostic period, as well as those relevant to TE occurrence from previous studies, were included in the multivariate analysis.
OS was analyzed using Kaplan–Meier curves, with OS compared between TE and non‐TE groups using the log‐rank test. The correlation between TE and OS was assessed using Cox regression, adjusted for sex, age, smoking history, TNM stage, and driver genes.
Statistical analyses were performed using IBM SPSS (25.0) software and R (3.6.1). Two‐sided tests were used, and p < 0.05 was considered statistically significant.
Results
3
Baseline Characteristics of Patients
3.1
During the study, 2343 patients with advanced lung adenocarcinoma were diagnosed, including 1167 EGFR+, 327 ALK+, 98 ROS1+, and 56 RET+ patients. After screening, EGFR+ patients were stratified by TNM stage, and a subset was randomly selected (1:1) to match the number of ALK+, ROS1+, and RET+ patients (Figure 1). Ultimately, 182 ALK+, 69 ROS1+, 22 RET+, and 273 EGFR+ patients were included in this study. Baseline clinical characteristics are detailed in Table 1.
Study flow chart.
The majority of patients with all these driver genes at advanced stages were female and non‐smokers. The age distribution among the four groups showed significant differences. Patients with ALK and ROS1 rearrangements exhibited a similar age distribution, with patients in these groups being relatively younger (ALK+ vs. EGFR+, p < 0.001; ALK+ vs. RET+, p = 0.030; ROS1+ vs. EGFR+, p = 0.004).
There were significant differences in Khorana and ONKOTEV scores among the four groups (p = 0.005; p < 0.001). Specifically, patients with ALK rearrangements had significantly higher Khorana and ONKOTEV scores compared to those with EGFR mutations (p = 0.012; p = 0.016). No significant difference in follow‐up time was observed among the four groups. As shown in Table 1, the incidence of TEs was significantly higher in patients with RET and ROS1 rearrangements compared to those with EGFR mutations (p = 0.024; p = 0.012).
Clinical and Therapeutic Characteristics Among Molecular Groups
3.2
The clinical characteristics of the four groups are summarized in Table 2. There were no significant differences in the distribution of primary tumor sites (p = 0.055). However, patients with ALK and ROS1 rearrangements had significantly larger mediastinal lymph nodes at the time of diagnosis compared to those with EGFR mutations (both p < 0.001) and were more frequently staged with advanced nodal metastasis at diagnosis (both p < 0.001). In terms of metastasis patterns, patients with ROS1 and RET fusions had a significantly higher incidence of distant lymph node metastases than patients with EGFR mutations (ROS1+ vs. EGFR+, 11.6% vs. 2.9%, p = 0.036; RET+ vs. EGFR+, 18.2% vs. 2.9%, p = 0.048). These findings suggest that ALK, ROS1, and RET rearrangements may be associated with a more aggressive lymphatic phenotype, potentially involving extensive nodal enlargement and dissemination. Such characteristics could lead to vascular or lymphatic compression, thereby increasing the risk of thromboembolic events through mechanical obstruction or endothelial activation.
Of the 546 patients, 29 patients had not received any treatment prior to TEs. Among treated patients, those with EGFR mutations had the highest proportion of using TKI (97.4%), significantly higher than that of the other three groups (p < 0.001). Patients with RET fusions had the highest proportion of receiving chemotherapy (68.2%), immunotherapy (36.4%) and anti‐angiogenic therapy (45.5%), significantly higher than that of the other three groups (p < 0.05).
Laboratory results are summarized in Table 3. CRP and carcinoembryonic antigen (CEA) levels were significantly higher in ALK+ patients compared with those with EGFR mutations (p = 0.012).
Thromboembolic Events Among Molecular Groups
3.3
Among all included patients, a total of 69 patients experienced 101 TEs during the entire follow‐up period, comprising 71 cases of DVT (70.3%), 21 cases of PE (20.8%) and 9 cases of ATE (8.9%). Among these, 17 cases were recurrent TEs (16.8%), as detailed in Table 4. The incidence of ATE was significantly higher in patients with RET fusions than that in patients with ALK fusions (44.4% vs. 3.4%, p = 0.032).
The cumulative incidence of TE is shown in Figure 2A. As for the peri‐diagnostic period (within 6 months before and after diagnosis), there is no significant difference between the four groups (χ ^2^ = 6.75, p = 0.080). The 6‐month cumulative incidence of TE was 17.5% ± 0.2%, 13.9% ± 0.6%, 6.2% ± 0.0%, and 4.8% ± 0.0% for patients with ROS1, RET, ALK fusions, and EGFR mutations, respectively. When considering the entire follow‐up period, the cumulative incidence of TEs among the four groups was significantly different (χ ^2^ = 11.27, p = 0.001). The overall cumulative incidence of TE was 32.5% ± 0.8%, 21.7% ± 1.1%, 19.5% ± 0.2%, and 13.6% ± 0.1% for patients with ROS1, RET, ALK fusions, and EGFR mutations, respectively. Among them, the cumulative incidence of TEs in patients with ROS1 fusions was significantly higher than that in patients with ALK fusions and EGFR mutations (χ ^2^ = 4.14, p = 0.042; χ ^2^ = 10.65, p = 0.001). The incidence of TEs in patients with ROS1 and RET fusions showed a rapid increase in the initial short term, while the incidence of TE in patients with ALK fusions and EGFR mutations gradually increased with the extension of follow‐up time. As for the cumulative incidence of VTE, there was a significant difference between the four molecular subgroups during the peri‐diagnostic period (χ ^2^ = 15.79, p = 0.001) as well as over the entire follow‐up period (χ ^2^ = 11.34, p = 0.010). Although ATE events were relatively rare, their cumulative incidence also differed significantly across the four groups during the peri‐diagnostic period (χ ^2^ = 28.24, p = 0.003) and over the entire follow‐up period (χ ^2^ = 51.85, p = 0.003). Notably, patients with RET fusions had the highest cumulative incidence of ATE, reaching 9.1% ± 0.4% in the peri‐diagnostic period and 13.9% ± 0.6% throughout the entire follow‐up.
Cumulative incidence of thromboembolic events and venous thromboembolism in patients with ALK, ROS1, RET fusions and EGFR mutations. (A) Cumulative incidence of TEs in patients with different driver genes; (B) Cumulative incidence of VTE in patients with different driver genes. Only the first occurrence of TE or VTE in each case was recorded. The analysis was based on the Fine‐Gray competitive risk model, with deaths regarded as a competing event. The peri‐diagnostic period was defined as 6 months before and after the date of lung cancer diagnosis (time = 0). The red dashed line represents the 6‐month time point. TE, thromboembolic event; VTE, venous thromboembolism.
Concerning the timing of TE, there was no significant difference in disease progression between groups when TE occurred (p = 0.061), as shown in Table 4. However, patients with ALK, ROS1, and RET fusions were more likely to develop TEs at diagnosis (ALK+ 37.9%; ROS1+ 45.8%; RET+ 44.4%), while those with EGFR mutations had a TE incidence of 56.4% during disease progression.
The Association Between Clinical Characteristics and Thromboembolic Events
3.4
The results of univariate analysis are presented in Table 5, encompassing all risk factors during the entire and peri‐diagnostic period (p < 0.05), along with risk factors considered to be associated with TEs in previous studies. Univariate analysis revealed that ROS1 fusion was a significant risk factor for TEs in both the peri‐diagnostic period (OR = 3.51, 95% CI 1.68–7.31, p = 0.001) and the entire course (OR = 2.98, 95% CI 1.51–5.86, p = 0.002). During the peri‐diagnostic period, other independent risk factors for increased TE risk included age (OR = 1.04, 95% CI 1.01–1.07, p = 0.016), ONKOTEV score (OR = 2.22, 95% CI 1.15–4.28, p = 0.017), comorbidities, lymph node stage (OR = 1.60, 95% CI 1.08–2.36, p = 0.019), lymph node size (OR = 1.99, 95% CI 1.36–2.90, p < 0.001), and CRP level (OR = 3.48, 95% CI 1.77–6.82, p < 0.001). In the entire cohort, comorbidities, lymph node stage (OR = 1.29, 95% CI 1.00–1.66, p = 0.049), lymph node size (OR = 1.36, 95% CI 1.01–1.83, p = 0.040), and CRP level (OR = 2.58, 95% CI 1.20–5.56, p = 0.016) remained independent risk factors for increased TE risk.
The results of multivariate analysis (as shown in Table 6) suggest that ROS1 fusions (OR = 3.17, 95% CI 2.37–3.97, p = 0.005), the number of comorbidities (OR = 1.86, 95% CI 1.42–2.29, p = 0.005), mediastinal lymph node short axis (OR = 1.69, 95% CI 1.26–2.12, p = 0.017), and CRP levels (OR = 2.67, 95% CI 1.94–3.40, p = 0.008) were risk factors for peri‐diagnostic TEs. Additionally, ROS1 fusions (OR = 2.45, 95% CI 1.81–3.09, p = 0.001) and hypertension (OR = 2.00, 95% CI 1.47–2.54, p = 0.110) were risk factors for the occurrence of TEs throughout the entire course.
The Association Between Overall Survival and Thromboembolic Events
3.5
The occurrence of TEs significantly impacted the OS of patients, as shown in Figure 3. The risk of death was significantly increased in patients with TEs (HR = 3.92, 95% CI 2.33–6.59, p < 0.001) after adjusting for sex, age, smoking history, TNM stage, and driver genes.
Kaplan–Meier survival curve of patients with or without TE. (A) Kaplan–Meier survival curve of all patients; (B) Kaplan–Meier survival curve of patients with different driver genes; (C–F) Kaplan–Meier survival curve of patients with EGFR mutations, ALK fusions, ROS1 fusions, and RET fusions respectively. TE, thromboembolic event.
Among patients with EGFR mutations, the risk of death in patients with TEs was approximately three times that of patients without TEs (HR = 2.99, 95% CI 1.20–7.46, p < 0.001), and the median survival of patients with and without TEs was 28.8 months (95% CI 16.7—NA) and 59.0 months (95% CI 48.2—NA), respectively. In patients with ALK and ROS1 fusions, there was no significant difference in the risk of death between those with and without TEs (HR = 2.58, 95% CI 0.55–8.61, p = 0.064; HR = 2.12, 95% CI 0.40–11.27, p = 0.291). Among the patients with RET fusions, 18 patients did not develop TEs, and none died during follow‐up; four patients developed TEs, and one of them died.
Discussion
4
The correlation between TEs and oncogenic drivers in lung cancer is not well understood yet, necessitating further investigation, particularly concerning the elevated risks of TEs in patients with ROS1 and ALK rearrangements. This study concentrates on assessing the risks of TEs in patients with ROS1, ALK, and RET rearrangements. Our findings indicate that among patients with advanced lung adenocarcinoma harboring driver genes, those with ROS1 fusions exhibited the highest peri‐diagnostic and overall cumulative incidence of TEs. Multivariate analysis also revealed that ROS1 fusions were significantly associated with an increased risk of TEs during both the follow‐up and peri‐diagnosis periods. Conversely, although patients with ALK fusions showed a slightly elevated overall cumulative incidence of TEs, their risk was not significantly higher compared to patients with EGFR mutations. Additionally, we observed a rapid increase in TE incidence among patients with RET rearrangements in the initial short term, with a significantly higher proportion of ATE compared to patients with ALK rearrangements.
In our cohort, the overall TE incidence was 15.9% in ALK+ patients and 13.2% in EGFR+ patients, with no significant difference in TE risks between these two groups. However, prior studies have reported conflicting results. For example, a population‐based Israeli study involving 4762 patients [36] reported increased TE risk in ALK+ compared with ALK‐wild type patients [10, 12, 21, 37]. In a U.S. cohort, the cumulative TE incidence was 45.3% for ALK+ and 21.2% for EGFR+ NSCLC over a median follow‐up of 33.1 months [38]. Similarly, Al‐Samkari et al. reported a significantly higher VTE incidence in ALK+ patients (42.7%) compared to EGFR+ patients (26.2%) [21]. In contrast, a Taiwanese study by H.Y. Wang et al. reported cumulative TE incidences of 7.38% in ALK+ and 6.1% in EGFR+ patients, while ROS1+ patients showed the highest incidence at 36% [39]. The discrepancies among these studies, including ours, may be attributed to variations in study design, patient populations, and underlying racial or genetic predispositions to thromboembolic risk.
Few studies have reported the real‐world incidence of TEs in patients with RET fusions. Limited data from clinical trials related to TKI therapy provide insights. In the phase 1/2 (ALL‐RET) study of alectinib, the TE incidence was 2.9% (one case of TE occurred in 34 patients) [40], while no TEs were reported in the phase II clinical trial of ponatinib for advanced NSCLC with RET fusions [41]. In contrast, a retrospective analysis reported a TE incidence as high as 48% in RET+ patients [30], highlighting significant variability in the reported incidence. In our cohort, the TE incidence for RET+ patients appeared to fall between those of ROS1+ and ALK+ patients. Similar to ROS1+, RET+ patients exhibited a rapid increase in TE incidence during the peri‐diagnostic period. Determining whether patients with RET fusions have an elevated risk of TE, particularly a predisposition to ATEs, requires further investigation in larger cohorts and prospective studies. In addition, the limited number of ATEs in this study constrained the scope of analysis. Further exploration into the potential association between ATE, driver genes, and the underlying biological mechanisms of VTE is warranted in future studies.
This study identified a significantly higher incidence of TEs in the patients with ROS1 fusions, which may partly be explained by the relatively longer expected survival and follow‐up duration of ROS1 patients compared to the general NSCLC population. To further explore this, we analyzed the peri‐diagnostic incidence of TEs across different driver gene subtypes. Notably, the risk of VTE in cancer patients is highest within the first 6 months after diagnosis [42, 43], a period less affected by confounding factors such as treatment regimens or follow‐up duration. In this study, the median time to TE onset in the ROS1+ and RET+ cohorts was less than 90 days. Furthermore, most TE events occurred around the time of diagnosis or disease progression, highlighting that TE is more likely to develop with a higher tumor burden. These findings suggest that the elevated peri‐diagnostic TE incidence in ROS1+ patients is likely driven by the biological effects of the oncogene itself. One proposed mechanism underlying the hypercoagulable state associated with ROS1 rearrangements is the overproduction of mucin, a known thrombotic precursor [44, 45]. Additionally, ROS1+ tumors are more prone to lymph node involvement, which has been linked in some studies to an increased risk of thrombosis [46].
There is a significant variability in the reported incidence of ATE among different driver genes. A recent study reported an elevated ATE incidence in ROS1+ NSCLC (7%, N = 193) [14]. However, another study reported only one case of ATE among 42 patients with ROS1 fusions, yielding an incidence of 2% [47]. Contrasting these findings, our study did not reveal a significant increase in ATE incidence among patients with ROS1 fusions, with only one ATE observed in a cohort of 69 ROS1+ patients (1.4%).
In this study, no significant association was observed between treatment regimens and the risk of TEs among patients with driver genes. The patients included in this study received TKI therapy as the main treatment regimen. A meta‐analysis that included 6 randomized controlled clinical trial studies showed that compared with platinum‐based chemotherapy, TKI treatment did not significantly increase the risk of thrombosis [48]. Additionally, in our study, 45.8% of TEs occurred in untreated patients with ROS1 fusions, with 20.8% of TEs occurring at the time of disease progression. A prospective study [22] reported a VTE incidence of 41.6% in the ROS1+ cohort, with 35.7% of VTE events occurring at the time of progression and 32.1% at the time of disease diagnosis, which is consistent with our findings, showing that TEs are more likely to occur when the disease is not well controlled. Therefore, for patients with ROS1 fusions, initiating anti‐tumor therapy as soon as possible to reduce tumor burden may decrease the risk of TEs.
Regarding the association between TEs and OS, we found that only patients with EGFR mutations exhibited a significantly increased risk of death in the presence of TEs. In contrast, no significant difference in OS was observed between TE and non‐TE groups among patients with ALK and ROS1 fusions. One possible explanation is that patients with ALK and ROS1 fusions often achieve better responses to TKIs, leading to more favorable survival outcomes overall [49]. This therapeutic advantage may attenuate the impact of TEs on mortality in these subgroups. It is also worth noting that the lack of statistical significance in the ALK and ROS1 cohorts could be related to limited sample sizes.
Our results reveal certain phenomena that require further validation through prospective studies, but they may have several implications for clinical practice. Firstly, it is imperative for patients with ROS1 fusions to actively monitor signs and symptoms of TEs and undergo appropriate imaging examinations to rule out TE, especially during the peri‐diagnostic period. Prompt initiation of anti‐tumor therapy is recommended for patients with ROS1 fusions during this period. Additionally, for patients at high risk of TEs (such as elevated CRP level, hypertension, large number of comorbidities and mediastinal lymphadenopathy), the necessity of primary thromboprophylaxis should be considered [50]. This study reaffirmed the elevated TE risk in patients with ROS1 fusions, especially during the peri‐diagnostic period. It underscores the importance of incorporating driver genes as clinical variables when assessing TE risk, emphasizing the need for a comprehensive approach to risk prediction.
This study has several limitations. First, as a single‐center retrospective study conducted at a tertiary referral hospital with a Chinese patient population, it may introduce selection and referral bias, thereby restricting the generalizability of our findings to broader and more diverse populations. Second, the control group for TE analysis comprised patients with EGFR mutations, while the EGFR+ cohort was stratified based on TNM stage and matched randomly at a ratio of 1:1. Therefore, the distribution of each driver gene in this study may not accurately reflect real‐world proportions, potentially influencing some results. Third, although this study represents the largest cohort evaluating TEs in advanced lung adenocarcinoma with RET fusions, the cohort size remains relatively small due to the rarity of RET fusions in NSCLC, limiting the ability to detect significant differences among driver genes. Fourth, other driver genes beyond ALK, ROS1, RET fusions, and EGFR mutations were not evaluated. These subgroups were chosen for comparative analysis because ALK and ROS1 fusions are well‐validated fusion genes in lung adenocarcinoma, whereas EGFR mutations are a commonly validated driver gene primarily receiving targeted therapy. Finally, information on anticoagulation uses and detailed treatment histories was incomplete, representing potential unmeasured confounders.
Despite these limitations, our study exhibits several strengths. First, we included a cohort of patients with RET‐rearranged lung cancer, a rare but therapeutically targetable subtype. We observed a potentially elevated incidence of TEs, particularly ATEs, in this group; however, this finding should be interpreted with caution due to the limited sample size and statistical power. Furthermore, our longitudinal follow‐up analysis of four driver gene cohorts reveals distinct temporal patterns and trends in TEs. Notably, ROS1 and RET exhibit a higher TE incidence during the peri‐diagnostic period, while ALK and EGFR demonstrate a progressively increasing trend in TEs over time.
Conclusions
5
ROS1 fusions exhibited the highest peri‐diagnostic and overall cumulative incidence of TEs among patients with advanced lung adenocarcinoma harboring driver genes. Multivariate analysis identified ROS1 fusions as significantly associated with an increased risk of TEs during both the peri‐diagnosis period and follow‐up. Independent risk factors for TE development in the peri‐diagnostic period (within 6 months of diagnosis) included ROS1 fusions, the number of comorbidities, mediastinal lymph node diameter, and CRP levels. Over the entire follow‐up period, ROS1 fusions and hypertension were identified as independent risk factors for TEs.
Author Contributions
All authors had full access to the data in the study and take responsibility for the integrity of the data and the accuracy of the data analysis. Conceptualization: X.Q., M.F., J.Z., J.Z. Methodology: X.Q., M.F., J.Z., J.Z. Investigation: X.Q., M.F., J.Z., J.J.C., C.C. Formal analysis: X.Q., M.F. Resources: J.Z., J.Z. Writing – original draft: X.Q., M.F. Writing – review and editing: X.Q., M.F., J.Z., J.Z. Visualization: X.Q., M.F. Supervision: J.Z., J.Z.
Ethics Statement
In accordance with the regulations of the Clinical Research Ethics Committee of the First Affiliated Hospital, Zhejiang University School of Medicine (Approval Number: IIT20220496), this study was approved by the ethics committee, and the requirement for informed consent was waived.
Conflicts of Interest
The authors declare that the research was conducted in the absence of any commercial or financial relationships that could be construed as a potential Conflicts of Interest.
The reference list from the paper itself. Each links out to its DOI / PubMed record.
- 1N. B. Abdol Razak , G. Jones , M. Bhandari , et al., “Cancer‐Associated Thrombosis: An Overview of Mechanisms, Risk Factors, and Treatment,” Cancers 10, no. 10 (2018): 380.30314362 10.3390/cancers 10100380 PMC 6209883 · doi ↗ · pubmed ↗
- 2J. W. Blom , C. J. M. Doggen , S. Osanto , et al., “Malignancies, Prothrombotic Mutations, and the Risk of Venous Thrombosis,” JAMA 293, no. 6 (2005): 715–722.15701913 10.1001/jama.293.6.715 · doi ↗ · pubmed ↗
- 3J. F. Timp , S. K. Braekkan , H. H. Versteeg , and S. C. Cannegieter , “Epidemiology of Cancer‐Associated Venous Thrombosis,” Blood 122, no. 10 (2013): 1712–1723.23908465 10.1182/blood-2013-04-460121 · doi ↗ · pubmed ↗
- 4H. T. Sørensen , L. Mellemkjær , J. H. Olsen , and J. A. Baron , “Prognosis of Cancers Associated With Venous Thromboembolism,” New England Journal of Medicine 343, no. 25 (2000): 1846–1850.11117976 10.1056/NEJM 200012213432504 · doi ↗ · pubmed ↗
- 5C. Ay and U. K. Ünal , “Epidemiology and Risk Factors for Venous Thromboembolism in Lung Cancer,” Current Opinion in Oncology 28, no. 2 (2016): 145–149.26730487 10.1097/CCO.0000000000000262 · doi ↗ · pubmed ↗
- 6H. K. Chew , A. M. Davies , T. Wun , et al., “The Incidence of Venous Thromboembolism Among Patients With Primary Lung Cancer,” Journal of Thrombosis and Haemostasis 6, no. 4 (2008): 601–608.18208538 10.1111/j.1538-7836.2008.02908.x · doi ↗ · pubmed ↗
- 7J. W. Blom , S. Osanto , and F. R. Rosendaal , “The Risk of a Venous Thrombotic Event in Lung Cancer Patients: Higher Risk for Adenocarcinoma Than Squamous Cell Carcinoma,” Journal of Thrombosis and Haemostasis 2, no. 10 (2004): 1760–1765.15456487 10.1111/j.1538-7836.2004.00928.x · doi ↗ · pubmed ↗
- 8J. Yu , A. Li , M. Laureano , and M. Crowther , “Frequency of Arterial Thromboembolism in Populations With Malignancies: A Systematic Review,” Thrombosis Research 184 (2019): 16–23.31678748 10.1016/j.thromres.2019.10.004 · doi ↗ · pubmed ↗