Racial Disparities in Comorbidity Patterns of Early-Onset Liver Cancer: A Machine Learning Analysis
Bingya Ma, Kai Zheng, Fa-Chyi Lee, Yunxia Lu

TL;DR
This study uses machine learning to show how different racial groups have distinct health conditions linked to early-onset liver cancer, suggesting ways to better target prevention efforts.
Contribution
The novel use of race-specific machine learning models to identify comorbidity patterns in early-onset liver cancer across different ethnic groups.
Findings
Asian and Pacific Islanders had higher rates of Hepatitis B virus infection, while Hispanics had higher rates of cirrhosis and metabolic disorders.
Machine learning models for Asian and Hispanic groups outperformed the model for White patients in predicting liver cancer risk.
Comorbidity patterns varied significantly by race, with HBV being dominant for API and HCV/metabolic disorders for Hispanics.
Abstract
The incidence of early-onset liver cancer (EOLC) has been increasing in many countries, yet evidence on its etiology remains limited, particularly outside the Asian population. This case-control study explores the comorbidity patterns of EOLC and develops race/ethnicity-specific machine learning (ML) models to predict liver cancer risk. We included patients diagnosed with primary liver cancer between ages 18 and 49 from the University of California Health Data Warehouse, matching each patient with five controls. ML classification methods, including decision trees, random forests, logistic regression, XGBoost, and LightGBM, were used to assess liver cancer risk based on demographics and comorbidities. Model performance was evaluated using F1 scores, and SHapley Additive exPlanations (SHAP) was applied to identify the most influential comorbidities within each racial group. A total of…
Genes, proteins, chemicals, diseases, species, mutations and cell lines named across the full text — each resolved to its canonical identifier and authoritative record.
Click any figure to enlarge with its caption.
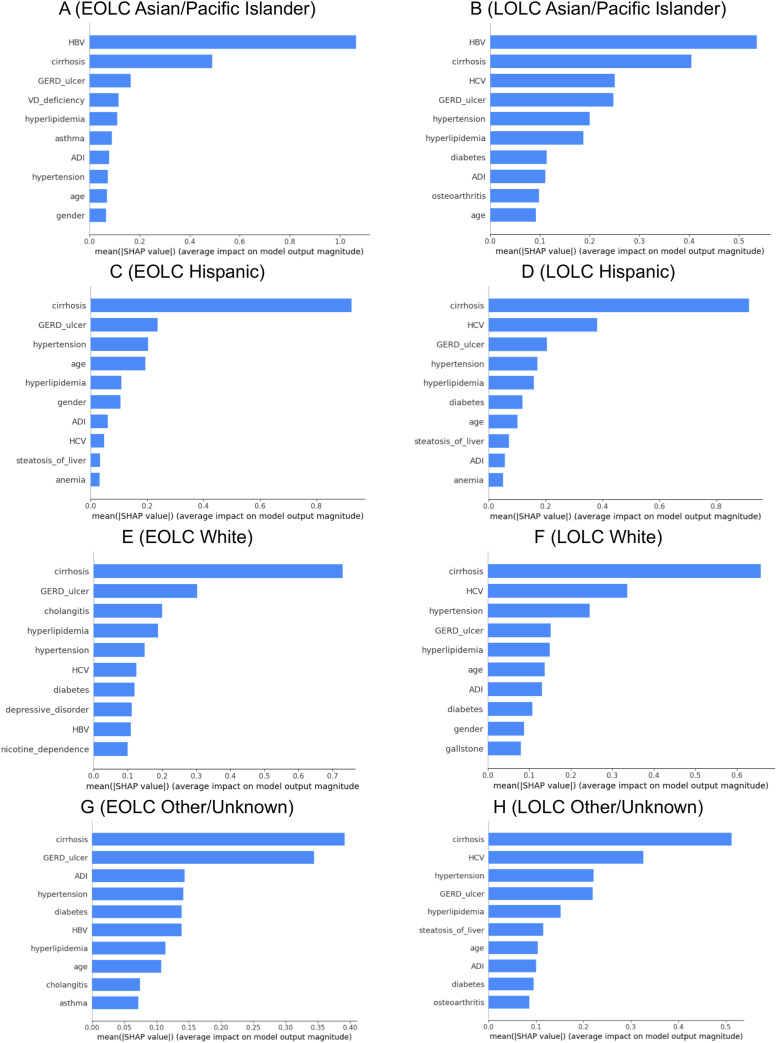 Figure 1
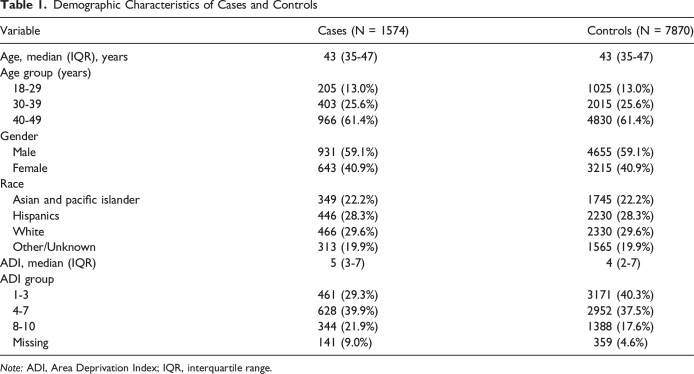 Figure 2
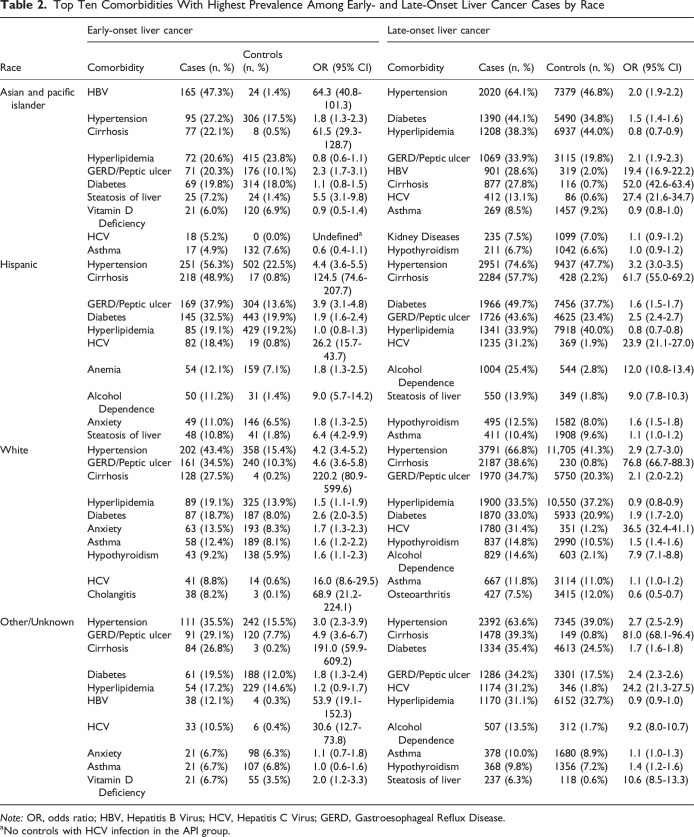 Figure 3
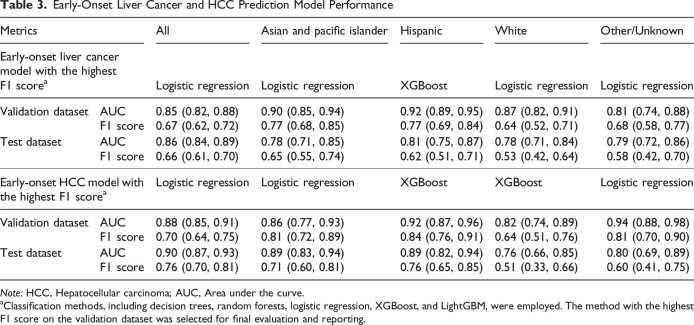 Figure 4
- —National Cancer Institutehttps://doi.org/10.13039/100000054
- —UCI Presidential Funding of Dr Oladele Ogunseitan
Peer Reviews
No public reviews on file for this paper yet. If you reviewed it on a platform where reviews are public (OpenReview, ICLR, NeurIPS, ICML), you can paste yours below so the community can read it here.
Videos
No videos yet. Explain this paper in a talk, walkthrough, or lecture? Add one.
Taxonomy
TopicsLiver Disease Diagnosis and Treatment · Hepatitis B Virus Studies · Hepatocellular Carcinoma Treatment and Prognosis
Introduction
Primary liver cancer, mainly including hepatocellular carcinoma (HCC) and intrahepatic cholangiocarcinoma (ICC), is the sixth most frequently diagnosed cancer worldwide.^ 1 ^ Liver cancer exhibits distinct incidence rates across different populations, with a range of factors contributing to its development within specific racial groups.^2-4^ From 1998 to 2015, the incidence rates of liver and intrahepatic bile duct cancer in the U.S. increased, peaking with an annual percent change (APC) of 4.5%. This was followed by a stabilization period, with a marginal APC of 0.3% from 2015 to 2021.^ 5 ^
Early-onset liver cancer (EOLC) is often defined as liver cancer diagnosed in individuals younger than 50 years of age. According to data from the Surveillance, Epidemiology, and End Results registries, the incidence of early-onset HCC decreased in the United States from 2010 to 2019, whereas the incidence of early-onset ICC increased during the same period.^ 6 ^ Additionally, the incidence of EOLC has been rising in regions such as East Asia, Australia, Slovakia, and Uganda.^7,8^ The reasons for these different incidence patterns across different populations are unknown.
Clinical characteristics of EOLC differ from the liver cancer diagnosed at older ages. For example, compared to 80-90% of cirrhosis in all HCC patients, only 12.7-33.3% of young-onset HCC cases had liver cirrhosis.^8,9^ In addition, young HCC patients had a significantly higher rate of Hepatitis B surface antigen (HBsAg) positivity, better liver function, and a more advanced tumor stage at diagnosis compared with the older group.^ 9 ^ This indicates a distinct precancerous disease pattern in EOLC. So far, a few studies have identified risk factors and precancerous diseases for EOLC, including male gender, Hepatitis B virus (HBV), smoking, family history, and previous chronic liver disease.^10-14^ However, the previous studies were primarily conducted among the Asian populations, and research evidence in other races is sparse, leaving gaps in understanding the etiologies of EOLC.^10-14^ A deeper understanding of comorbidity patterns may help identify risk factors and high-risk populations across different racial groups.
In virtue of the medical record data from the University of California Health Data Warehouse (UCHDW), we have an opportunity to initiate a retrospective case-control study to examine the comorbidity patterns among racial/ethnic groups. The UCHDW is a research data warehouse aggregating electronic health records (EHR) data from 6 UC Health campuses (Davis, San Francisco, Los Angeles, Riverside, Irvine, and San Diego. It contains high-quality clinical information, including diagnoses, lab tests, prescriptions, and more. In addition, advances in analytical methods, especially the development of machine learning (ML) approaches, make it possible to analyze large-scale, real-world EHR data.^ 15 ^ Different from traditional statistical models, which rely on strict assumptions regarding data distributions and face challenges with missing data, ML techniques are more flexible and better suited to handle complex and incomplete datasets.
Therefore, we conducted this study to leverage the power of both UCHDW and ML to examine the patterns of comorbidities across different races, develop race/ethnicity-specific ML models to predict liver cancer, and identify the most important comorbidities in each racial/ethnic group. The goal is to identify high-risk groups and promote targeted prevention and control of liver cancer among younger populations.
Methods
Study Population
We initiated a matched case-control study based on the UCHDW, which contained de-identified data on over 10 million patients dating back to 2012.^ 16 ^ The dataset reflects California's diverse population, including substantial representation across various racial and ethnic groups. The UCHDW is encoded according to the Observational Medical Outcomes Partnership Common Data Model (OMOP CDM), which standardizes data structure and coding terminologies to facilitate data sharing across healthcare institutions.^ 17 ^ Patients diagnosed with primary liver cancer (SNOMED code 95214007, ICD-O-3 and ICD-10 code C22, and/or ICD-9 code 155), aged 18 to 49 years, were included. We further excluded codes for secondary cancer, metastasis, and hepatoblastoma, the latter having a distinct etiology as the most common childhood liver cancer. Then, we identified standard concept IDs and retrieved relevant descendant codes to capture all patients with liver cancer. In addition, we excluded patients with prior diagnoses of other cancer types to minimize the inclusion of metastatic liver cancer cases. We also removed individuals with missing demographic information (e.g., age, gender, race/ethnicity) from the analysis. To enhance the completeness of the patient cohort, we only included patients with two or more hospital visits in the UCHDW, which provides a more reliable representation of disease prevalence by reducing the likelihood of including patients with incomplete or sporadic data.^ 18 ^ For each liver cancer case, we identified all eligible controls matched on sex, race, and birth year—demographic factors known to influence liver cancer risk—to ensure balanced representation across racial and ethnic groups. The further eligibility of controls included no history of any cancers, having at least two hospital visits, and the observation period encompassing the diagnosis date of the corresponding cases, which ensured comparable exposure windows. In the pool of eligible controls for each case, we applied a random sampling approach using PySpark window functions with randomized row ordering to select five controls. A 1:5 case-to-control ratio was chosen to maximize the information gained from the limited number of cases, enhance statistical efficiency, and improve model stability.^ 19 ^ The index date for each case was defined as the first date of diagnosis of primary liver cancer in the UCHDW, and the corresponding index date for the five matched controls was the same as the index date of the matched case.
This study uses a limited data set (LDS) version of the UCHDW that has all patient identifiers removed except for service dates and year of birth. The use of the LDS UCHDW in secure research computing enclaves was approved jointly by the Institutional Review Boards (IRB) of all UC Health campuses as non-human subject research. The reporting of this study conforms to STROBE guidelines.^ 20 ^
Data Retrieval
Patients were grouped based on self-reported race and ethnicity groups, identified using the following SNOMED codes: non-Hispanic Asian and Pacific Islanders (API) (race: 8515, 8557; ethnicity: 38003564), Hispanic (ethnicity: 38003563), non-Hispanic White (race: 8527; ethnicity: 38003564), and other or unknown races, the latter contained liver cancer cases in non-Hispanic Black, American Indian/Alaska Native, and other racial/ethnic groups and those with unknown races/ethnicities. Further demographic information of year of birth, gender, and socioeconomic status (SES) was identified from the UCHDW as follows. Age was calculated by subtracting the year of birth from the year of the first liver cancer diagnosis (the index date) for each case-control matched group. SES was assessed using the Area Deprivation Index (ADI) scores, which combine various socioeconomic indicators at the census block group level—such as income, education, employment, and housing quality—to quantify neighborhood-level socioeconomic disadvantage.^ 21 ^ It ranks from least to most deprived and is divided into deciles represented by integers from 1 to 10.^ 22 ^ Missing ADI scores were imputed using MissForest, an ML algorithm based on random forests for handling missing data. Compared to traditional imputation methods, MissForest can handle both continuous and categorical variables and capture complex relationships and interactions between variables, and it does not rely on assumptions about the underlying data distribution.^ 23 ^
Comorbidities were defined as preexisting conditions diagnosed before or at the onset of liver cancer, with symptoms or complications of certain diseases excluded, as they are signs or adverse events associated with comorbidities.^ 24 ^ To ensure adequate statistical power, we included comorbidities with a prevalence greater than 1% among cases or those previously reported as risk factors for liver cancer or liver diseases. For example, Crohn’s disease, one of the inflammatory bowel diseases, and colon polyps are closely associated with several liver and biliary diseases.^25-27^ Although the prevalence of these conditions was slightly lower than 1%, we included them in this study. Patients were identified as having specific comorbidities if they had corresponding diagnoses (identified by SNOMED or ICD codes), abnormal lab test results, or records of specific medications before or on the index date. Detailed criteria for each comorbidity are described in Table S1. Comorbidities were further classified by subtype of the diseases and whether the condition had begun within or more than one year before the index date. The comorbidity classification categories are provided in Table S2.
Statistical Analysis
We conducted descriptive statistics to describe the demographic characteristics of cases and controls. Numeric variables were displayed as medians and interquartile ranges (IQRs); categorical variables were presented as frequencies and proportions. The ten most prevalent comorbidities, along with their prevalence in the corresponding controls, are listed in Table 1. Odds ratios (ORs) with 95% confidence intervals (CIs) were estimated to measure the association between each comorbidity and the risks of liver cancer.Table 1.Demographic Characteristics of Cases and ControlsVariableCases (N = 1574)Controls (N = 7870)Age, median (IQR), years43 (35-47)43 (35-47)Age group (years) 18-29205 (13.0%)1025 (13.0%) 30-39403 (25.6%)2015 (25.6%) 40-49966 (61.4%)4830 (61.4%)Gender Male931 (59.1%)4655 (59.1%) Female643 (40.9%)3215 (40.9%)Race Asian and pacific islander349 (22.2%)1745 (22.2%) Hispanics446 (28.3%)2230 (28.3%) White466 (29.6%)2330 (29.6%) Other/Unknown313 (19.9%)1565 (19.9%)ADI, median (IQR)5 (3-7)4 (2-7)ADI group 1-3461 (29.3%)3171 (40.3%) 4-7628 (39.9%)2952 (37.5%) 8-10344 (21.9%)1388 (17.6%) Missing141 (9.0%)359 (4.6%)Note: ADI, Area Deprivation Index; IQR, interquartile range.
In this study, we leveraged the AutoML modules provided on the Databricks Platform (Databricks, Inc, San Francisco, CA) to train and construct race/ethnicity-specific predictive ML models for the risk of EOLC using information on age, sex, ADI scores, and comorbidities. The dataset was randomly split into training (60%), validation (20%), and test (20%) datasets for model development, tuning, and evaluation, respectively. Classification methods utilized by Databricks AutoML, including decision trees, random forests, logistic regression, XGBoost, and LightGBM, were employed. The effectiveness of the selected models in predicting cancer risk has been demonstrated in previous studies.^28,29^ To ensure comparability, all models were trained and evaluated using the same predefined set of features. Feature selection and hyperparameter tuning were automatically managed by Databricks AutoML for each model. Databricks facilitated the hyperparameter tuning by integrating distributed optimization libraries like Optuna and Ray Tune with MLflow for tracking, enabling scalable and efficient model selection across clusters. AutoML also addressed class imbalance in the dataset by down-sampling the majority classes and applying class weights when an imbalance was detected.^ 30 ^ The F1 scores for all classification methods are presented in Table S3, and the method achieving the highest F1 score on the validation dataset was selected for final evaluation and reporting. The F1 score was used as the primary evaluation metric due to its effectiveness in balancing precision and recall, particularly in imbalanced datasets in which each case was matched with five controls.^ 31 ^ The area under the curve (AUC) values were also reported to evaluate the models’ performance. A summary of the model training and validation process is provided in Table S4. We also used SHapley Additive exPlanations (SHAP) to interpret the machine learning model outputs. SHAP is a unified approach based on Shapley values from cooperative game theory that quantifies the average marginal contribution of each feature across all possible feature combinations. This allows for transparent and consistent interpretation of how each comorbidity influences the predicted liver cancer risk while accounting for complex interactions with other variables.^ 32 ^ Mean SHAP values were calculated to summarize the overall contribution of each feature to model prediction results using the SHAP package. A summary of the SHAP method, including its mathematical foundation, model compatibility, and application in this study, is provided in Table S5.
Subgroup analysis among patients with HCC diagnosis, the major histological type of primary liver cancer, was further conducted. For comparison purposes, a similar data extraction and analysis process was applied to analyze the comorbidity patterns among late-onset liver cancer (LOLC) patients who were first diagnosed at age 50 years or older, along with five matched controls. All data extractions and analyses were performed on Databricks via Amazon Web Services (AWS, Amazon.com, Inc, Seattle, WA) 13.3 LTS, SQL 3.5.1, and Python 3.10.12.
Results
Among 9,447,655 patients included in the UCHDW dataset between Jan 1, 2012, and August 5, 2024, we identified 2288 patients who were first diagnosed with liver cancer between the ages of 18 and 49 years. Of these, we excluded 605 patients with a diagnosis of another cancer before liver cancer, one patient with unknown gender information, 105 patients with fewer than two visits, and three patients matched with only two controls. Finally, 1574 EOLC patients remained in the analysis, and 7870 matched controls were identified. The process of data collection is shown in Figure S1.
The baseline demographic characteristics among cases and controls are shown in Table 1. The median age of the study population was 43 years (IQR 35-47 years), and 59.1% were male. Among the liver cancer patients, 22.2% were API, 28.3% were Hispanic, 29.6% were White, and 19.9% were of other or unknown races. The median ADI was 5 (IQR 3-7) among cases and 4 (IQR 2-7) among controls. We identified 31 comorbidities in the analyses, including liver diseases (HBV infection, Hepatitis C virus (HCV) infection, cirrhosis, steatosis of the liver, autoimmune liver disease), biliary diseases (gallstone, cholesterolosis of the gallbladder, cholangitis), metabolic disorders (diabetes, hyperlipidemia, hypertension), mental health disorders (anxiety, depressive disorder), gastrointestinal diseases (gastroesophageal reflux disease or peptic ulcer, ulcerative colitis, Crohn’s disease, polyp of the large intestine), renal conditions (chronic kidney disease, kidney stone), substance use disorders (alcohol dependence, nicotine dependence), respiratory or allergic diseases (asthma, obstructive sleep apnea, allergic rhinitis), cardiovascular disease (congenital heart disease, coronary arteriosclerosis), and other health conditions (vitamin D deficiency, hypothyroidism, anemia, Human Immunodeficiency Virus [HIV] infection). Comorbidities included in the LOLC models were different due to the different prevalence of the diseases in the older patients. For example, congenital heart disease, HIV infection, ulcerative colitis, and Crohn’s disease were not included in the LOLC models because of the extremely low prevalence. In contrast, cerebrovascular disease, myocardial infarction, peripheral vascular disease, chronic obstructive pulmonary disease, prostatic hyperplasia, gout, osteoarthritis, osteoporosis, cataract, and diverticular disease of the colon were included in the model for the LOLC.
Table 2 presents the results for the top comorbidities among the cases of EOLC and LOLC by racial groups. In the API group, HBV infection exhibited a high prevalence (47.3%) and the strongest association with EOLC (OR = 64.3, 95% CI: 40.8-101.3). Hypertension, cirrhosis, GERD/peptic ulcer, diabetes, HCV infection, and hyperlipidemia were common comorbidities across all racial groups, with all conditions positively associated with EOLC except hyperlipidemia, which might be due to the impaired hepatic function in lipid synthesis among patients with liver diseases.^ 33 ^ Additionally, anemia (OR = 1.8, 95%CI: 1.3-2.5), alcohol dependence (OR = 9.0, 95%CI: 5.7-14.2), anxiety (OR = 1.8, 95%CI: 1.3-2.5), and steatosis of the liver (OR = 6.4, 95%CI: 4.2-9.9) in Hispanics were positively associated with EOLC, with notable prevalence higher than 10% in the cases. Among White patients, anxiety (OR = 1.7, 95%CI: 1.3-2.3), asthma (OR = 1.6, 95%CI: 1.2-2.2), and hypothyroidism (OR = 1.6, 95%CI: 1.1-2.3) were significantly associated with EOLC. Cholangitis was prevalent among White patients and was strongly associated with EOLC (OR = 68.9, 95% CI: 21.2-224.1). For LOLC cases, HCV infection, alcohol dependence, asthma, hypothyroidism, and metabolic syndrome-related comorbidities, such as hypertension, hyperlipidemia, and diabetes, were more common. In contrast, HBV infection and anxiety were comparatively less prevalent in the LOLC group, suggesting a distinct risk profile for comorbidities between early- and late-onset liver cancer cases.Table 2.Top Ten Comorbidities With Highest Prevalence Among Early- and Late-Onset Liver Cancer Cases by RaceRaceEarly-onset liver cancerLate-onset liver cancerComorbidityCases (n, %)Controls (n, %)OR (95% CI)ComorbidityCases (n, %)Controls (n, %)OR (95% CI)Asian and pacific islanderHBV165 (47.3%)24 (1.4%)64.3 (40.8-101.3)Hypertension2020 (64.1%)7379 (46.8%)2.0 (1.9-2.2)Hypertension95 (27.2%)306 (17.5%)1.8 (1.3-2.3)Diabetes1390 (44.1%)5490 (34.8%)1.5 (1.4-1.6)Cirrhosis77 (22.1%)8 (0.5%)61.5 (29.3-128.7)Hyperlipidemia1208 (38.3%)6937 (44.0%)0.8 (0.7-0.9)Hyperlipidemia72 (20.6%)415 (23.8%)0.8 (0.6-1.1)GERD/Peptic ulcer1069 (33.9%)3115 (19.8%)2.1 (1.9-2.3)GERD/Peptic ulcer71 (20.3%)176 (10.1%)2.3 (1.7-3.1)HBV901 (28.6%)319 (2.0%)19.4 (16.9-22.2)Diabetes69 (19.8%)314 (18.0%)1.1 (0.8-1.5)Cirrhosis877 (27.8%)116 (0.7%)52.0 (42.6-63.4)Steatosis of liver25 (7.2%)24 (1.4%)5.5 (3.1-9.8)HCV412 (13.1%)86 (0.6%)27.4 (21.6-34.7)Vitamin D Deficiency21 (6.0%)120 (6.9%)0.9 (0.5-1.4)Asthma269 (8.5%)1457 (9.2%)0.9 (0.8-1.0)HCV18 (5.2%)0 (0.0%)Undefined^ a ^Kidney Diseases235 (7.5%)1099 (7.0%)1.1 (0.9-1.2)Asthma17 (4.9%)132 (7.6%)0.6 (0.4-1.1)Hypothyroidism211 (6.7%)1042 (6.6%)1.0 (0.9-1.2)HispanicHypertension251 (56.3%)502 (22.5%)4.4 (3.6-5.5)Hypertension2951 (74.6%)9437 (47.7%)3.2 (3.0-3.5)Cirrhosis218 (48.9%)17 (0.8%)124.5 (74.6-207.7)Cirrhosis2284 (57.7%)428 (2.2%)61.7 (55.0-69.2)GERD/Peptic ulcer169 (37.9%)304 (13.6%)3.9 (3.1-4.8)Diabetes1966 (49.7%)7456 (37.7%)1.6 (1.5-1.7)Diabetes145 (32.5%)443 (19.9%)1.9 (1.6-2.4)GERD/Peptic ulcer1726 (43.6%)4625 (23.4%)2.5 (2.4-2.7)Hyperlipidemia85 (19.1%)429 (19.2%)1.0 (0.8-1.3)Hyperlipidemia1341 (33.9%)7918 (40.0%)0.8 (0.7-0.8)HCV82 (18.4%)19 (0.8%)26.2 (15.7-43.7)HCV1235 (31.2%)369 (1.9%)23.9 (21.1-27.0)Anemia54 (12.1%)159 (7.1%)1.8 (1.3-2.5)Alcohol Dependence1004 (25.4%)544 (2.8%)12.0 (10.8-13.4)Alcohol Dependence50 (11.2%)31 (1.4%)9.0 (5.7-14.2)Steatosis of liver550 (13.9%)349 (1.8%)9.0 (7.8-10.3)Anxiety49 (11.0%)146 (6.5%)1.8 (1.3-2.5)Hypothyroidism495 (12.5%)1582 (8.0%)1.6 (1.5-1.8)Steatosis of liver48 (10.8%)41 (1.8%)6.4 (4.2-9.9)Asthma411 (10.4%)1908 (9.6%)1.1 (1.0-1.2)WhiteHypertension202 (43.4%)358 (15.4%)4.2 (3.4-5.2)Hypertension3791 (66.8%)11,705 (41.3%)2.9 (2.7-3.0)GERD/Peptic ulcer161 (34.5%)240 (10.3%)4.6 (3.6-5.8)Cirrhosis2187 (38.6%)230 (0.8%)76.8 (66.7-88.3)Cirrhosis128 (27.5%)4 (0.2%)220.2 (80.9-599.6)GERD/Peptic ulcer1970 (34.7%)5750 (20.3%)2.1 (2.0-2.2)Hyperlipidemia89 (19.1%)325 (13.9%)1.5 (1.1-1.9)Hyperlipidemia1900 (33.5%)10,550 (37.2%)0.9 (0.8-0.9)Diabetes87 (18.7%)187 (8.0%)2.6 (2.0-3.5)Diabetes1870 (33.0%)5933 (20.9%)1.9 (1.7-2.0)Anxiety63 (13.5%)193 (8.3%)1.7 (1.3-2.3)HCV1780 (31.4%)351 (1.2%)36.5 (32.4-41.1)Asthma58 (12.4%)189 (8.1%)1.6 (1.2-2.2)Hypothyroidism837 (14.8%)2990 (10.5%)1.5 (1.4-1.6)Hypothyroidism43 (9.2%)138 (5.9%)1.6 (1.1-2.3)Alcohol Dependence829 (14.6%)603 (2.1%)7.9 (7.1-8.8)HCV41 (8.8%)14 (0.6%)16.0 (8.6-29.5)Asthma667 (11.8%)3114 (11.0%)1.1 (1.0-1.2)Cholangitis38 (8.2%)3 (0.1%)68.9 (21.2-224.1)Osteoarthritis427 (7.5%)3415 (12.0%)0.6 (0.5-0.7)Other/UnknownHypertension111 (35.5%)242 (15.5%)3.0 (2.3-3.9)Hypertension2392 (63.6%)7345 (39.0%)2.7 (2.5-2.9)GERD/Peptic ulcer91 (29.1%)120 (7.7%)4.9 (3.6-6.7)Cirrhosis1478 (39.3%)149 (0.8%)81.0 (68.1-96.4)Cirrhosis84 (26.8%)3 (0.2%)191.0 (59.9-609.2)Diabetes1334 (35.4%)4613 (24.5%)1.7 (1.6-1.8)Diabetes61 (19.5%)188 (12.0%)1.8 (1.3-2.4)GERD/Peptic ulcer1286 (34.2%)3301 (17.5%)2.4 (2.3-2.6)Hyperlipidemia54 (17.2%)229 (14.6%)1.2 (0.9-1.7)HCV1174 (31.2%)346 (1.8%)24.2 (21.3-27.5)HBV38 (12.1%)4 (0.3%)53.9 (19.1-152.3)Hyperlipidemia1170 (31.1%)6152 (32.7%)0.9 (0.9-1.0)HCV33 (10.5%)6 (0.4%)30.6 (12.7-73.8)Alcohol Dependence507 (13.5%)312 (1.7%)9.2 (8.0-10.7)Anxiety21 (6.7%)98 (6.3%)1.1 (0.7-1.8)Asthma378 (10.0%)1680 (8.9%)1.1 (1.0-1.3)Asthma21 (6.7%)107 (6.8%)1.0 (0.6-1.6)Hypothyroidism368 (9.8%)1356 (7.2%)1.4 (1.2-1.6)Vitamin D Deficiency21 (6.7%)55 (3.5%)2.0 (1.2-3.3)Steatosis of liver237 (6.3%)118 (0.6%)10.6 (8.5-13.3)Note: OR, odds ratio; HBV, Hepatitis B Virus; HCV, Hepatitis C Virus; GERD, Gastroesophageal Reflux Disease.^a^No controls with HCV infection in the API group.
The predictive performance of ML models for EOLC varied across racial groups, as illustrated in Table 3. Models trained for API (AUC = 0.90, F1 = 0.77) and Hispanic (AUC = 0.92, F1 = 0.77) patients showed higher performance compared to those for White patients (AUC = 0.87, F1 = 0.64), despite the larger sample size in the White group. Models for early-onset HCC performed better than the general early-onset liver cancer models. Similarly, the model achieved higher AUC and F1 scores for API (AUC = 0.86, F1 = 0.81) and Hispanic (AUC = 0.92, F1 = 0.84) patients, with lower performance for White patients (AUC = 0.82, F1 = 0.64).Table 3.Early-Onset Liver Cancer and HCC Prediction Model PerformanceMetricsAllAsian and pacific islanderHispanicWhiteOther/UnknownEarly-onset liver cancer model with the highest F1 score^ a ^Logistic regressionLogistic regressionXGBoostLogistic regressionLogistic regressionValidation datasetAUC0.85 (0.82, 0.88)0.90 (0.85, 0.94)0.92 (0.89, 0.95)0.87 (0.82, 0.91)0.81 (0.74, 0.88)F1 score0.67 (0.62, 0.72)0.77 (0.68, 0.85)0.77 (0.69, 0.84)0.64 (0.52, 0.71)0.68 (0.58, 0.77)Test datasetAUC0.86 (0.84, 0.89)0.78 (0.71, 0.85)0.81 (0.75, 0.87)0.78 (0.71, 0.84)0.79 (0.72, 0.86)F1 score0.66 (0.61, 0.70)0.65 (0.55, 0.74)0.62 (0.51, 0.71)0.53 (0.42, 0.64)0.58 (0.42, 0.70)Early-onset HCC model with the highest F1 score^ a ^Logistic regressionLogistic regressionXGBoostXGBoostLogistic regressionValidation datasetAUC0.88 (0.85, 0.91)0.86 (0.77, 0.93)0.92 (0.87, 0.96)0.82 (0.74, 0.89)0.94 (0.88, 0.98)F1 score0.70 (0.64, 0.75)0.81 (0.72, 0.89)0.84 (0.76, 0.91)0.64 (0.51, 0.76)0.81 (0.70, 0.90)Test datasetAUC0.90 (0.87, 0.93)0.89 (0.83, 0.94)0.89 (0.82, 0.94)0.76 (0.66, 0.85)0.80 (0.69, 0.89)F1 score0.76 (0.70, 0.81)0.71 (0.60, 0.81)0.76 (0.65, 0.85)0.51 (0.33, 0.66)0.60 (0.41, 0.75)Note: HCC, Hepatocellular carcinoma; AUC, Area under the curve.^a^Classification methods, including decision trees, random forests, logistic regression, XGBoost, and LightGBM, were employed. The method with the highest F1 score on the validation dataset was selected for final evaluation and reporting.
The feature importance plots based on SHAP values reveal the most important comorbidities by race/ethnicity associated with EOLC and LOLC (Figure 1). For API patients, HBV and cirrhosis showed the highest mean SHAP values, with HBV reaching up to 1.0 in younger populations. However, in older populations, the mean SHAP value for HBV was around 0.5, and the importance of other comorbidities—such as cirrhosis, GERD/ulcer, hypertension, and hyperlipidemia—became more pronounced. Vitamin D deficiency and asthma also appear among the important factors in the EOLC, although they have much lower mean SHAP values compared to HBV and cirrhosis. In Hispanic patients, cirrhosis, GERD/ulcer, hypertension, hyperlipidemia, and HCV showed high mean SHAP values in both early and later stages, suggesting that HCV infection and metabolic syndrome-related risks are more prominent in this population. White patients exhibit a more discrete importance of comorbidity pattern, with generally lower mean SHAP values across comorbidities. Apart from cirrhosis, metabolic disease, HCV infection, cholangitis, mental health disorders, and nicotine dependence were also important predictors in young White liver cancer patients. The relatively lower and more evenly spread SHAP values across conditions in White patients suggest a more heterogeneous comorbidity profile, consistent with the model’s lower F1 and AUC score for this group. Race/ethnicity-specific feature importance plots associated with early-onset HCC are displayed in Figure S2.Figure 1.Race/ethnicity-specific feature importance plots based on SHAP values. Panels A and B represent the EOLC and LOLC models for Asian/Pacific Islanders, Panels C and D for Hispanics, Panels E and F for Whites, and Panels G and H for Other/Unknown. Note. EOLC, early-onset liver cancer; LOLC, late-onset liver cancer; HBV, Hepatitis B Virus; GERD, Gastroesophageal Reflux Disease; VD, Vitamin D; ADI, Area Deprivation Index; HCV, Hepatitis C Virus; SHAP, SHapley Additive exPlanations
Discussion
EOLC patients exhibited distinct comorbidity profiles by race/ethnicity groups, with HBV infection as the predominant comorbidity in API patients, HCV infection and metabolic disorder-related comorbidities playing significant roles in Hispanic patients, and a more diverse, less concentrated comorbidity profile in White patients. To our knowledge, this is the first study to comprehensively evaluate the comorbidity patterns of EOLC patients by race/ethnicity, providing further insights into the etiology of EOLC and supporting targeted strategies for liver cancer prevention in young populations.
Racial and ethnic disparities in hepatitis virus infections contribute to varying levels of liver cancer risk among different racial/ethnic groups. HBV infection is the most significant comorbidity among API patients. Although chronic HBV infection rates are generally low in the U.S. (<1%), the increased immigration from HBV-endemic regions, such as East Asia and the Pacific Islands, might have led to the rising prevalence of HBV in this population.^34,35^ Immigrants from these areas face chronic HBV risks similar to those in their home countries, where hepatitis B surface antigen prevalence exceeds 2%.^36-39^ Screening and vaccination for HBV in this community is also inadequate. A survey of Asian American primary care providers revealed that 50% did not routinely screen all their Asian patients for HBV. Additionally, over 80% of these providers reported that less than half of their adult Asian patients had received the HBV vaccine.^ 40 ^ In addition, the stigma of HBV infection can further prevent efforts to improve vaccination coverage and early screening, exacerbating the risk of chronic infection and liver cancer.^ 41 ^ Etiologically, HBV can integrate near oncogenes, altering gene expression or function and promoting malignant transformation without cirrhosis, which may contribute to the early onset of liver cancer.^ 42 ^ In contrast, HCV infection is the most prevalent in Hispanics, with a prevalence of 1.5%, which might be associated with higher rates of illicit drug use and limited access to testing and treatment services in this group.^43,44^ Additionally, socioeconomic disadvantages—such as lower income levels and reduced access to healthcare—impede early diagnosis and treatment of HCV, further contributing to elevated infection rates.^ 45 ^ We also observed that HCV prevalence is relatively lower in EOLC cases than in LOLC cases. This finding aligns with the National Health and Nutrition Examination Survey (NHANES) data, which indicates that individuals aged 55-64 are 6.4 times more likely to have active HCV infection than those aged 18-40.^ 46 ^ The lower rate of spontaneous viral clearance among older adults may partly explain this discrepancy.^ 47 ^ Furthermore, as blood screening for HCV began in 1990, many older individuals may have acquired the virus through medical procedures or intravenous drug use before the implementation of widespread preventive measures.^ 48 ^
Apart from hepatitis virus infections, non-infectious comorbidities also display distinct racial disparities. Metabolic conditions, such as hypertension and diabetes, are most prevalent among Hispanics, which results from a combination of genetic, lifestyle, and socioeconomic factors.^ 49 ^ For instance, the R230 C variant in Hispanic individuals has been linked to low High-Density Lipoprotein Cholesterol (HDL-C) levels, while a rare Adiponectin, C1Q And Collagen Domain Containing (ADIPOQ) gene mutation is associated with increased risks of heart disease and insulin resistance.^ 50 ^ These factors may contribute to the high prevalence of metabolic disorders and the high obesity rate of 43.7-47% among Hispanic adults.^51-53^ Socioeconomic barriers further exacerbate the status of metabolic disorders, as many Hispanic individuals face challenges such as lack of health insurance, limited English proficiency, and low education or literacy levels.^51,54^ In addition, communities with lower socioeconomic status often experience reduced access to nutritious food and safe living environments, increasing the risk of developing chronic metabolic diseases.^ 55 ^ In contrast, mental disorders are more prominent in Whites, particularly among younger individuals. This pattern aligns with findings from the general population, where lifetime prevalence rates of mental disorders were highest among Whites (45.6%), followed by Latinos (38.8%) and Blacks (37.0%).^56-60^ Additionally, cultural differences and stigma can affect how mental disorders are reported, potentially leading to lower rates in the racial minorities but higher rates in Whites.^56,61,62^ Moreover, asthma and hypothyroidism are more common among Whites, consistent with their higher prevalence rates of 9.4% and 8.1%, respectively, in this population.^63,64^ Cholangitis, particularly primary sclerosing cholangitis (PSC)—a significant risk factor for hepatobiliary cancer—also shows a higher prevalence among younger White patients.^65-67^ Notably, the incidence of PSC has been rising in several countries, which may contribute to the increasing trend of EOLC.^68-70^ Intriguingly, many of those comorbidities involve autoimmune and inflammatory pathological processes, with their heightened prevalence likely influenced by a combination of genetic susceptibility, socioeconomic factors, and environmental influences. For example, the HLA-Cw*0701 allele is associated with genetic susceptibility to primary sclerosing cholangitis in Whites.^ 71 ^ Furthermore, previous studies have identified that higher socioeconomic status and education levels of White individuals are independently associated with increased risks of thyroid disease.^ 64 ^ Collectively, these results underscore the etiological heterogeneity of EOLC and support the need for risk assessment and clinical surveillance strategies that reflect the predominant comorbidity patterns within each racial group. Understanding that liver cancer may develop through different pathways—such as viral, metabolic, autoimmune, or psychosocial—depending on the population context is essential for informing precision prevention efforts.
The use of machine learning and SHAP values enabled us to quantify racial disparities in comorbidity risk profiles. Our findings showed that race- and ethnicity-specific models for API and Hispanic patients outperformed those for White patients. Additionally, the HCC model demonstrated superior performance compared to the general liver cancer models, highlighting the importance of tailored ML approaches that account for specific racial groups and cancer subtypes. Such models may enable more accurate risk assessments and provide insights for targeted prevention efforts. For example, despite the global implementation of universal HBV vaccination since 2008, HBV remains a dominant risk factor for liver cancer among API patients, particularly in younger populations.^ 72 ^ This highlights the need for enhancing vaccination coverage and early screening in API communities, as well as continued efforts to identify and treat chronic HBV infections. Validating HBV screening results and ensuring timely follow-up care is also crucial for effectively managing chronic HBV infections and reducing the risk of liver cancer in these populations.^ 73 ^ For Hispanic communities, targeted interventions aimed at increasing access to HCV screening and treatment, along with preventing metabolic diseases and obesity, are essential.^ 74 ^ Notably, culturally sensitive interventions have been shown to improve the metabolic health of Hispanic participants, as evidenced by reductions in body mass index (BMI), blood pressure, lipid levels, and hemoglobin A1c.^ 75 ^ In contrast, the more diverse comorbidity patterns observed in White patients may reflect broader genetic, socioeconomic, and lifestyle diversity, which contributes to a range of conditions impacting early diagnosis. These findings suggest a need for public health interventions that address a broader spectrum of risk factors, extending beyond hepatitis virus infections and metabolic disorders. In particular, psychosocial and immune-mediated risk factors warrant further exploration and targeted prevention efforts.
The performance metrics, including F1 scores and AUC values, highlighted the effectiveness of our machine learning models in predicting EOLC risk across diverse racial and ethnic groups. High F1 scores reflect a balance between precision and sensitivity, while robust AUC values underscore the models’ discriminative power. These findings are consistent with the results from the existing liver cancer prediction studies. For example, a machine learning model combining soft ensembles of random forest, XGBoost, and logistic regression achieved an AUC of 0.872 for predicting HCC risk in chronic hepatitis B patients on antiviral therapy.^ 76 ^ Another study, using data from 377,065 participants in the NIH-AARP Diet and Health Study, applied a RUSBoosted Trees model and reported an AUC of 0.72 in the training sample and 0.65 in the validation sample for HCC risk prediction.^ 77 ^ While differences in datasets and study designs limit direct comparisons, our models showed competitive performance and underscored the value of incorporating racial and ethnic factors to develop more equitable, population-specific prediction strategies.
There are several limitations to this study. The UCHDW dataset is not population-based and only captures patient care data generated at the UC Health system. This limits our ability to access the complete medical history of all included patients. To address this limitation, we employed a comprehensive strategy to identify comorbidities, including diagnosis codes, lab test results, and history of specific medications. We also included only those patients who stayed relatively persistent within the UC Health system, defined as having at least two visits recorded in the dataset, to ensure sufficient periods of exposure. Furthermore, the missing rates for behavioral variables (e.g., smoking, alcohol consumption) and BMI were high among young patients, preventing us from assessing the impact of those factors on EOLC prediction. To mitigate this, we included diagnoses of comorbidities such as alcohol and nicotine dependence, as well as metabolic syndrome-related comorbidities, as proxy variables. Additionally, there is potential for bias related to SES and access to healthcare services. Patients with limited access or inadequate insurance coverage may be underrepresented, which could affect the observed prevalence and detection of comorbidities. Although we included the ADI as a proxy for neighborhood-level SES, residual confounding may persist. This limitation should be considered when interpreting the generalizability of our findings.
Conclusions
Collectively, our study underscores the disparity in EOLC risk profiles across racial and ethnic groups and the value of ML in identifying these complex patterns. The results show that HBV infection is the primary comorbidity among API patients, and Hispanic patients are notably affected by HCV and metabolic disorders. In addition, White patients exhibit a broader, less concentrated comorbidity pattern, with mental health disorders and inflammatory conditions also playing important roles. Targeted strategies for those comorbidities are needed to prevent liver cancer in young populations.
Supplemental Material
Supplemental Material - Racial Disparities in Comorbidity Patterns of Early-Onset Liver Cancer: A Machine Learning AnalysisSupplemental Material for Racial Disparities in Comorbidity Patterns of Early-Onset Liver Cancer: A Machine Learning Analysis by Bingya Ma, Kai Zheng, Fa-Chyi Lee, Yunxia Lu in Cancer Control.
The reference list from the paper itself. Each links out to its DOI / PubMed record.
- 1Bray F Laversanne M Sung H , et al. Global cancer statistics 2022: GLOBOCAN estimates of incidence and mortality worldwide for 36 cancers in 185 countries. CA Cancer J Clin. 2024;74(3):229-263. doi:10.3322/caac.2183438572751 · doi ↗ · pubmed ↗
- 2Makarova‐Rusher OV Altekruse SF Mc Neel TS , et al. Population attributable fractions of risk factors for hepatocellular carcinoma in the United States. Cancer. 2016;122(11):1757-1765. doi:10.1002/cncr.2997126998818 PMC 5548177 · doi ↗ · pubmed ↗
- 3Ashktorab H Kupfer SS Brim H Carethers JM . Racial disparity in gastrointestinal cancer risk. Gastroenterology. 2017;153(4):910-923. doi:10.1053/j.gastro.2017.08.01828807841 PMC 5623134 · doi ↗ · pubmed ↗
- 4Siegel RL Giaquinto AN Jemal A . Cancer statistics, 2024. CA Cancer J Clin. 2024;74(1):12-49. doi:10.3322/caac.2182038230766 · doi ↗ · pubmed ↗
- 5Siegel RL Kratzer TB Giaquinto AN Sung H Jemal A . Cancer statistics. CA Cancer J Clin. 2025;75(1):10-45. doi:10.3322/caac.2187139817679 PMC 11745215 · doi ↗ · pubmed ↗
- 6Hsieh MC Ratnapradipa KL Rozek L Wen S Chiu YW Peters ES . Temporal trends and patterns for early- and late-onset adult liver cancer incidence vary by race/ethnicity, subsite, and histologic type in the United States from 2000 to 2019. Cancer Causes Control. 2025;36(5):551-560. doi:10.1007/s 10552-024-01955-439786651 PMC 11982089 · doi ↗ · pubmed ↗
- 7Koh B Tan DJH Ng CH , et al. Patterns in cancer incidence among people younger than 50 Years in the US, 2010 to 2019. JAMA Netw Open. 2023;6(8):e 2328171. doi:10.1001/jamanetworkopen.2023.2817137585204 PMC 10433086 · doi ↗ · pubmed ↗
- 8Ugai T Sasamoto N Lee HY , et al. Is early-onset cancer an emerging global epidemic? Current evidence and future implications. Nat Rev Clin Oncol. 2022;19(10):656-673. doi:10.1038/s 41571-022-00672-836068272 PMC 9509459 · doi ↗ · pubmed ↗