A single nucleotide substitution in the SlMCT gene contributes to great morphological alternations in tomato
Mengyi Yu, Yinge Xie, Zilin Qian, Yu Zhong, Huolin Shen, Wencai Yang

TL;DR
A single mutation in the SlMCT gene in tomatoes causes significant changes in plant growth and fruit color by affecting key metabolic pathways.
Contribution
A rare MCT mutant in tomato reveals how a single nucleotide substitution alters plant development and pigment biosynthesis.
Findings
A single nucleotide substitution in SlMCT causes dwarfism, chlorosis, and yellow fruits in tomato.
Over-expression of wild-type SlMCT restores fruit color and other defective traits in the mutant.
The mutation affects metabolic pathways, altering levels of carotenoids, hormones, and other compounds.
Abstract
Terpenoids, a group of metabolites, are important to plant development and color formation, and serve as valuable nutrients for humans. The enzyme 4-diphosphocytidyl- 2 C-methyl-D-erythritol cytidyltransferase (MCT) plays a pivotal role in the methylerythritol phosphate (MEP) pathway for terpenoid biosynthesis. However, the potential lethality of MCT mutants has hindered further exploration into its functional role in terpenoid metabolite families in plants. Here, we characterized a rare MCT mutant yfm with dwarfism, chlorosis, small leaves, and yellow fruits in tomato. Map-based cloning and sequence analysis revealed that a single nucleotide substitution in the SlMCT gene, which resulted in a point mutation (Leu297Pro) in amino acid in the mutant. Over-expression and complementation of the wild-type SlMCTT in the yfm mutant restored the fruit color and the other defective phenotypes.…
Genes, proteins, chemicals, diseases, species, mutations and cell lines named across the full text — each resolved to its canonical identifier and authoritative record.
Click any figure to enlarge with its caption.
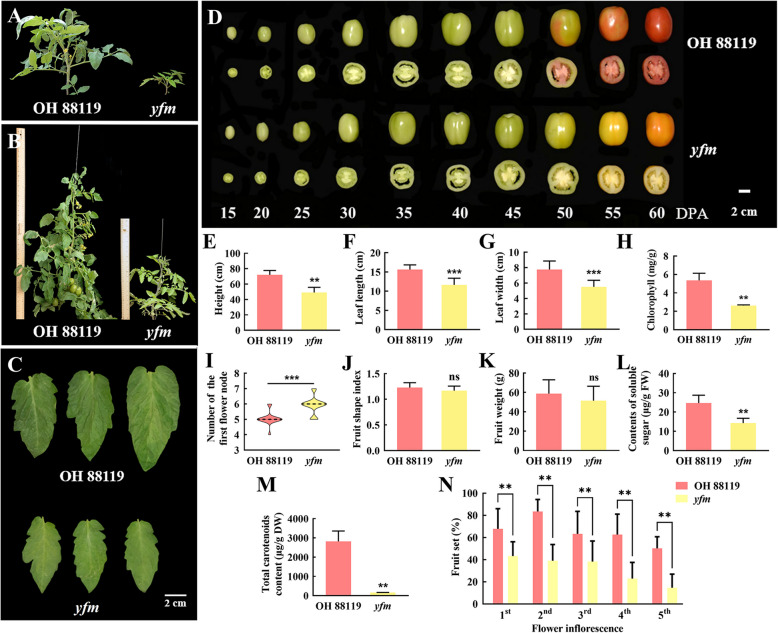 Figure 1
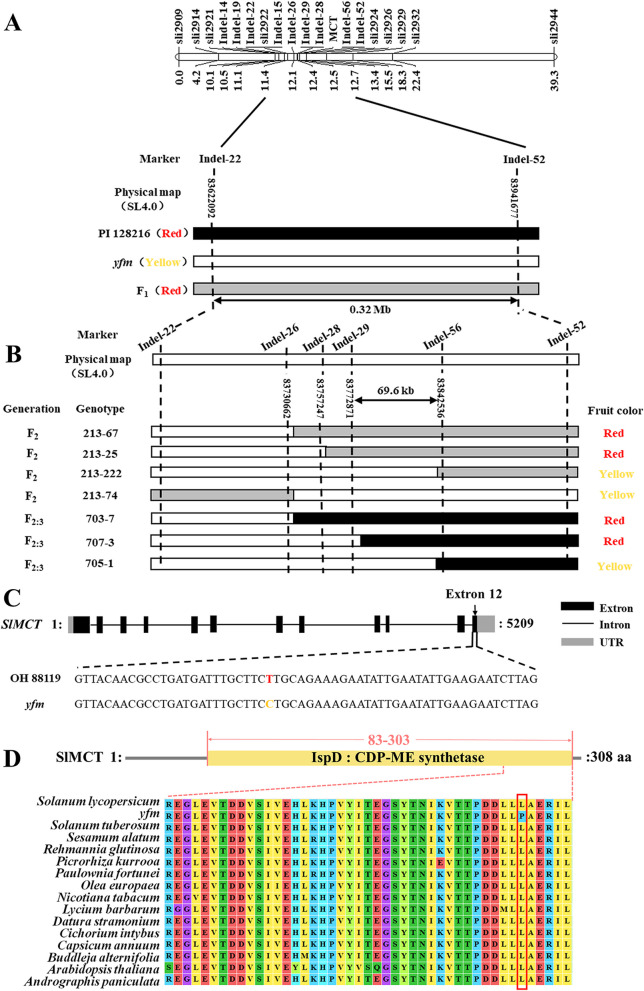 Figure 2
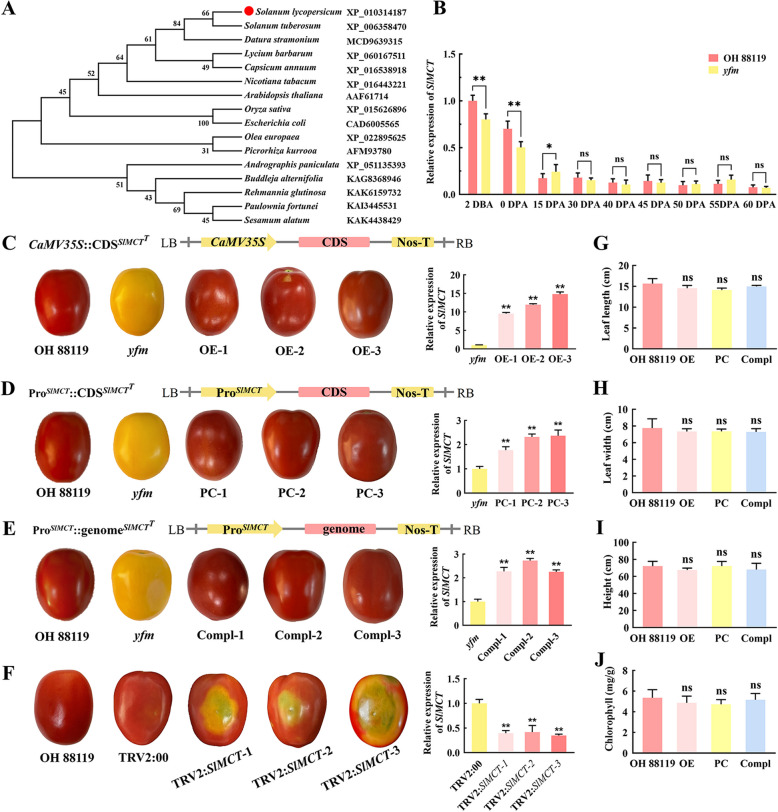 Figure 3
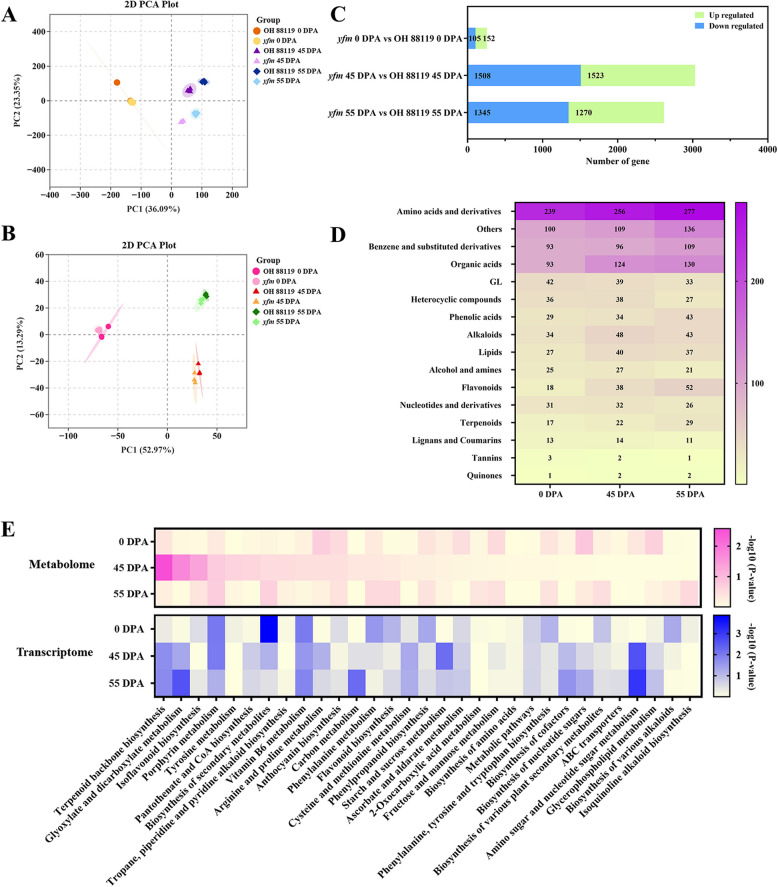 Figure 4
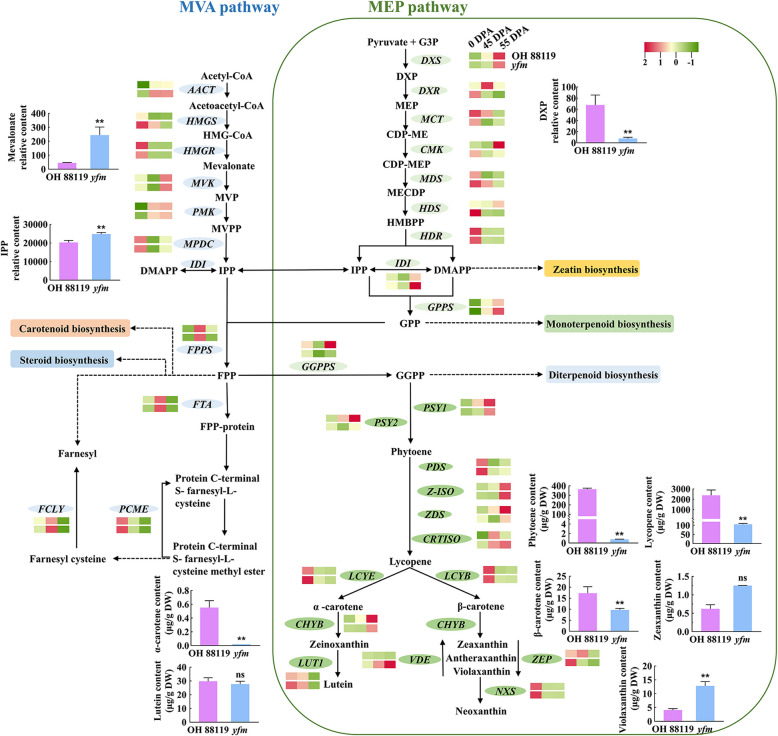 Figure 5
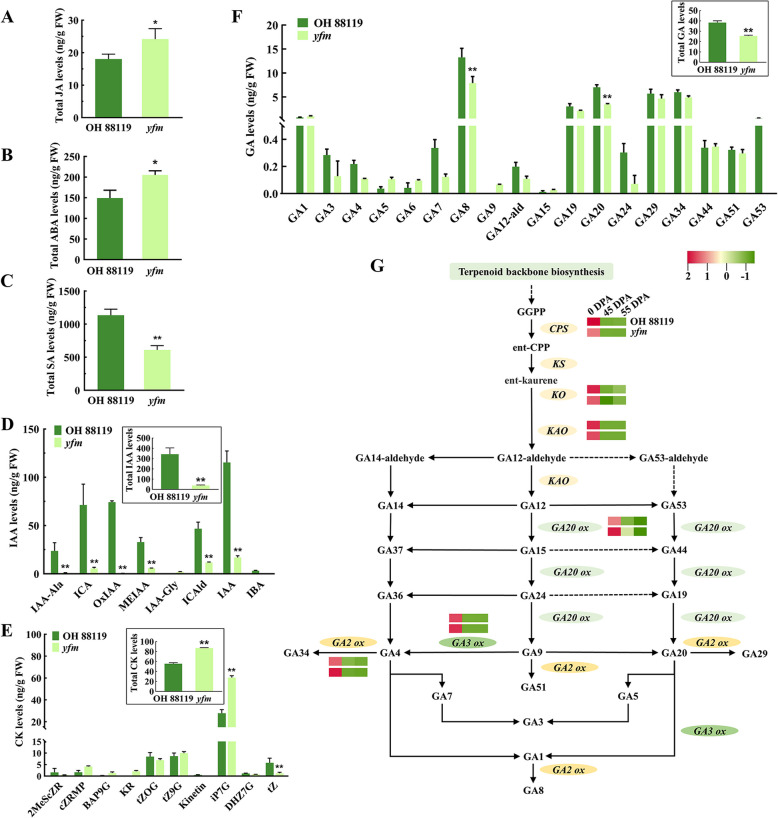 Figure 6
- —National Key Research and Development Program of China
Peer Reviews
No public reviews on file for this paper yet. If you reviewed it on a platform where reviews are public (OpenReview, ICLR, NeurIPS, ICML), you can paste yours below so the community can read it here.
Videos
No videos yet. Explain this paper in a talk, walkthrough, or lecture? Add one.
Taxonomy
TopicsPlant biochemistry and biosynthesis · Plant Reproductive Biology · Photosynthetic Processes and Mechanisms
Core
The single nucleotide substitution in the SlMCT gene disturbs the flux of MEP and other pathways, leading to low contents of carotenoids, chlorophyll, GAs, SA, IAA, and high contents of CK, ABA, and JA, and eventually alters plant morphological traits and fruit color in yfm. The data obtained here provide novel insights for understanding the roles of MCT on plant development and pigments biosynthesis.
Genes and accession numbers
Gene information utilized in this study is accessible in the Sol Genomics Network (https://solgenomics.net/). The accession number of the SlMCT gene is Solyc01g102820 and the accessions of other genes are provided in Supplementary Information (Table S6).
Introduction
Terpenoids, one of the most diverse secondary metabolites, including carotenoids, sterols, phytol, plastoquinone, phytohormones, antioxidants and vitamins, are essential in physiological and biochemical processes, such as pollination, photosynthesis, fruit ripening and stress resistance (Kessler and Baldwin 2001; Pichersky et al. 2006; Li et al. 2024; Zhu et al. 2024). The ubiquity, physiological relevance, and biological activity of terpenoids as well as their contributions to the organoleptic, nutritional, and medicinal quality of plant organs make these molecules as targets for crop improvement (Contreras-Avilés et al. 2024).
Biosynthesis of terpenoids has been intensively investigated for decades. All terpenoids are derived from the five-carbon isopentenyl diphosphate (IPP) and its isomer dimethylallyl diphosphate (DMAPP) by mevalonate (MVA) and methylerythritol phosphate (MEP) pathways (McGarvey and Croteau 1995). The MVA pathway, initially identified in animal systems and fungi, synthesizes IPP from acetyl-CoA by six steps of enzymatic reactions that ultimately generate triterpenes, sesquiterpenes and steroids in the cytosol (Lichtenthaler 1999). The MEP pathway that occurs in the plastid of photosynthetic eukaryotes and most eubacteria (Eisenreich et al. 2004) uses pyruvate and glyceraldehyde- 3-phosphate as substrate, and produces IPP by seven enzymatic reactions under the catalyzation of 1-deoxy-D-xylulose 5-phosphate synthase (DXS), 1-deoxy-D-xylulose 5-phosphate reductoisomerase (DXR), 4-diphosphocytidyl- 2 C-methyl-D-erythritol cytidyltransferase (MCT), 4-(cytidine 5′-diphospho)− 2-C-methyl-D-erythritol kinase (CMK), 2-C-methyl-D-erythritol 2,4-cyclodiphosphate synthase (MDS), 4-hydroxy- 3-methylbut- 2-enyl diphosphate synthase (HDS), and 4-hydroxy- 3-methylbut- 2-enyl diphosphate reductase (HDR). Subsequently, monoterpene, diterpene, and tetraterpene are synthesized using MEP pathway products as precursors (Lichtenthaler et al. 1997; Andrade et al. 2017).
The MCT encoded by the MCT gene, also named as IspD (isoprenoid synthase domain-containing protein), is a key enzyme in the MEP pathway. MCT catalyzes the cytidylation of MEP to produce cytidine diphosphate methylerythritol (CDP-ME) in the third step of the MEP pathway (Rohdich et al. 1999). Previous studies on the IspD protein are mainly focused on the development of new antibacterial and antiparasitic drugs as well as herbicides (Rohdich et al. 2005; Corniani et al. 2014). The enzyme activity of IspD is reduced with the inhibition of DXR, suggesting that IspD potentially acts as a point of particularly metabolic control of the MEP pathway flux (Zhang et al. 2011). However, study on the IspD gene in plants is limited. The first plant IspD gene is identified in Arabidopsis (Rohdich et al. 1999), and two T-DNA insertion mutants of IspD gene exhibit albino with defect in chloroplast development (Hsieh et al. 2008). It has been proposed that IspD may be one of the rate-limiting enzymes in the MEP pathway for saponin biosynthesis due to its extremely low transcription in Panax ginseng (Xue et al. 2019). Although understanding the mechanisms of these biosynthetic routes are important for the potential modulation of the production of key isoprenoids (Cordoba et al. 2011), the lethal phenotype due to mutation of the MCT gene in Arabidopsis (Hsieh et al. 2008) suggests that it might not be possible to create artificial mutants of MCT, which prevents fully elucidation of the role of the MCT gene in terpenoids metabolism.
In this study, we described a mutant yfm with yellow fruit and defective growth phenotypes in tomato (Solanum lycopersicum). Map-based cloning found that the yfm locus contained a single nucleotide substitution (T to C) mutation in the SlMCT (Solyc01 g102820) gene. Genetic functional complementation confirmed that this mutation was responsible for the mutant phenotypes. The SlMCT^C^ allele in the yfm mutant influenced the biosynthesis and metabolism of carotenoids, hormones, and chlorophyll, which resulted in great morphological alternations. These findings provided new insights to understanding the MCT function in fruit coloration and plant development.
Results
Characterization of the yfm mutant
The yfm mutant was discovered in T1 generation of a transgenic line derived from genetic transformation of the Rx4 gene from PI 128216 conferring hypersensitive response to Xanthomonas euvesicatoria pv. perforans race T3 into the susceptible line OH 88119 (Zhang et al. 2021). Six of 20 individuals showed dwarfism with yellow fruits, but the morphological alternations were not associated with resistance to race T3, suggesting that these changes were possibly not a transgenic event. To validate this, genome of T2 individuals showing morphological alternations were re-sequenced in 40 × depth and no T-DNA insertion was detected. Therefore, the yfm is a transgene-free plant and the mutation was most likely caused by tissue culture.
The mutant showed great morphological alternations. Comparing to wild type, plant height of the yfm mutant was decreased 28.6% (Fig. 1A, B, E), leaf size in terms of length and width was also significantly decreased (Fig. 1C, F, G), and the chlorophyll content in leaves of the yfm mutant was significantly lower than that in the wild type (Fig. 1H). The number of chloroplasts was decreased in yfm (Fig. S1) though the chloroplast development in leaf was not significantly different from OH 88119. The number of the first flower node changed from an average of five in OH 88119 to six in yfm (Fig. 1I). The fruit color changed from red to yellow though the developmental stages of fruit had no obvious change (Fig. 1D). The fruit shape index and fruit weight had no significant differences (Fig. 1J, K), but the total soluble sugar content and total carotenoids content in fruits were markedly lower in the yfm mutant comparing with OH 88119 fruits at the fully ripe stage (Fig. 1L, M). Meanwhile, the fruit set was markedly decreased in yfm than in OH 88119 (Fig. 1N).Fig. 1. Phenotypes of OH 88119 and yfm mutant. A and B The plants of OH 88119 and yfm at 15 and 20 weeks, respectively. C Terminal leaflets of OH 88119 and yfm. Bar = 2 cm. D Fruits of OH 88119 and yfm at different developmental stages. DPA, day post anthesis. Bar = 2 cm. E Plant height. Mean values ± SD are shown (n = 30). F Leaf length. G Leaf width. Error bars mean ± SD (n = 15). H Content of chlorophyll in leaves. Mean values ± SD of three biological replicates. I Number of the first flower node. 30 individual plants are counted. J Fruit shape index. K Fruit weight. L The content of soluble sugar in fruit. M Total carotenoids content. Error bars mean ± SD (n = 15). N Percentage of fruit set at each flower inflorescence. Fruit set is calculated as the ratio of fruits:flowers for each flower inflorescence of 15 individual plants of OH 88119 and yfm. A total of 45 fully ripe fruits from 15 individual plants of each genotype are collected for measurements in E-M. Asterisks represent statistically significant differences (**, P < 0.01, *, P < 0.001, ns, no significance) analyzed by student’s t-test
The phenotypic change of yfm is conditioned by a single recessive gene
Two F_2_ populations, OH 88119 × yfm and yfm × PI 128216, were used to determine the genetics of the altered phenotypes in yfm. All F_1_ plants in both crosses showed normal phenotypes with red fruit. In both F_2_ populations, fruit color segregated with a ratio fitting 1 (yellow fruit): 3 (red fruit) (Table 1). Besides, in the F_2_ population of OH 88119 × yfm, all yellow-fruited individuals also exhibited dwarf phenotype, and the red-fruited plants showed normal plant height (Table 1). Since PI 128216 was an accession of S. pimpinellifolium with indeterminate growth habit, plant height in the F_2_ population of yfm × PI 128216 was not evaluated. These results indicated that the yellow fruit color co-segregated with dwarf plant height and was probably controlled by a single recessive gene. Table 1. The segregation of fruit color and plant height in two genetic populationsPopulationGenerationTotal plantsRed fruit plantsYellow fruit plantsNormal height plantsHigh dwarf plantsχ^2^ valueOH 88119 × yfmF_1_66060F_2_23418549185492.06yfm x PI 128216F_1_660F_2_436338981.48
Mapping and identification of the candidate gene for altered phenotypes in yfm
Since the potential co-segregation between fruit color and dwarf phenotype, the fruit color was used as the trait for genetic mapping. For preliminary mapping of the gene conferring the yellow fruit, 87 InDel markers (Table S1) evenly spanning across all the 12 tomato chromosomes were used to genotype 92 individual plants randomly selected from the F_2_ population of yfm × PI 128216. Single marker-trait association analysis revealed that the marker Sli2914 on chromosome 1 was highly associated with the fruit color (P < 0.0001). Therefore, additional markers (Table S1) near the region of Sli2914 were developed and used to determine the precise position of the gene using all individuals in the F_2_ population. The gene was found to be located at a 0.32 Mb region between two markers Indel- 22 and Indel- 52 (Fig. 2A). With 648 F_2:3_ individuals derived from three F_2_ heterozygous recombinants (213–25, 213–222, and 213–74), the yfm locus was ultimately narrowed down to a 69.6 kb region between two markers Indel- 29 and Indel- 56 (Fig. 2B). In this region, ten genes were annotated in the reference genome SL4.0 of Heinz 1706 (Table S2).Fig. 2. Map-based cloning of yfm. A Preliminary mapping of the yfm locus. B Fine mapping of the yfm locus. C The gene structure of the candidate gene SlMCT (Solyc01 g102820). The SNP (T to C) mutation is indicated by different color. D Alignment of MCT homologs from different species. The amino acid polymorphism caused by yfm mutation is marked by red box. The protein accession numbers of MCT proteins in different species are as follows. Solanum lycopersicum, XP_010314187; Solanum tuberosum, XP_006358470; Sesamum alatum, KAK4438429; Rehmannia glutinosa, KAK6159732; Picrorhiza kurrooa, AFM93780; Paulownia fortune, KAI3445531; Olea europaea, XP_022895625; Nicotiana tabacum, XP_016443221; Lycium barbarum, XP_060167511; Datura stramonium, MCD9639315; Cichorium intybus, KAI3707769; Capsicum annuum, XP_016538918; Buddleja alternifolia, KAG8368946; Arabidopsis thaliana, AAF61714; Andrographis paniculata, XP_051135393
Comparison of re-sequenced genomes between OH 88119 and yfm revealed that only one nucleotide substitution (T in OH 88119 and C in yfm) was found at the last exon of the gene Solyc01 g102820 in this region (Fig. 2C). Based on the annotation, Solyc01 g102820 encodes MCT, a key enzyme in the MEP pathway (Table S2).
Sequence alignment showed that the IspD domain in the MCT protein was highly conserved in diverse plant species (Fig. 2D). In plant species, MCT was a single-copy gene, and the SlMCT from S. lycopersicum showed the highest homology to that of S. tuberosum (Fig. 3A). The single nucleotide substitution of T to C resulted in an amino acid substitution (Leu297Pro) in yfm (Fig. 2D). The SNP could be detected as a dCAPS marker (Fig. S2) and exhibited complete co-segregation with fruit color in both F_2_ populations derived from crosses OH 88119 × yfm and yfm × PI 128216. These results indicated that SlMCT (Solyc01 g102820) was the candidate gene for the yellow fruit and other abnormal phenotypes in yfm.Fig. 3. Functional validation of the SlMCT gene. A Phylogenetic tree of MCT homologs in different species. The phylogenetic tree is constructed by MEGA 7.0 using Neighbor-Joining method with 1000 bootstrap replicates. The accession numbers of protein are listed in the right.** B** The relative expression levels of SlMCT at different fruit developmental stages in OH 88119 and yfm mutant quantified by RT-qPCR. C Fruit color and gene expression in lines with over-expression of SlMCT^T^ from OH 88119 driven by CaMV35S promoter in yfm mutant. D Fruit color and gene expression in lines with over-expression of SlMCT^T^ from OH 88119 driven by the promotor of SlMCT^T^ in yfm mutant. E Fruit color and gene expression in lines with functional complementation of the SlMCT^T^ gene in yfm. A 7281 bp fragment, containing promotor (2147 bp) and genomic DNA (5134 bp) of SlMCT is transformed in yfm mutant to restore the phenotype. F Fruit color and gene expression in lines with SlMCT^T^ silenced by VIGS in OH 88119 fruits. TRV2:00 is empty vector. For B, C, D, E, and F, the relative expression of SlMCT is quantified by RT-qPCR with three biological replications and three technical replications. Error bars mean ± SD (n = 3). G-J. Leaf length, leaf width, plant height, and content of Chlorophyll in transgenic lines and OH 88119. For, G, H, I, and J, at least three individual plants are pooled together for each line as one biological replicate, and three lines are detected in different types of transgenic plants. Error bars represent mean values ± SD. Significance analysis is analyzed by student’s t-test (**, P < 0.01, ns, no significance)
Functional validation of the SlMCT gene
The relative expression of the SlMCT gene could be detected in all organs and tissues with the highest in leaves (Fig. S3). Expression of the SlMCT gene showed a high level at the early stage of fruit development, 2 days before anthesis (DBA) and 0 days post anthesis (DPA), and then gradually decreased accompanied by the fruit development, but there was no significant difference between OH 88119 and yfm in each developmental stage (Fig. 3B, Fig. S3). To further confirm whether SlMCT was the candidate gene for the yfm mutant, SlMCT^T^ was functionally complemented and over-expressed in the yfm mutant. In the over-expression transgenic lines, the expression of SlMCT^T^ driven by CaMV35S promoter was up-regulated by 9.5 ~ 14.8-fold compared to that in yfm, and colors of fully ripe fruits of OE- 1, OE- 2, and OE- 3 lines were red (Fig. 3C). The transgenic lines PC- 1, PC- 2, and PC- 3 expressing SlMCT^T^ CDS driven by its native promotor also borne red fruits (Fig. 3D). Similarly, the fruit color was changed from yellow to red in Compl- 1, Compl- 2, and Compl- 3 lines, which were functionally complemented by the full-length genomic DNA of SlMCT^T^ in the yfm mutant (Fig. 3E). Furthermore, all other altered morphological phenotypes in yfm were also recovered in transgenic plants. In all transgenic lines, leaf length, leaf width, plant height, and the chlorophyll content were not significantly different from OH 88119 (Fig. 3G to J). These results suggested that the yellow fruit and dwarf plant height were controlled by a single recessive gene and the single nucleotide substitution in the SlMCT gene was the cause of morphological alternations in the yfm mutant.
Surprisingly, in vitro assay showed that the enzymatic activity of SlMCT^Leu297Pro^ was significantly higher than that of wild type. But enzymatic activities in different mixture of SlMCT^Leu297Pro^ and wild type were not significantly different from that of wild type (Fig. S4B). This data suggested that there was a potential competition between the mutant and wild type. Presence of wild type might have priority to use substrates and inhibit the activity of the mutant type.
The mutation of SlMCT alters transcription and metabolism in tomato
Comparative transcriptomic and metabolic analyses were performed to unravel the potential network for SlMCT-mediated fruit development and color formation using fruits of OH 88119 and yfm collected at 0, 45, and 55 DPA. Principal component analysis (PCA) of transcriptome and metabolome, and correlation analysis showed a significant similarity among the three biological replications within each genotype at the same period, suggesting the high reproducibility of the data (Fig. 4A, B). In transcriptome, the samples of OH 88119 and yfm at 0 DPA were clustered together, the samples of OH 88119 at 45 DPA and 55 DPA were clustered together, and the samples of yfm at 45 DPA and 55 DPA were in the same cluster (Fig. 4A). However, the samples of OH 88119 at 45 DPA were clustered together with the samples of yfm at 45 DPA and the samples of OH 88119 at 55 DPA were clustered together with the samples of yfm at 55 DPA in metabolome (Fig. 4B). One possible interpretation of this phenomenon was that the broad-target metabolomics approach used here mainly detected the primary metabolites, which might not be significantly different between wild type and the mutant at the same fruit developmental stages.Fig. 4. Transcriptome and metabolome analysis of the yfm mutant and OH 88119 fruits. A and B. Principal component analysis (PCA) plot. The transcriptome (A) and metabolome (B) PCA are analyzed from the OH 88119 and yfm fruit at 0, 45, and 55 DPA developmental stages. C Distribution of the downregulated and upregulated DEGs (differentially expressed gene). The expressed genes in yfm fruits are compared with the same developmental stage in OH 88119. D Heatmap shows the DAMs (differential accumulation metabolite) categories. The metabolites in yfm fruits are compared with the same developmental stage in OH 88119. E KEGG enrichment analysis of DEGs and DAMs from the OH 88119 and yfm fruit at 0, 45, and 55 DPA developmental stages
Differences at transcriptional and metabolic levels between OH 88119 and yfm were gradually increased during the fruit development. Transcriptomic changes were detected after 0 DPA (Fig. 4C). A total of 257 (152 upregulated, 105 downregulated), 3031 (1523 upregulated, 1508 downregulated), and 2615 (1270 upregulated, 1345 downregulated) differentially expressed genes (DEGs) were identified between yfm and OH 88119 at 0, 45, and 55 DPA, respectively (Table S3). Meanwhile, the total differential accumulation metabolites (DAMs) were increased, but the upregulated DAMs were decreased during the fruit development. A total of 801 (439 upregulated, 362 downregulated), 921 (386 upregulated, 535 downregulated), and 977 (350 upregulated, 627 downregulated) DAMs were identified between yfm, and OH 88119 at 0, 45, and 55 DPA, respectively. These DAMs could be divided into 16 classes (Fig. 4D, Table S4).
KEGG enrichment conjoint analysis using DEGs and DAMs at three stages revealed that these DEGs and DAMs were primarily involved in thirty-one biosynthesis and metabolism pathways (Fig. 4E, Table S5). A significant correlation in the terpenoid backbone biosynthesis between both metabolome and transcriptome was detected at 45 DPA, indicating that SlMCT gene might regulate plant development and fruit color formation through the terpenoid backbone biosynthesis. Some changes were also found in glyoxylate and dicarboxylate, porphyrin, vitamin B6 metabolism etc., which might be secondary effects due to the metabolic and transcriptional changes (Fig. 4E).
The mutation of SlMCT influences MEP pathway and carotenoid biosynthesis
The biosynthesis of the terpenoid backbone serves as precursors for the synthesis of carotenoids and phytohormones. To clarify the mechanism underlying the difference in fruit color between OH 88119 and the yfm mutant, we investigated the expression levels of genes involved in terpenoid backbone and carotenoids biosynthesis, and the carotenoid content in fruits at 60 DPA.
In the MVA pathway, most genes such as AACT, HMGS, MVK, PMK, and MPDC were up-regulated in the yfm, while the gene HMGR was down-regulated. However, the relative content of mevalonate in yfm was increased over 5.4-fold (Fig. 5, Table S6). In the MEP pathway, except for SlMCT and MECPS, the expressions of other genes were up-regulated at 0 DPA but subsequently down-regulated at 45 and 55 DPA. Specifically, the expression of SlMCT was down-regulated at 0 and 45 DPA but slightly upregulated (1.2-fold) at 55 DPA, which was consistent with the RT-qPCR data (Fig. 3B). The transcript level of MECPS showed an up-regulation trend during all stages. In metabolome, the content of 1-deoxy-D-xylulose 5-phosphate (DXP) was significantly decreased in the yfm mutant, exhibiting a more than nine-fold reduction compared to OH 88119. Additionally, IDI, a key enzyme involved in both the MVA and MEP pathways, was up-regulated at 0, 45, and 55 DPA, and the relative content of isopentenyl pyrophosphate (IPP) was also increased (1.25-fold) in the yfm (Fig. 5, Table S6).Fig. 5. Schematic representation of isoprenoid biosynthesis in tomato. Solid lines with arrow present the direction of signal transduction pathways, including MEP, MVA, and carotenoid biosynthesis pathways. MEP pathway occurring in plastid is indicated by green box, while the blank space outside the green box presents cytosol with MVA pathway occurring. Heatmap shows the expression pattern of genes related to isoprenoid biosynthesis from RNA-seq data at 0, 45, and 55 DPA fruit developmental stage in OH 88119 and yfm. Histogram shows the content of metabolites involved in isoprenoid biosynthesis detected by metabolome at 55 DPA fruit developmental stage and carotenoid-targeted metabolome at 60 DPA in OH 88119 and yfm, respectively. Error bars represent mean values ± SD (n = 3). Significance analysis is analyzed by student’s t-test (**, P < 0.01, ns, no significance)
IPP and DMAPP were precursor substances for the synthesis of terpenoid derivatives. As shown in Fig. 5 and Table S6, the genes in the farnesyl pyrophosphate (FPP) metabolic pathway exhibited significant increases in transcription level in yfm than in OH 88119, but the expression of geranylgeranyl pyrophosphate synthase (GGPPS) was down-regulated. Both PSY1 and PSY2, which encode the crucial enzyme PSY (Phytoene synthase) for carotenoid biosynthesis, were also significantly down-regulated (Fig. 5, Table S6). The carotenoid content measurement showed that phytoene content in OH 88119 was 365.86 μg/g, but hardly detected in yfm (0.78 μg/g). Moreover, the contents of lycopene, α-carotene and β-carotene were reduced 22-fold, 2.5-fold, and two-fold, respectively, in yfm compared to OH 88119. No significant difference in lutein and zeaxanthin content was detected between yfm and OH 88119. However, the content of violaxanthin was 12.81 μg/g in yfm, which was three-fold higher than in OH 88119. These results suggested that the SlMCT gene in the MEP pathway acted upstream of carotenoid synthesis to regulate the fruit color in tomato.
SlMCT affects plant development by regulating phytohormone biosynthesis
To determine the causes of the plant dwarfism and morphological changes in yfm, the contents of six phytohormones were measured. Compared to OH 88119, significant increases in the total JA, ABA, and CK contents were detected in the yfm mutant. Total JA contents were 24.19 ng/g in yfm and 18.03 ng/g in OH 88119 (Fig. 6A), and the total ABA contents were 205 ng/g in yfm and 149.21 ng/g in OH 88119 (Fig. 6B). On the contrary, the total SA and IAA contents were decreased in yfm. The total SA content in yfm was decreased by 46.25% compared with OH 88119 (Fig. 6C). Meanwhile, the total IAA content was significantly decreased to 39.07 ng/g in yfm than that of OH 88119 (342.49 ng/g), and two common bioactive IAA forms IAA and IAA-Ala decreased by 85.35% and 95.65%, respectively (Fig. 6D). The total CK content was 87.13 ng/g in yfm, which was 1.56-fold than in OH 88119 (Fig. 6E). Intriguingly, the content of iP7G was increased 2.17-fold in yfm, while the content of tZ was significantly decreased by 79.17% compared to OH 88119 (Fig. 6E).Fig. 6. Phytohormone concentrations in OH 88119 and yfm. The jasmonic acid (JA, A), abscisic acid (ABA, B), salicylic acid (SA, C), indoleacetic acid (IAA, D), cytokinin (CK, E), and gibberellin acid (GA, F) levels are measured using LC-MS/MS. FW, fresh weight. Error bars represent mean values ± SD (n = 3). Significance analysis is analyzed by student’s t-test (**, P < 0.01, *, P < 0.05). G. Schematic diagram of GA biosynthesis pathway
Overall, the GA contents were decreased in yfm compared to OH 88119 (Fig. 6F). The content of GA8 was significantly lower in yfm (7.90 ng/g) than in OH 88119 (13.26 ng/g), and the content of GA20 in yfm (3.45 ng/g) was decreased compared with OH 88119 (7.02 ng/g) (Fig. 6F). Expressions of genes in GA biosynthesis pathway, including ent-Copalyl Diphosphate Synthase (CPS), ent-Kaurene Oxidase (KO), ent-Kaurenoic Acid Oxidase (KAO), GA 2-oxidase (GA2ox), GA 3-oxidase (GA3ox), and GA 20-oxidase (GA20ox) were thoroughly examined in the RNA-seq data. The results showed that expressions of CPS, KO, and KAO were decreased in yfm, but GA2ox, GA3ox, GA20ox were up-regulated at 0 DPA and down-regulated at 45, 55 DPA (Fig. 6G, Table S6). The altered GAs content in yfm was possibly caused by changes in the expression of GA biosynthesis pathway genes.
Discussion
yfm reveals crucial roles of MCT on plant development and pigments biosynthesis
MCT is a key enzyme in the MEP pathway that produces terpenoids as precursors for biosynthesis of a wide variety of monoterpenes, diterpenes, and carotenoids. It is not surprising that loss of function of MCT can severely affect development and even lead to a lethal phenotype. Therefore, few works on characterization of the MCT gene have been conducted in plants due to the lack of mutant. In the current study, the tomato mutant yfm showed great morphological alternations including dwarfism, chlorosis, small leaves, and yellow fruits (Fig. 1A to D) but could survive under greenhouse conditions. However, the fruit weight and size of yfm were not significantly different from that of OH 88119 (Fig. 1J, K), suggesting that yfm might diminish the fruit count to facilitate normal fruit development (Fig. 1N). Contents of total carotenoids and chlorophyll were significantly decreased in the mutant comparing with the wild type (Fig. 1H, M). Genetic mapping, sequence analysis, and functional validation indicated that mutation of the SlMCT gene was responsible for the abnormal phenotypes in yfm. In addition, the chloroplast of yfm showed abnormal development (Fig. S1) and the chloroplast number was reduced, which were consistent with the phenomena observed in T-DNA insertion mutants of the MCT gene in Arabidopsis (Hsieh et al. 2008). Abnormal development and reduced number of chloroplasts might affect normal photosynthesis, reduce photosynthetic products, and subsequently result in dwarf and chlorosis of plants. All data obtained here indicated that the MCT gene not only plays a crucial role in development but also severely affects pigments biosynthesis in plants.
The single nucleotide substitution in the SlMCT gene contributes to multiple phenotypic changes of yfm
Single nucleotide polymorphisms (SNPs) are the most commonly occurring variants during plant evolution and domestication (Akbari et al. 2021). In many crops, phenotypic changes due to SNPs have been reported, but most SNPs lead to alternations of a single trait. A single nucleotide substitution (C/T) in the SP (self-pruning) gene results in the change of plant growth habit from indeterminate to determinate in tomato (Pnueli et al. 1998). Similarly, the introduction of a premature stop codon SNP in Rht-B1 d and Rht-B1e (Reduced height) loci conferring insensitivity to the growth-promoting hormone gibberellic acid inhibits cell growth and reduces plant height in the Green Revolution wheat (Triticum aestivum) varieties (Pearce et al. 2011).A naturally occurring rare SNP in Brachytic2 coding sequence increases yield and reduces plant height, which is considered as the causative mutation of the major plant height QTL, qph1 in maize (Zea mays) (Xing et al. 2015). However, the single nucleotide substitution in the SlMCT gene reported here led to pleiotropic effects on tomato plant and fruit, which was different from most previous findings. This might be due to the crucial role of the SlMCT gene on plant development and pigment biosynthesis.
SlMCTC alters the terpenoid biosynthesis flux in yfm
The MEP pathway is one of the main pathways to synthesize terpenoids, which are essential to the plant growth and development (Dudareva et al. 2013). It has been demonstrated that the first enzyme in the MEP pathway1-deoxy-D-xylulose 5-phosphate synthase (DXS) is subject to feedback regulation, resulting in the inhibition of the MEP pathway flow (Cordoba et al. 2011). The increase of IPP/DMAPP content resulting in lower DXS activity has been reported in both bacteria and plants (Di et al. 2023). In the present study, the IPP content was increased in yfm (Fig. 5), while the DXS gene was down-regulated comparing with OH 88119 (Fig. 5), which was consistent with previous findings (Di et al. 2023). This data suggested that the MEP pathway flux might be inhibited by the feedback regulation in yfm.
In addition, over-expression of the fusion gene DXS-FPPS encoding a fusion protein of DXS linked with farnesyl diphosphate synthase (FPPS) in plastids of tomato results in substantial reduction in lycopene content and the variation of yellow fruit (Chen et al. 2023), which suggests a metabolic competition between the FPP metabolic pathway and carotenoid biosynthesis. In yfm, the transcriptional levels of genes involved in the FPP metabolic pathway, including FTA, FCLY, and PCME, were significantly increased (Fig. 5). However, GGPPS was down-regulated, causing significantly decrease of chlorophyll and GAs in yfm, which were derived from GGPP (Fig. 5). The genes in the carotenoid biosynthesis, such as PSY1 and PSY2, also exhibited significant reductions at transcriptional level leading to substantial decrease in lycopene content in yfm (Fig. 5). Therefore, the feedback inhibition of MEP pathway and the upregulation of FPP metabolic pathway might potentially break metabolic balance and was responsible for the plant dwarfing and yellow fruit in yfm mutant.
Materials and methods
Mapping populations
The yfm mutant with yellow fruit and other abnormal phenotypes is derived from OH 88119 during the tissue culture process of Agrobacterium-mediated transforming the Rx4 gene for resistance to bacterial spot from resistance accession PI 128216 into susceptible line OH 88119 (Zhang et al. 2021; see results for details). Two F_2_ populations and derived F_2:3_ families were used to finely locate the gene conferring mutant phenotypes in yfm. The first F_2_ population was derived from a cross between a red-fruited processing tomato inbred line OH 88119 (Xiao et al. 2020) and the yfm mutant. The second F_2_ population was developed by crossing the yfm mutant to S. pimpinellifolium accession PI 128216 with red fruit. All seeds were sown in 72 Square Plug Tray Deep (Taizhou Longji Gardening Materials Co., Zhejiang, China) filled with a mixture of peat, perlite, and vermiculite (3:1:1). The seedlings were transplanted to a greenhouse and grown at 24–28℃ (day) and 16–20℃ (night) with water and fertilizers supplied as recommended for commercial production (Gao et al. 2010).
Phenotypic data collection
Plant height was measured and number of nodes of the first flower was counted from 15 25-week-old plants of each genotype. Leaf length and width were measured using the 4 th fully developed terminal leaflet from 15 individual plants of each genotype. The chlorophyll was extracted from 0.25 g fresh leaves with 95% ethanol in darkness (the same sample used for leaf length and width measurement), and the OD value at 649 and 665 nm were determined using Multimode microplate reader (Tecan Group (Männedorf), Männedorf, Switzerland), and then concentrations were calculated using the method described previously (Lichtenthaler and Wellburn 1983). A total of 45 fully ripe fruits from 15 individual plants of each genotype were subjected to fruit shape index (fruit longitudinal diameter/transverse diameter), fruit weight, and soluble sugar content measurement. The soluble sugar content was detected by the plant soluble sugar content assay kit according to the manufacturer’s protocol (Solarbio Science and Technology (Beijing) Co., Ltd., Beijing, China). For the fruit set, all the flowers from the first to the fifth inflorescences were marked and fruit set was recorded and calculated as the ratio of fruits:flowers for each flower inflorescence of 15 individual plants of OH 88119 and yfm.
Marker analysis and genetic mapping
Genomic DNA was isolated from freshly collected young leaves using the modified CTAB methods. Molecular markers (Table S1) used for mapping of the gene were either adopted from a previous publication (Yang et al. 2014) or developed by comparing genomic DNA sequences between PI 128216 and OH 88119 (this study). Insertion/deletion (InDel) markers were analyzed following our previous protocol (Yang et al. 2014), while single nucleotide polymorphic markers were detected by dCAPs (Fig. S2) or Sanger sequencing. Linkage map was created using JOINMAP4.0 (https://joinmap.software.informer.com/).
Genetic transformation and virus-induced gene silence
Gene function was validated through complementary experiments in the yfm mutant and virus-induced gene silence (VIGS) of the gene in fruits of OH 88119.
For the complementation experiment, a 7281 bp fragment consisting of promoter (2147 bp) and genomic DNA (5134 bp) region of the SlMCT^T^ allele was cloned from OH 88119 and inserted into plant expression vector pCAMBIA- 1305 using Kpn I and Nco I restriction sites (Table S1). In addition, pCAMBIA- 1300 vector containing the full-length CDS (924 bp) of SlMCT^T^ allele from OH 88119 was constructed using Kpn I and Hind III restriction sites (Table S1), and this recombinant vector was used to over express the SlMCT^T^ allele from OH 88119 in the yfm mutant driven by CaMV35S promoter and its native promoter region, respectively. Agrobacterium tumefaciens strain GV3101 was used to transform the recombinant vectors into tomato according to the previous method (Fillatti et al. 1987) with some modifications.
VIGS was performed using the previously described method (Zhang et al. 2021). A specific 300 bp fragment (from 311 to 610 bp) of the SlMCT^T^ gene amplified from the cDNA of OH 88119 using gene-specific primers (Table S1) was inserted into pTRV2 vector using EcoR I and BamH I restriction sites. The empty vector pTRV1 and pTRV2 and the recombinant vector pTRV2-MCT were transformed into GV3101 cells, respectively. Transformed Agrobacterium was mixed by 1:1 ratio following the combination of pTRV1:pTRV2 and pTRV1:pTRV2-MCT. At least 30 fruits at mature green (MG) stage from 10 OH 88119 individual plants were infiltrated for each combination according to the protocol previously described (Fu et al. 2005).
Carotenoid content measurement
The fully ripe fruits of OH 88119 and yfm at 60 DPA were used to measure the carotenoid content. Fifteen fruits from six individual plants were pooled as one sample, and three samples were harvested for each genotype. The fruit sample was grounded into powder in liquid nitrogen, and at least 5 g freeze-dried sample was subjected to measurement of carotenoids contents using the AB Sciex QTRAP 6500 LC-MS/MS platform at Metware Biotechnology Company (Wuhan, China).
Transcriptome and metabolome analysis
Fruits of OH 88119 and the yfm mutant were harvested at 0, 45, and 55 DPA. Three fruits from each of five plants were collected and mixed as one sample with three biological replications for each genotype. Transcriptome sequencing and metabolome detection were performed on the Illumina sequencing platform and UPLC-MS/MS system, respectively, at Metware Biotechnology Company. The threshold of log2 (fold change) ≥ 1 and false discovery rate (FDR) ≤ 0.05 were used for defining the differentially expressed genes (DEGs), and differential accumulation metabolites (DAMs) were screened by VIP (Variable Importance in Projection) > 1 and absolute log2 FC ≥ 1. The transcriptomic and metabolomic graphs were analyzed using the online platform at Metware Cloud (https://cloud.metware.cn/).
In vitro enzyme activity assay
The enzyme activity was assayed following the diagram of the catalytic reaction of SlMCT (Fig. S4 A), the SlMCT CDS amplified from cDNA of OH 88119 and the yfm mutant were separately ligated into the pET- 28a plasmid at BamH I and Xho I restriction sites to create recombinant vectors of the pET- 28a-SlMCT, pET- 28a-SlMCT^Leu297Pro^. All resulting constructs were transformed into Escherichia coli strain BL21 (DE3) cells according to the manufacturer’s instructions (Sangon Biotechnology (Shanghai) Co., Ltd., Shanghai, China), and the BL21 cells harboring pET- 28a were used as the negative control. The transformed cells were cultured in lysogeny broth (LB) liquid medium with 100 mg/L kanamycin at 37℃ until the optical density at 600 nm (OD600) reached 1.0. Then isopropyl-beta-D-thiogalactopyranoside (IPTG) was added to a final concentration of 1.0 mM, and the cells were cultured at 160 rpm and 16℃ for 12 h to induce recombinant protein expression. Cells were collected via centrifugation, and then broken up by ultrasound. The SlMCT and SlMCT^Leu297Pro^ recombinant proteins were isolated and purified using the HisSep Ni–NTA Agarose Resin 6 FF (Yeasen Biotechnology (Shanghai) Co., Ltd., Shanghai, China). The enzyme activity of the SlMCT, SlMCT^Leu297Pro^ and proteins mixed at different proportions were performed in vitro. A concentration of 20 mM recombinant protein was added to 60 μL reaction system containing 5 mM MgCl_2_, 1 mM DTT, 1 mM CTP, 0.5 mM MEP, and 0.1 U inorganic pyrophosphatase in 100 mM Tris–HCl buffer solution (pH = 8.0). The mixture was incubated at 37℃ for 2 h and the reaction was quenched by incubating at 80℃ for 20 min. The pyrophosphatase in the reaction system was used to hydrolyze PPi to produce Pi. Then, the mix solution of malachite green and molybate (Beyotime Biotechnology (Shanghai) Co., Ltd., Shanghai, China) was added in the system to chelate Pi for 30 min color formation and the absorbance at 630 nm of the mixture measured by the microplate reader was used to calculate the Pi content, which represented the enzyme activity (Wang et al. 2024). All experiments were conducted with three replications.
RNA extraction and RT-qPCR analysis
To explore the expression pattern of the SlMCT gene during fruit development, flower and fruits of OH 88119 and the yfm mutant were collected at 2 DBA, 0 DPA, 15 DPA, 30 DPA, 40 DPA, 45 DPA, 50 DPA, 55 DPA, and 60 DPA. Total RNA was extracted using Maxwell® RSC Plant RNA Kit (Promega (Beijing) Biotech Co., Ltd., Beijing, China) and reverse transcribed into cDNA using HiScript II RT SuperMix for qPCR (Vazyme Biotechnology (Nanjing) Co., Ltd., Nanjing, China). The One Step PrimeScript III RT-qPCR Mix (Takara Biotechnology (Dalian) Inc., Dalian, China) was used for RT-qPCR with gene-specific primers (Table S1). Expression of the tomato gene UBI (Solyc01 g056940) was used as the internal control. Reactions for the reference genes were included in each 96-well plate and each sample was analyzed independently with three biological replications and three technical replications. The relative expression was calculated using the 2^− ΔΔCt^ method (Livak and Schmittgen 2001).
Transmission electron microscopy
Three leaves of OH 88119 and the yfm mutant plants at 45-d-old were used to visualize the chloroplast ultrastructure and the middle region of the leaf away from vein. Leaves were fixed in 2.5% glutaraldehyde and dehydrated in ethanol. Thirty fields of view per sample were screened and the electron microscopy imaging experiment was conducted at the electron microscopy Laboratory in College of Biological Science at China Agriculture University.
Phytohormone content measurement
Leaves were collected from OH 88119 and the yfm mutant 15 weeks after planting for phytohormone measurement. Thirty leaves from 10 individuals of each genotype were separately pooled as one sample, and three biological replications were performed for each genotype. Leaves were immediately frozen in liquid nitrogen and stored at − 80℃. JA, ABA, SA, IAAs, and CK were extracted from 50 mg for each sample with 1 mL MeOH/H_2_O/formic acid (15:4:1, v/v/v). GAs was extracted from 100 mg for each sample with 1.5 mL 70% (v/v) acetonitrile by ultrasound-assisted extraction for 30 min and centrifugation at 12000 rpm for 10 min. Then 1 mL supernatant was collected for measurement of phytohormone content using LC-MS/MS (Niu et al. 2014) at Metware Biotechnology Company.
Supplementary Information
Supplementary Material 1: Supplementary Figure S1. Transmission electron microscopy of plastid in OH 88119 and yfm leaf. Supplementary Figure S2. Images of agarose gel electrophoresis for partial individuals in the F_2_ populations of OH 88119 × yfm (A) and yfm × PI 128216 (B) using the dCAPs marker. Supplementary Figure S3. Spatial and temporal expression analysis of the SlMCT gene. Supplementary Figure S4. Catalytic activity assay of wild type SlMCT and mutant SlMCTLeu297Pro. Supplementary Table S1. Information for primers used in this study. Supplementary Table S2. Candidate genes in the fine mapping region between Indel- 29 and Indel- 56 markers on chromosome 1. Supplementary Table S3. Differentially expressed genes (DEGs) between OH 88119 and yfm in transcriptome. Supplementary Table S4. Differential accumulation metabolites (DAMs) between OH 88119 and yfm in metabolome. Supplementary Table S5. The conjoint analysis of transcriptome and metabolome between OH 88119 and yfm. Supplementary Table S6. Heatmap of the transcriptional level of genes involved in the terpenoid and carotenoid biosynthesis pathway.
The reference list from the paper itself. Each links out to its DOI / PubMed record.
- 1Di X, Ortega-Alarcon D, Kakumanu R, Iglesias-Fernandez J, Diaz L, B, et al. MEP pathway products allosterically promote monomerization of deoxy-D-xylulose-5-phosphate synthase to feedback-regulate their supply. Plant Commun. 2023;4(3):100512. 10.1016/j.xplc.2022.100512.10.1016/j.xplc.2022.100512 PMC 1020338136575800 · doi ↗ · pubmed ↗
- 2Li W, Chen L, Zhao W, Li Y, Chen Y, et al. Mutation of YFT 3, an isomerase in the isoprenoid biosynthetic pathway, impairs its catalytic activity and carotenoid accumulation in tomato fruit. Hortic Res. 2024;11(9):uhae 202. 10.1093/hr/uhae 202.10.1093/hr/uhae 202PMC 1141524039308791 · doi ↗ · pubmed ↗
- 3Zhang X, Li N, Liu X, Wang J, Zhang Y, et al. Tomato protein Rx 4 mediates the hypersensitive response to Xanthomonas euvesicatoria pv. perforans race T 3. Plant J. 2021;105(6):1630–44. 10.1111/tpj.15138.10.1111/tpj.1513833345374 · doi ↗ · pubmed ↗
- 4Zhu B, Wang M, Pang Y, Hu X, Sun C, et al. The Smi-mi R 858a-Sm MYB module regulates tanshinone and phenolic acid biosynthe-sis in Salvia miltiorrhiza. Hortic Res. 2024;11(4):uhae 047. 10.1093/hr/uhae 047.10.1093/hr/uhae 047PMC 1106942938706582 · doi ↗ · pubmed ↗