Tackling control risk problems in non-inferiority trials
Ian R White, Matteo Quartagno, Abdel G Babiker, Rebecca M Turner, Mahesh KB Parmar, A Sarah Walker

TL;DR
This paper discusses challenges in non-inferiority trials and offers solutions to ensure reliable results when comparing new treatments to standard care.
Contribution
The paper introduces two strategies to address control risk issues in non-inferiority trials using appropriate effect measures and adaptive analysis methods.
Findings
The choice of effect measure significantly impacts sample size and the interpretability of non-inferiority trials.
Adapting the non-inferiority margin based on observed control risk can improve trial reliability.
Abstract
Non-inferiority trials aim to show that major disease related outcomes with a new intervention are not importantly worse than with standard care. These trials are useful when the new intervention has some advantages over standard care (eg, toxicity, convenience, or cost). The ability to show non-inferiority, however, is sensitive to the control risk, the outcome frequency under standard care. Two control risk problems are described that can make non-inferiority trials underpowered or uninterpretable, and two ways of tackling these problems are outlined. Firstly, the choice of effect measure used to express the non-inferiority margin is critical: the effect measure must be based on understanding both the clinical setting and the implications for sample size. Which effect measures can lead to smaller or larger sample sizes is shown. Secondly, investigators need to consider, and…
Genes, proteins, chemicals, diseases, species, mutations and cell lines named across the full text — each resolved to its canonical identifier and authoritative record.
Click any figure to enlarge with its caption.
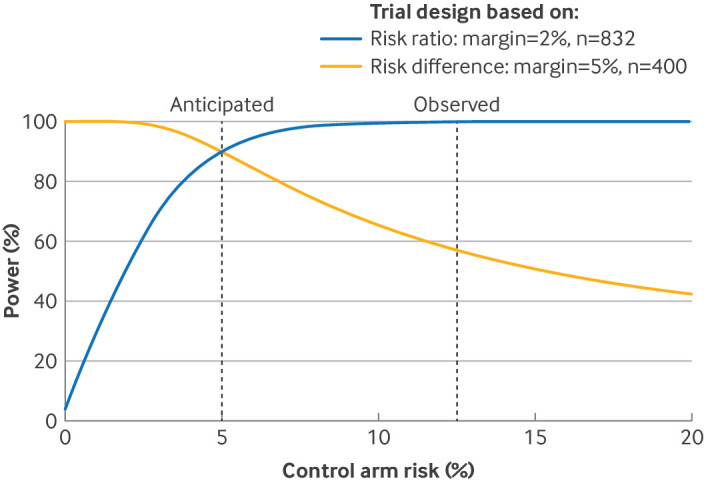 Figure 1
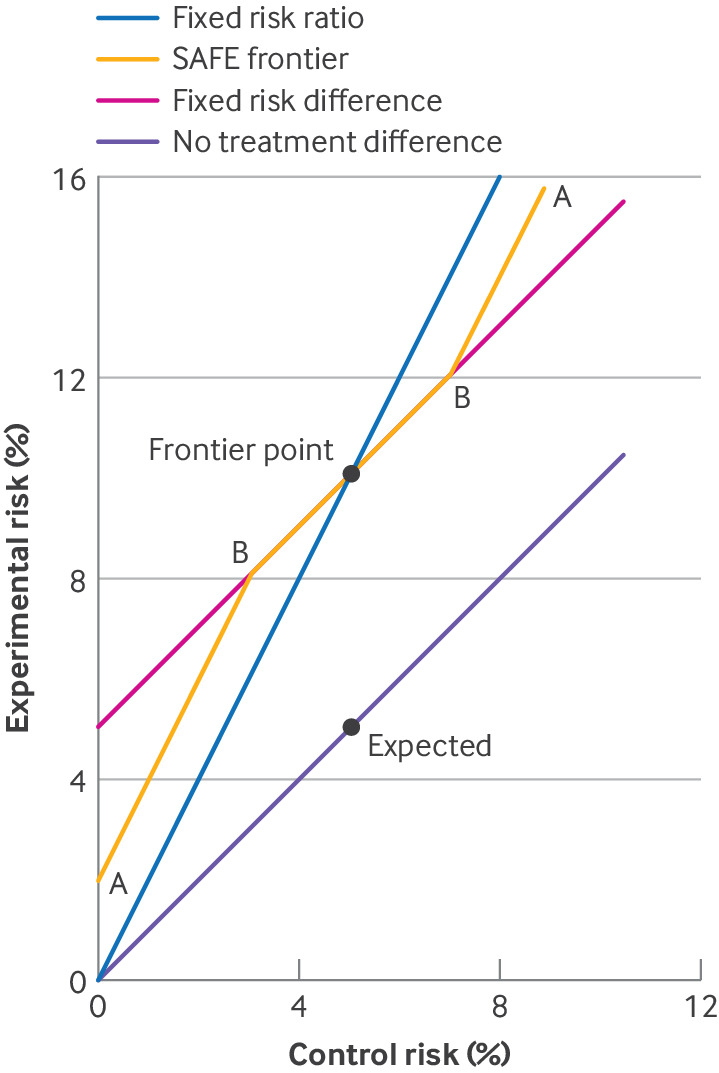 Figure 2
| Experimental intervention | Control intervention | |
|---|---|---|
| Expected treatment failures (%) | 5 | 5 |
| Borderline acceptable treatment failures (%) | 10 | 5 |
| No of participants randomised | 400 | 400 |
| No (%) hypothetical observed treatment failures | 24 (6) | 20 (5) |
| Effect measure | Non-inferiority margin | Observed effect (95% CI) | Test of non-inferiority (one sided | Evidence of non-inferiority |
|---|---|---|---|---|
| Risk difference | 10%–5%=5% | 1.0% (−2.2% to +4.2%) | P=0.007 | Convincing |
| Risk ratio | 10%/5%=2 | 1.20 (0.67 to 2.14) | P=0.041 | Not convincing |
| Control risk (%) | Unacceptable experimental risk (%) | Based on risk difference | Based on risk ratio | ||
|---|---|---|---|---|---|
| Non-inferiority margin (%) | Total sample size | Non-inferiority margin | Total sample size | ||
|
| |||||
| 5 | ≥10 | 5 | 800 | 2 | 1664 |
| 15 | ≥20 | 5 | 2144 | 1.33 | 2878 |
| 25 | ≥30 | 5 | 3154 | 1.2 | 3794 |
|
| |||||
| 10 | ≤5 | −5 | 1514 | 0.5 | 788 |
| 20 | ≤15 | −5 | 2690 | 0.75 | 2032 |
| 30 | ≤25 | −5 | 3532 | 0.83 | 2952 |
| Control arm risk (%) | ||||||||||
|---|---|---|---|---|---|---|---|---|---|---|
| 1 | 2 | 3 | 4 | 5 | 6 | 7 | 8 | 9 | 10 | |
| Non-inferiority margin (%) | 3 | 4 | 4.94 | 5 | 5 | 5 | 5.06 | 6 | 7 | 8 |
| Probability of adapting margin (%) | 100 | 94 | 58 | 19 | 7 | 18 | 45 | 74 | 91 | 98 |
| Power achieved (%) | 74 | 78 | 82 | 87 | 87 | 82 | 75 | 71 | 74 | 80 |
| Type 1 error achieved (%) | 1.9 | 3.1 | 2.3 | 2.3 | 2.2 | 2.6 | 4.4 | 4.6 | 4.6 | 4.7 |
| Trial stage | Action |
|---|---|
| Design | Choose an effect measure and non-inferiority margin that are clinically reasonable and statistically efficient. Specify these quantities clearly in the trial protocol |
| Based on the strength of evidence supporting the choice of control risk, consider, and ideally plan, whether and how the non-inferiority margin will be adapted if the observed control risk differs from that anticipated. Specify this approach clearly in the trial protocol, including if no adaptation is planned | |
| Interim analysis | The independent data monitoring committee should compare the observed control risk with that anticipated. If the difference is substantial, recommending the following actions should be considered |
| If non-inferiority margin is still appropriate and power will be lower than anticipated: Seek funding to increase the size of the trial Stop the trial for futility | |
| If non-inferiority margin is still appropriate and power will be higher than anticipated: Consider doing the final analysis earlier | |
| If non-inferiority margin is not appropriate: Change the non-inferiority margin taking into consideration decisions made about prespecifying adaptations | |
| Final analysis | Compare the observed control risk with the anticipated control risk. If the difference is substantial, consider the following actions |
| If non-inferiority margin is still appropriate and power will be lower than anticipated: Accept lost power | |
| If non-inferiority margin is still appropriate and power will be higher than anticipated: No action required | |
| If non-inferiority margin is not appropriate: Reconsider the non-inferiority margin, consulting with trial committees if no prespecification of adaptations |
- —http://dx.doi.org/10.13039/501100000265Medical Research Council
Peer Reviews
No public reviews on file for this paper yet. If you reviewed it on a platform where reviews are public (OpenReview, ICLR, NeurIPS, ICML), you can paste yours below so the community can read it here.
Videos
No videos yet. Explain this paper in a talk, walkthrough, or lecture? Add one.
Taxonomy
TopicsStatistical Methods in Clinical Trials · Health Systems, Economic Evaluations, Quality of Life · Statistical Methods and Inference
Introduction
Non-inferiority randomised controlled trials can have two objectives.1 The objective considered here is to evaluate whether a new intervention should replace part of an established standard of care because it has advantages from a risk-benefit perspective (eg, lower toxicity, greater patient acceptability, or lower cost). These trials aim to show that major disease related outcomes are not unreasonably compromised with the new intervention. A different objective of non-inferiority trials, important in a regulatory context but not considered here, is to show that a new intervention gives better disease outcomes than placebo, without directly comparing it with placebo.2 Non-inferiority trials contrast with superiority trials, which aim to show directly that the new intervention gives better disease outcomes. Non-inferiority trials are widely used3 and are especially important where standard care is clinically effective but burdensome on the patient (eg, in tuberculosis4) or where diversity in treatment options has public health advantages (eg, in antibiotic prescribing).2
Non-inferiority trials have several challenges not encountered in superiority trials.5 6 At their design stage, investigators must choose a non-inferiority margin, which is the smallest loss of clinical benefit that is considered unacceptable in view of the other potential advantages of the new intervention. The conduct of a non-inferiority trial must achieve and show good adherence to the control and intervention treatments because poor adherence can dilute the differences between the treatment received in the two arms and therefore tends to bias results towards non-inferiority. For the same reason, the analysis must consider how to deal with non-adherence.7
In this article, we show how to tackle two lesser known difficulties in non-inferiority trials, with a particular focus on binary (yes/no) outcomes. These difficulties arise from uncertainty about the outcome risk in the control group, which we call the control risk. We describe each problem before outlining its solution.
Problem 1: effect measure matters in non-inferiority trials
The Oral versus Intravenous Antibiotics for Bone and Joint Infection (OVIVA) trial was a multicentre randomised controlled trial of antibiotic treatment of bone and joint infections.8 The control treatment was intravenous antibiotics, and a 5% control risk was anticipated. The experimental intervention was oral antibiotics, which were believed to be almost as efficacious as intravenous antibiotics. Because of the advantages of the oral route, in particular earlier discharge from hospital, an increase in treatment failures to <10% was considered acceptable. The analysis focused on the risk difference, so the non-inferiority margin was fixed at five percentage points (10% minus 5%). Also, assuming the same true risk in both arms and no loss to follow-up, a non-inferiority trial with 90% power and one sided alpha of 2.5% requires a sample size of 400 participants for each arm (table 1).
If recruitment to the trial is successful and 24 failures with the experimental intervention and 20 failures with the control intervention are found (these are hypothetical numbers, not the OVIVA results), the estimated risk difference is +1% (95% confidence interval (CI) −2.2% to +4.2%), clearly well below the non-inferiority margin of +5%, and giving a P value of 0.007 for convincing evidence of non-inferiority (table 2). The risk difference, however, is not the only treatment effect measure.9 Another view is that the non-inferiority margin is a doubling of risk from 5% to 10%, representing a risk ratio of 2. The estimated risk ratio is 1.20 (95% CI 0.67 to 2.14). This CI includes the non-inferiority margin of 2 and gives a P value of 0.041 for inconclusive evidence of non-inferiority compared with a one sided alpha of 0.025. How can such different conclusions arise from identical data?
The discrepancy arises because a risk difference of 5% and a risk ratio of 2 are only simultaneously true if the control risk is exactly 5%. For example, the data in table 1 are consistent with the control risk being only 3% and the experimental risk being 7%: these values fall within the non-inferiority margin of a risk difference of 5%, but outside the non-inferiority margin of a risk ratio of 2.
Solution 1: prespecify the effect measure
Problem 1 should be avoided by prespecifying the effect measure in the trial protocol, which is sometimes done implicitly (eg, “The non-inferiority margin is a five percentage points increase from 5% to 10%” or “The non-inferiority margin is a doubling from 5% to 10%”). We recommend stating the intended effect measure explicitly. Stating the effect measure is part of defining the estimand, together with stating the population, treatments being compared, outcome measure (including time point), and handling of intercurrent events.10
How should the effect measure be chosen? Clinical considerations are important, and can be understood by varying the control risk slightly. For example, investigators could ask themselves the question: if the control risk is 3%, would the unacceptable experimental arm risk be 8% (a risk difference of 5%) or 6% (a risk ratio of 2)?
Sample size considerations are also important. The extra stringency of the risk ratio has important consequences for the size of the trial. Redesigning the trial in table 1 with 90% power to exclude a relative increase of 2 in the risk would require a sample size of 832 (rather than 400) for each arm with the same assumptions (table 3). Sample size based on the risk ratio is in general larger than the sample size based on the risk difference for unfavourable outcomes. For favourable outcomes, sample size is instead smaller when based on the risk ratio (better termed the success ratio) than on the risk difference.11 If clinical considerations do not dictate the choice of effect measure, then a choice resulting in smaller sample size is reasonable. The online supplemental appendix gives the code for doing these sample size calculations.
Problem 2: observed control risk might not be anticipated
Despite investigators’ best efforts to anticipate the control risk correctly, sometimes its observed value differs importantly from what was anticipated. At the interim analysis, this finding might be noted by an independent data monitoring committee with access to unblinded data or by the investigators with the pooled data and assuming no treatment effect. At the final analysis, the differing control risk will become clear.
This difficulty is particularly likely if a trial is being designed in a discipline that has few previous trials, or the inclusion criteria differ materially from previous trials. For OVIVA, no other trials could inform the control risk, but a pilot in the main centre, which had substantial management and treatment experience, suggested that a 5% control risk was reasonable. The interim analysis, however, including many centres with less experience, found a larger overall risk (and hence by assumption control risk) of 12.5%. Now a non-inferiority margin of 5% as a risk difference means that the experimental risk must be <17.5%, which clinicians might consider too stringent given the other potential benefits of the intervention. On the other hand, a non-inferiority margin of 2 as a risk ratio means that the experimental risk must be <25%, which clinicians might consider too lax because it corresponds to one in four patients failing, rather than one in eight. Also, the power of the trial to show non-inferiority with the risk difference is reduced from the anticipated 90% to <60% (figure 1). On the other hand, the power of a larger trial designed with the risk ratio would be increased from the anticipated 90% to almost 100%.
Power calculation for two non-inferiority trials with unfavourable outcome as the control risk varies: trial designed with the risk difference with a non-inferiority margin of 5% and trial designed with the risk ratio with a non-inferiority margin of 2. n=sample size for each arm
Hence the control risk being higher than anticipated means low power to detect a possibly too small non-inferiority margin if the risk difference is used, or high power to detect a possibly too large non-inferiority margin if the risk ratio is used. The opposite problems occur if the control risk is lower than anticipated. We now show how to adapt the non-inferiority margin to avoid these problems, which are only identified after a trial has started, while retaining the statistical integrity of the trial.
Solution 2: respond to unanticipated control risk
What can investigators do if an interim or final analysis shows that the control risk observed so far in the trial differs substantially from the anticipated risk when the trial was designed? If the original non-inferiority margin remains clinically relevant given the observed control risk, but power is now substantially lower than designed, then the investigators have few options: at an interim analysis, the investigators might consider stopping the trial for futility or seek funding to increase the size of the trial, or otherwise, at the final analysis, simply accept the loss of power.
In some cases, however, the fact that the control risk is different to that anticipated allows reconsideration of the original non-inferiority margin. In the OVIVA trial,8 with the interim analysis showing a control risk of about 12.5% rather than the anticipated 5%, the investigators chose to adapt the risk difference non-inferiority margin from 5% to 7.5%, based on clinical trade-offs for acceptable failure rates given the other advantages of oral treatment.9 The data monitoring committee, the trial steering committee, and the research ethics committee explicitly agreed to this change.12
Adapting the non-inferiority margin taking into consideration the estimated treatment effect is inappropriate; adapting the non-inferiority margin considering the control risk or overall risk alone is appropriate, but could lead to an inflated type 1 error.9 We recommend that investigators prespecify a procedure for adapting the non-inferiority margin, stating when the decision would be taken, by whom, and on what evidence; what size of discrepancy would trigger a change in the non-inferiority margin; how the non-inferiority margin would be changed; and how the type 1 error rate would be controlled.11 Before suggesting a procedure, we introduce a useful visual aid.
Visual aid: non-inferiority frontier graph
In figure 2, we show the experimental risk and control risk in a two way graph.11 Each point on the graph represents a potential truth. The line of points representing no difference between the experimental and control treatments (no treatment difference) includes the expected point where both risks are 5%. When the control risk is 5%, non-inferiority is defined by an experimental risk of <10%: we call 10% the frontier point. Another line of points represents a risk difference equal to the non-inferiority margin of 5% (fixed risk difference). A steeper line of points represents a risk ratio equal to the non-inferiority margin of 2 (fixed risk ratio). Points below either line indicate non-inferiority with that effect measure. Both lines pass through the frontier point but they differ elsewhere.
Three possible non-inferiority frontiers: fixed risk difference frontier, fixed risk ratio frontier, and smooth away from expected (SAFE) frontier (marked A). The SAFE frontier follows the fixed risk difference frontier around the expected control risk, because clinical interpretation of the non-inferiority margin is unchanged in this region, and then bends away smoothly at points B to pass the frontier points A
The non-inferiority frontier graph explains problem 1: for control risk values of <5%, the expected point is nearer to the fixed risk ratio frontier than to the fixed risk difference frontier, making it harder to reject the former. The graph also suggests a solution to problem 2: we can use an intermediate frontier between the fixed risk ratio and fixed risk difference frontiers.
Proposal: smooth away from expected (SAFE) frontier
The trial team should determine at the design stage of the study, on clinical grounds, what non-inferiority means at different control risks. This decision should be broadly discussed by clinicians, patients, and statisticians. Based on the other potential advantages of the new intervention, the investigators might decide that if the control risk is 1% then non-inferiority requires the experimental risk to be <4%, and if the control risk is 9% then non-inferiority requires the experimental risk to be <16%. The trial team can add these as two more frontier points (marked A in figure 2). Figure 2 shows an example of the new SAFE frontier.13 The SAFE frontier follows the fixed risk difference frontier around the expected control risk, because clinical interpretation of the non-inferiority margin is unchanged in this region, and then bends away smoothly at points B in figure 2 (here drawn where control risk is the expected value ±~2%) to pass the frontier points A. Choice of points A and B should reflect clinical understanding, but placing points B close to the frontier point inflates sample size.
Table 4 summarises the SAFE frontier and analysis.13 Here, to control type 1 errors, we choose a smaller nominal significance level (0.75%) if the non-inferiority margin is adapted, and otherwise a standard 2.5% nominal significance level. Adapting the non-inferiority margin is increasingly likely as the control arm risk moves away from the expected 5%. Power is slightly reduced (from 90% to 87%) if the control risk is 5%, but does not fall to <70% for any control risk. Type 1 error is controlled at <5%, but not at <2.5%. Table 5 summarises steps that can be taken to tackle the control risk problems, and box 1 suggests wording for a trial protocol with a SAFE frontier.
Box 1Suggested wording for a trial protocol alongside a graph of the smooth away from expected (SAFE) frontierAnalysis will use the risk difference. The anticipated control risk is 5% and the non-inferiority margin is five percentage points. If the observed control risk differs from that anticipated in the sample size calculation by more than ~2 percentage points, then we will adapt the non-inferiority margin according to the SAFE frontier shown in the graph. In this case, we will control the type 1 error rate by using a smaller nominal significance level, and report results with the adapted non-inferiority margin.13
Discussion
Prespecifying the effect measure in a non-inferiority trial is important. We have focused on the risk difference and risk ratio. Another effect measure for binary data is the odds ratio. The odds ratio gives similar results to the risk ratio for all examples in this paper, because the odds ratio and risk ratio perform similarly for low frequency outcomes.14 In general, a non-inferiority margin expressed as an odds ratio is difficult to interpret,15 and the risk difference or risk ratio should be preferred in non-inferiority trials. Another possibility is the averted infections ratio.16 Recasting the trial as superiority with a composite outcome is attractive but problematic.17
We assumed an analysis which simply compares risks. Power might be gained by adjusting for baseline covariates. Covariate adjustment is usually done in a logistic regression analysis that outputs conditional odds ratios: the results should be converted to the chosen effect measure (eg, risk difference or risk ratio) with standardisation.18
We assumed a binary outcome. Time-to-event outcomes raise similar problems: these outcomes are often analysed with the hazard ratio, which behaves like the risk ratio. Expressing the non-inferiority margin based on the difference in restricted mean survival time has been shown to reduce sample size requirements, sometimes substantially.19 Quantitative outcomes also require a decision on whether non-inferiority is to be defined by a difference or ratio of means.
Adapting the non-inferiority margin during the trial could be problematic. A particular concern is that investigators will choose a non-inferiority margin that gives the desired results, which is clearly unacceptable. To make an adapted non-inferiority margin acceptable to stakeholders, the adaptation procedure needs to be free from bias, transparent, and prespecified. Adaptation might complicate the reporting of a non-inferiority trial.
We described a non-inferiority margin adaptation procedure based on the SAFE frontier and overall blinded data. Non-inferiority margin adaptation alone can lead to type 1 error inflation, but special analysis methods can control the type 1 error rate.13 Sample size re-estimation or doing the final analysis earlier could have unexplored implications for type 1 errors.
Our arguments are specific to non-inferiority trials demonstrating advantages from a risk-benefit perspective. In regulatory trials, where the aim is an indirect comparison with placebo, the effect measure is typically the same as in trials of control versus placebo, and large differences in control risk are likely to question the credibility of the trial.
Conclusions
Non-inferiority trials have greater risks to validity than superiority trials, but the design of the trial can reduce these risks. Careful choice of effect measure can avoid unnecessarily large sample size requirements. Advance consideration of what will be done if the control risk differs from its anticipated value can avoid trials being underpowered or uninterpretable. The SAFE frontier is one way to avoid these problems.
Supplementary material
10.1136/bmjmed-2023-000845online supplemental file 1
The reference list from the paper itself. Each links out to its DOI / PubMed record.
- 1Tweed CD Quartagno M Clements MN et al Exploring different objectives in non-inferiority trials BMJ 2024385 e 07800010.1136/bmj-2023-07800038886014 PMC 11181107 · doi ↗ · pubmed ↗
- 2Department of Health and Human Services: Food and Drug Administration Non-inferiority clinical trials to establish effectiveness: guidance for industry 2016 Availablehttps://www.fda.gov/regulatory-information/search-fda-guidance-documents/non-inferiority-clinical-trials
- 3Rehal S Morris TP Fielding K et al Non-inferiority trials: are they inferior? A systematic review of reporting in major medical journals BMJ Open 20166 e 01259410.1136/bmjopen-2016-012594 PMC 507357127855102 · doi ↗ · pubmed ↗
- 4Nunn AJ Meredith SK Spigelman MK et al The ethics of non-inferiority trials Lancet 200837189510.1016/S 0140-6736(08)60404-318342678 · doi ↗ · pubmed ↗
- 5Mauri L D’Agostino RB Sr Challenges in the Design and Interpretation of Noninferiority Trials N Engl J Med 201737713576710.1056/NEJ Mra 151006328976859 · doi ↗ · pubmed ↗
- 6Macaya F Ryan N Salinas P et al Challenges in the Design and Interpretation of Noninferiority Trials: Insights From Recent Stent Trials J Am Coll Cardiol 20177089490310.1016/j.jacc.2017.06.03928797360 · doi ↗ · pubmed ↗
- 7Hernán MA Robins JM Per-Protocol Analyses of Pragmatic Trials N Engl J Med 20173771391810.1056/NEJ Msm 160538528976864 · doi ↗ · pubmed ↗
- 8Li HK Scarborough M Zambellas R et al Oral versus intravenous antibiotic treatment for bone and joint infections (OVIVA): study protocol for a randomised controlled trial Trials 20151658310.1186/s 13063-015-1098-y 26690812 PMC 4687165 · doi ↗ · pubmed ↗