Correction: Akintade, D.D.; Chaudhuri, B. Apoptosis, Induced by Human α-Synuclein in Yeast, Can Occur Independent of Functional Mitochondria. Cells 2020, 9, 2203
Damilare D. Akintade, Bhabatosh Chaudhuri

Abstract
Genes, proteins, chemicals, diseases, species, mutations and cell lines named across the full text — each resolved to its canonical identifier and authoritative record.
Click any figure to enlarge with its caption.
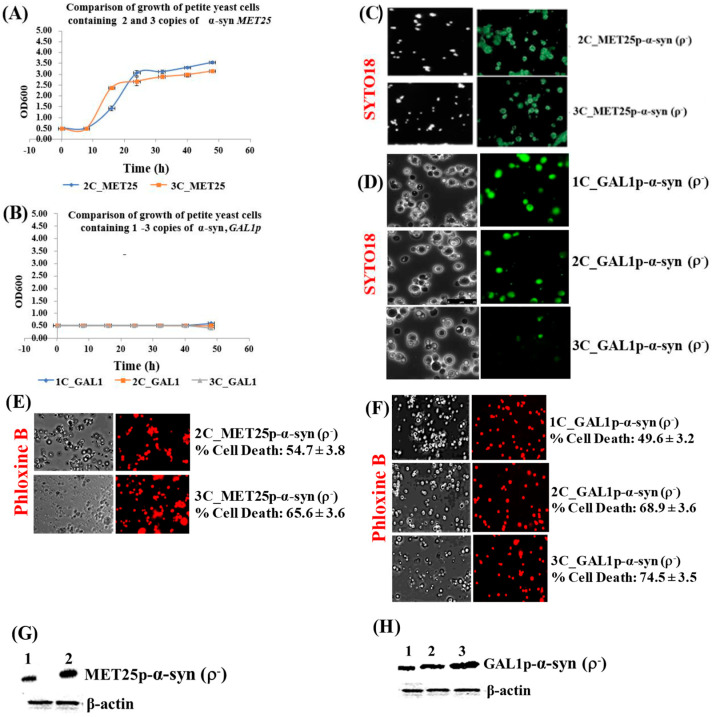 Figure 2
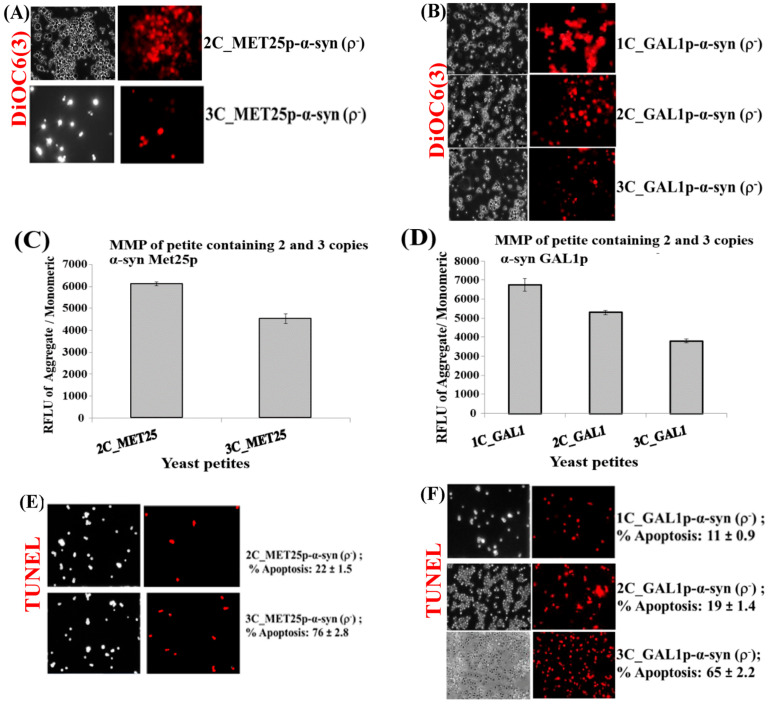 Figure 3
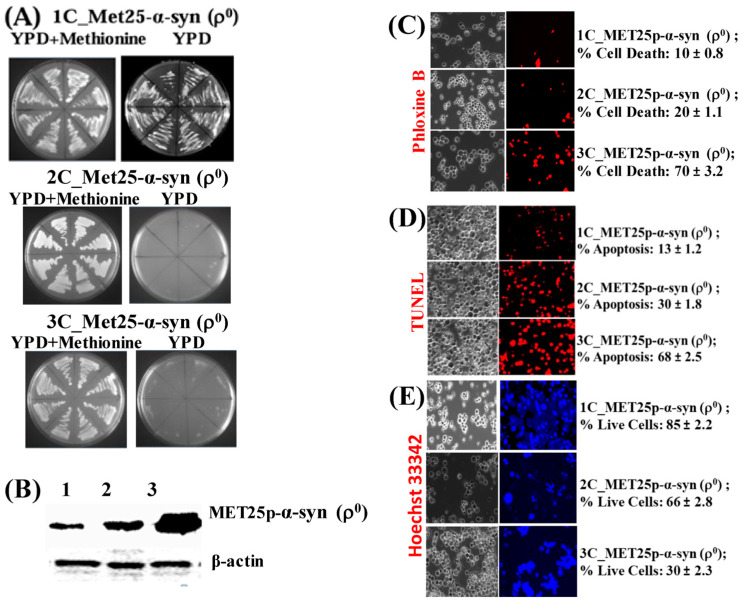 Figure 5
Peer Reviews
No public reviews on file for this paper yet. If you reviewed it on a platform where reviews are public (OpenReview, ICLR, NeurIPS, ICML), you can paste yours below so the community can read it here.
Videos
No videos yet. Explain this paper in a talk, walkthrough, or lecture? Add one.
Taxonomy
TopicsNeurological Disease Mechanisms and Treatments · Ginkgo biloba and Cashew Applications · Parkinson's Disease Mechanisms and Treatments
In the original publication [1], due to figure overlap the Figures 2, 3 and 5 were revised.
Error in Figure 2
There was a mistake in Figure 2C in the white light image.
(A,B) Comparison of the growth curves of ρ− cells expressing 2–3 copies of α-syn from MET25p (A) and 1–3 copies of α-syn from GAL1p (B); cells were grown in YPD (A) and YP-galactose (B). Bonferroni post hoc test after a significant two-way ANOVA indicates no significant difference in growth between yeast petites that contain different copies of the α-syn gene. (C,D) Microscopic images (×400) of petite cells, where expression of 2–3 copies (MET25p) or 1–3 copies (GAL1p) of α-syn gene was induced, stained with the dye SYTO18. (E,F) Microscopic images (×400) of petite cells expressing 2–3 copies of α-syn from the MET25p (E) and 1–3 copies of α-syn from the GAL1p, staining with Phloxine B. (G,H) Western blot analyses of cells expressing 1 to 3-copies of α-syn protein after full induction of the MET25p (G) or GAL1p (H). On lanes, 1, 2 (G) and 1, 2 and 3 (H) were loaded 7.5 µg of total protein obtained after lysis of cells that express 2-copies or 1-copy (lanes 1; G,H), 3-copies or 2-copies (lanes 2; G,H) and 3-copies (lane 3; H) of α-syn, after the growth of cells under conditions that fully induce the MET25 or GAL1 promoter. The upper panel was probed with an antibody that recognizes human α-syn (Proteintech, #10842-1-AP) and the lower panel with a β-actin antibody (Proteintech, 60008-1-Ig); Densitometric quantification of the α-syn bands in (G,H) is shown in Supplementary Materials, Parts 3 and 4. Post Hoc Newman-Keuls test, after a significant one-way ANOVA test, indicated a significant difference in cell death, p < 0.01, between petites expressing α-syn with different copy numbers.
Error in Figure 3
In Figure 3A (3C_Met25p), there is a mistake in the white light image. In Figure 3E, there are mistakes in the white and fluorescent light images. In Figure 3F (1C_GAL1p), there is a mistake in the white light image.
(A,B) Microscopic images (×400) of staining of 3 copies of α-syn petite transformants with DiOC6(3) dye that detects MMP in live cells. The images are representative images (×400) of cells. (C,D) Quantification of relative MMP of yeast cells expressing 2 and 3-copies of α-syn from MET25p and 1–3-copies of α-syn from GAL1p, using the JC-10 dye (p < 0.1). (E) Microscopic images (×400) of nuclear DNA fragmentation as observed using the TUNEL assay in yeast cells expressing 2 and 3 copies of α-syn from MET25p. (F) Microscopic images (×400) of nuclear DNA fragmentation as observed using the TUNEL assay in yeast cells expressing 1 copy of α-syn from GAL1p. The images are representative images of cells. The data in figures (C,D) represent mean ± S.D. of three independent experiments (p < 0.1; two-tailed t-test). The left-hand side pictures in (A,B,E,F) show phase-contrast microscopy pictures (×400) of yeast cells. Post Hoc Newman-Keuls test, after a significant one-way ANOVA test, indicated a significant difference p < 0.001 between strains expressing 2 and 3-copies of α-syn from MET25p, and between 1 and 2-copies and 3-copies of α-syn from GAL1p.
Error in Figure 5
In Figure 5A (1C_Met25), there is a mistake in the YPD plate image.
(A) Image of growth of Ῥ0 yeast cells harboring 1 copy (1C) of the α-syn gene under MET25p control on complete YPD medium agar plates in the presence (YPD + Methionine) or absence of methionine. (B) Western blot analyses of ρ0 cells expressing 1-copy (lane 1), 2-copies (lane 2), and 3-copies (lane 3) of α-syn protein. On lanes 1, 2, and 3 were loaded 7.5 µg of total protein obtained after lysis of cells. The upper panel was probed with an antibody that recognizes the HA epitope (Proteintech, 51064-2-AP) and the lower panel with a β-actin antibody (Proteintech, 60008-1-Ig); levels of β-actin were used as loading controls, β-actin being a housekeeping gene. (C) Microscopic images (×400) of ρ0 cells, stained with Phloxine B, after the expression of 1–3 copies of α-syn from the MET25p. (D) Microscopic images (×400) of nuclear DNA fragmentation, as observed using the TUNEL assay, in ρ0 yeast cells expressing 1–3-copies of α-syn from MET25p. (E) ρ0 cells, bearing 1–3 copies of MET25p-driven α-syn expression cassettes, were stained with Hoechst 33,342 (a blue dye that labels DNA of live cells). Post Hoc Newman-Keuls test after a significant one-way ANOVA test, indicated a significant difference between petites expressing 1–3 copies of α-syn.
The authors state that the scientific conclusions are unaffected. This correction was approved by the Academic Editor. The original publication has also been updated.
The reference list from the paper itself. Each links out to its DOI / PubMed record.