Protocol update to: High-throughput scNMT protocol for multiomics profiling of single cells from mouse brain and pancreatic organoids
Santiago Cerrizuela, Oguzhan Kaya, Lukas P.M. Kremer, Andrea Sarvari, Tobias Ellinger, Jannes Straub, Jan Brunken, Andrés Sanz-Morejón, Aylin Korkmaz, Ana Martín-Villalba

TL;DR
This paper updates a protocol for high-throughput single-cell multiomics profiling, improving efficiency and data quality in mouse brain and pancreatic organoid studies.
Contribution
The protocol is updated to a 384-well format with reduced costs and improved cDNA quality using Smart-seq3 and patterned-flow cells.
Findings
Throughput increased to 384-well format with reduced costs.
Improved detection of genes and CpGs per cell using Smart-seq3.
Protocol validated in two research papers with enhanced troubleshooting.
Abstract
Single-cell nucleosome, methylome, and transcriptome (scNMT) sequencing is a recently developed method that allows multiomics profiling of single cells. In this scNMT protocol, we describe profiling of cells from mouse brain and pancreatic organoids, using liquid handling platforms to increase throughput from 96-well to 384-well plate format. Our approach miniaturizes reaction volumes and incorporates the latest Smart-seq3 protocol to obtain higher numbers of detected genes and genomic DNA (gDNA) CpGs per cell. We outline normalization steps to optimally distribute per-cell sequencing depth. For complete details on the use and execution of this protocol, please refer to Kremer et al. and other works.1,2,3,4,5,6,7 This protocol is an update to Cerrizuela et al.7 •Throughput increase to 384-well plate format for methylome with a decrease in costs•Validation of the protocol in two…
Genes, proteins, chemicals, diseases, species, mutations and cell lines named across the full text — each resolved to its canonical identifier and authoritative record.
Click any figure to enlarge with its caption.
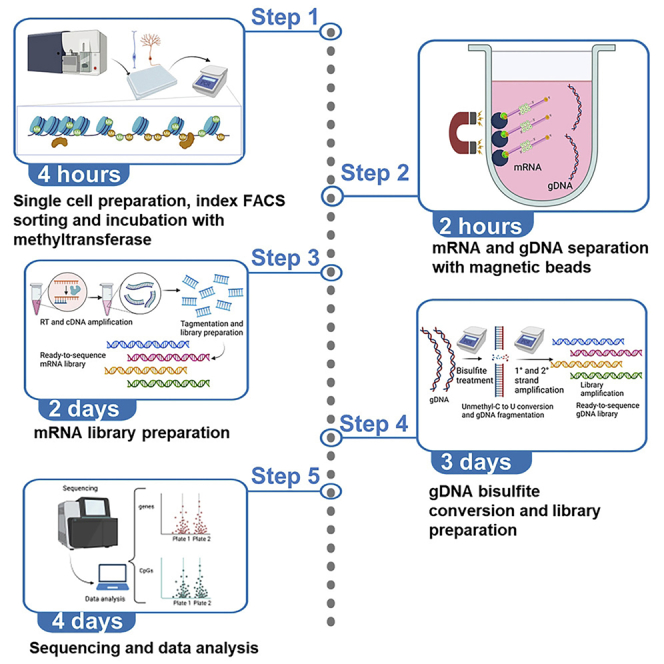 Figure 1
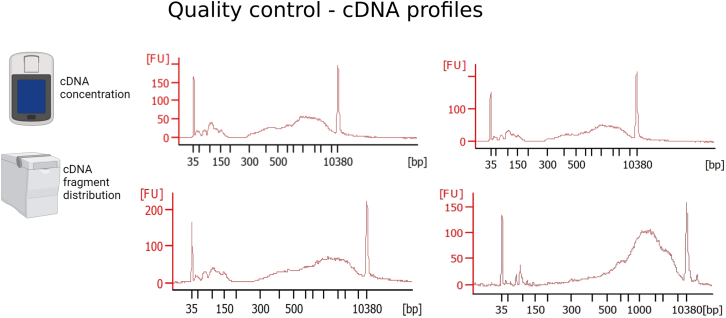 Figure 2
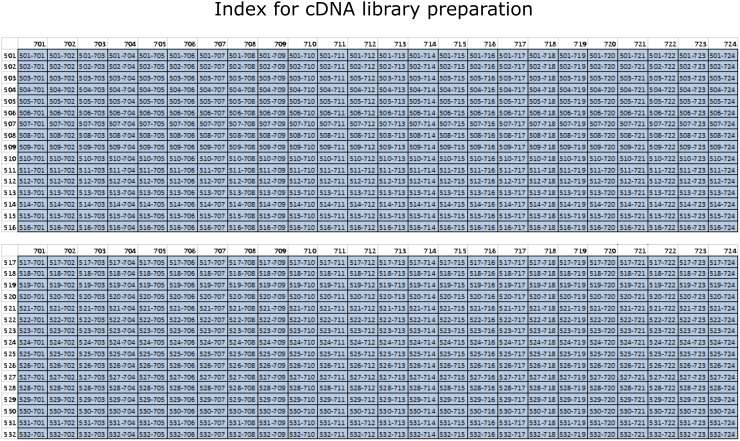 Figure 3
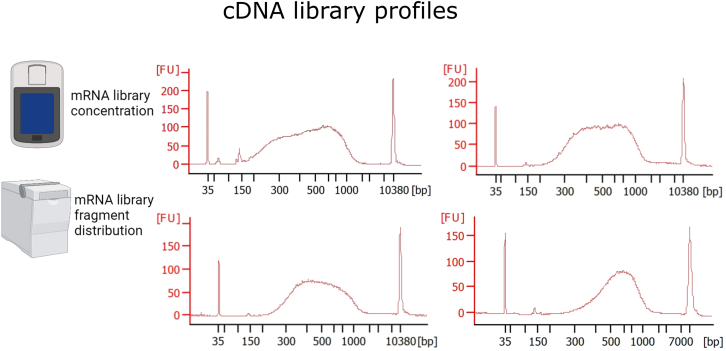 Figure 4
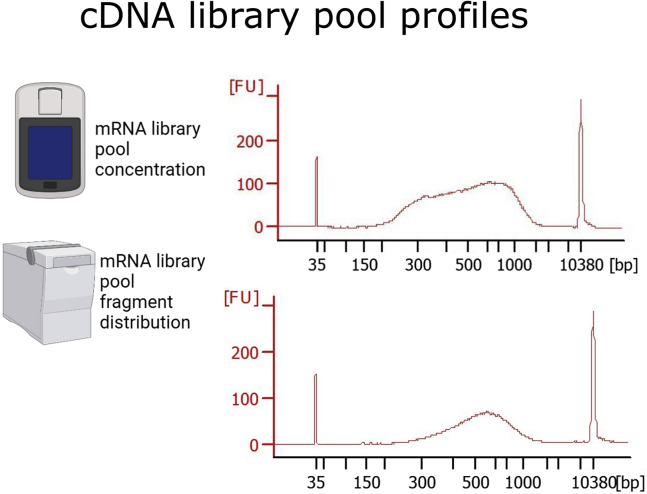 Figure 5
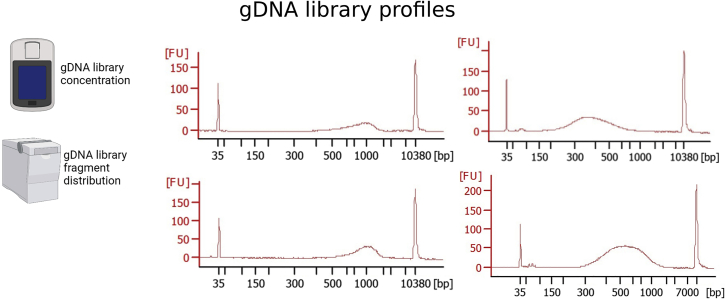 Figure 6
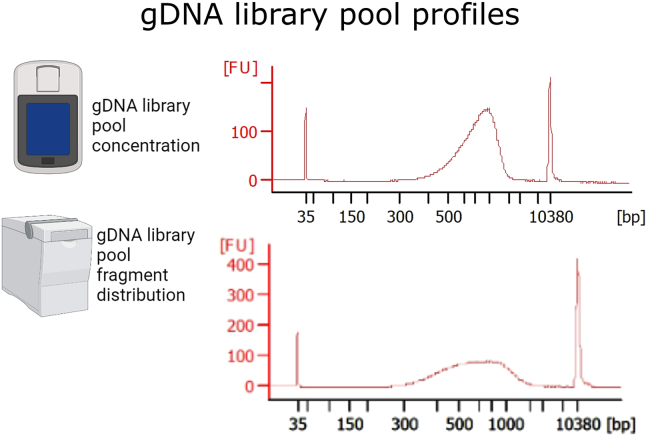 Figure 7
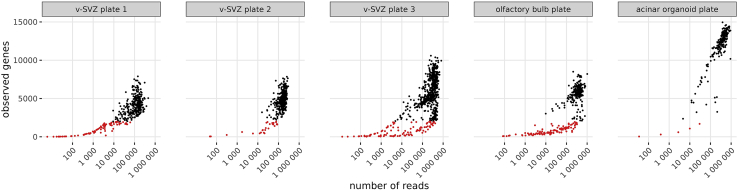 Figure 8
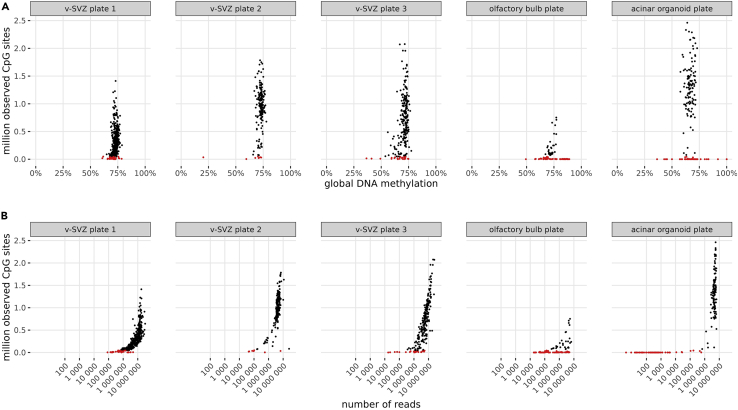 Figure 9
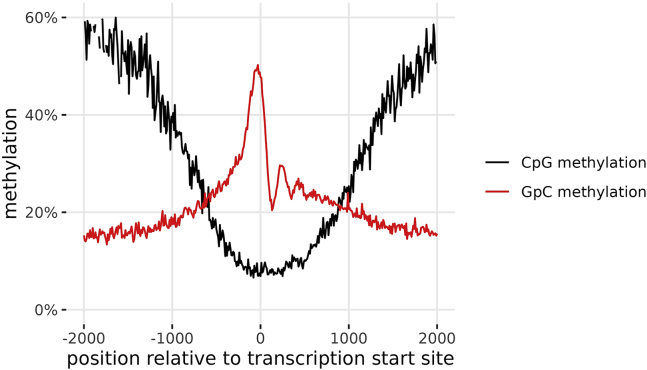 Figure 10
Peer Reviews
No public reviews on file for this paper yet. If you reviewed it on a platform where reviews are public (OpenReview, ICLR, NeurIPS, ICML), you can paste yours below so the community can read it here.
Videos
No videos yet. Explain this paper in a talk, walkthrough, or lecture? Add one.
Taxonomy
TopicsSingle-cell and spatial transcriptomics · Epigenetics and DNA Methylation · Genetic Syndromes and Imprinting
Before you begin
The profiling of mRNA species, chromatin accessibility and epigenetic information in single cells is key to understanding the molecular mechanisms governing how fate choices are executed within a cell. In this regard, single cell sequencing methods underwent an exciting development in the last years, with the incorporation of multiomics profiling, which has the advantage of capturing multiple molecular layers from the same cell.8 Recently, the scNMT protocol was used to capture the transcriptomic and epigenetic landscape of mouse gastrulation.4^,^9 However, the protocol is cost-intensive, uses Smart-seq2 as the RNA sequencing pipeline and works on a 96-well plate format.
Due to tissue heterogeneity and the stochasticity of states present even within the very same cell type, it is important to profile a significant number of cells to have statistically relevant readouts and address the biology of a tissue.
This would allow a comprehensive understanding of the regulatory mechanisms underlying transcriptional commitment and cell fate decisions, together with the discovery of key molecular drivers and mechanisms underpinning cellular states in homeostasis and disease. Ultimately, precise tuning of epigenetic states may permit greater control of engineered cell type and activity for cell therapies.
Here, we improve the scNMT protocol by incorporating the Smart-seq35^,^6 pipeline for the transcriptomic profiling, which uses unique molecular identifiers (UMIs) to pre-label each unique molecule, addressing potential bias introduced during amplification and enabling the quantitative measurement of RNA molecules. Moreover, the implementation of Smart-seq3 allows capturing a much higher number of genes per cell, including transcription factors, which are very important to regulate chromatin and are generally lowly expressed. In addition, we miniaturize the reaction volume and increase the throughput to a 384-well plate format, with the possibility of profiling up to 768 cells per sequencing run (at the mRNA level and the gDNA level). To improve the number of cells that reach the lower threshold of genes/cell, we also incorporate normalization steps in order to optimally distribute sequencing depth among all the cells.
For an optimal protocol, we recommend the use of automatic pipetting machines, such as Viaflo 384 (Integra), Mosquito HV (SPT Labtech) and Mantis (FORMULATRIX). In the absence of these machines, a multichannel pipette can be utilized, which would increase the plate-processing time.
The protocol below describes the specific steps for profiling mouse primary neural stem cells (NSCs), astrocytes, neuroblasts, oligodendrocytes and neurons, as well as cells from pancreatic acinar organoids.
As mentioned before, we have increased now the throughput to be 384-well for the mRNA as well as for the gDNA part, which decreases further the sequencing costs. This protocol was used and validated on the following papers.1^,^2
Institutional permissions
All animal experiments were performed in accordance with the institutional guidelines of the DKFZ and were approved by the “Regierungspräsidium Karlsruhe” (Germany).
Key resources table
REAGENT or RESOURCESOURCEIDENTIFIERChemicals, peptides, and recombinant proteinsBuffer RLT PlusQIAGENCat#1053393Dynabeads MyOne streptavidin C1InvitrogenCat#6500110 mM dNTP mixThermo ScientificCat#R01921 M DTTSigma-AldrichCat#43816-10 mLKAPA HiFi HotStart ReadyMix (2×)Roche DiagnosticsCat#KK2602/07958935001KAPA HiFI HotStart PCR mixRoche DiagnosticsCat#KK2502/07958897001CT conversion reagentZymo ResearchCat#D5003-1M-solubilization bufferZymo ResearchCat#D5021-7M-dilution bufferZymo ResearchCat#D5002-2M-reaction bufferZymo ResearchCat#D5021-8MagBinding beadsZymo ResearchCat#D4100-2-8M-binding bufferZymo ResearchCat#D5002-3M-desulfonation bufferZymo ResearchCat#D5001-5Klenow (3′–5′ exo-)BiozymCat#280310Exonuclease INEBCat#M0293LRecombinant RNase inhibitorTakara BioCat#2313AAgencourt AMPure XP beadsBeckman CoulterCat#A63881Maxima H MinusThermo ScientificCat#EP0752Nextera XT DNA sample preparation kitIlluminaCat#FC-131-1096IGEPAL CA-630Sigma-AldrichCat#I8896-50mL1 M Tris-HCl buffer pH 8.0Thermo Fisher ScientificCat#155680250.5 M EDTA solutionThermo Fisher ScientificCat#15575020Tween 20Sigma-AldrichCat#P1379-1LSYTOX Blue dead cell stainThermo ScientificCat#S34857TrypLE Express enzyme (1×), no phenol redThermo ScientificCat#12604013PEG 8000Sigma-AldrichCat#P2139Critical commercial assaysBioanalyzer DNA high sensitivity chipAgilentCat#5067-4626Qubit assay tubesThermo Fisher ScientificCat#Q32856Qubit dsDNA HS assay kitThermo Fisher ScientificCat#Q32854Quant-iT PicoGreen dsDNA assay kitsThermo Fisher ScientificCat#P7589Neural tissue dissociation kit (NTDK)Miltenyi BiotecCat#130-093-231Experimental models: Cell linesPrimary cells from mouse brainJANVIER LABSC57BL/6NRjMouse pancreatic organoidsJANVIER LABSC57BL/6NRjOligonucleotidesBiotinylated Oligo-dT_SS3 /5BiotinTEG/This paperAC GAG CAT CAG CAG CAT ACG ATT TTT TTT TTT TTT TTT TTT TTT TTT TTT TVNTemplate-switching oligo (TSO) /5Me-isodC//iisodG//iMe-isodC/This paperAGA GAC AGA TTG CGC AAT GNN NNN NNN NNN NrGrG+GmRNA index primers – combinatorial indexing – 5er and 7erNextera index primers. For the original design see, Buenrostro et al.10 in the references of the manuscript.On Table S1Fwd_PCR_primerHagemann-Jensen et al.,5^,^6 see references on manuscriptTCGTCGGCAGCGTCAGATGTGTATAAGAGACAGATTGCGCAA∗T∗GRev_PCR_primerHagemann-Jensen et al.,5^,^6 see references on manuscriptACGAGCATCAGCAGCATAC∗G∗APreamp oligoClark et al.,4 see references on manuscriptCTACACGACGCTCTTCCGATCTNNNNNNAdapter 2 oligoClark et al.,4 see references on manuscriptTGCTGAACCGCTCTTCCGATCTNNNNNNgDNA index primers – Unique dual indexingThis paperOn Table S2iTAG sequencing primerClark et al.,4 see references on manuscriptAAGAGCGGTTCAGCAGGAATGCCGAGACCGATCTCSoftware and algorithmszUMIsParekh et al.,11 see references on manuscript.https://github.com/sdparekh/zUMIsFASTQCAndrews et al.,12 see references on manuscript.https://www.bioinformatics.babraham.ac.uk/projects/fastqc/STAR mapper 2.7.3aDobin et al.,13 see references on manuscript.https://github.com/alexdobin/STARTrim GaloreKrueger,14 see references on manuscript.https://www.bioinformatics.babraham.ac.uk/projects/trim_galore/BismarkKrueger & Andrews,15 see references on manuscript.https://www.bioinformatics.babraham.ac.uk/projects/bismark/BioRenderScience Suite Inc.https://biorender.com/InkscapeThe Inkscape Projecthttps://inkscape.org/Othertwin.tec PCR plate 384 LoBindEppendorfCat#00301129547Hard-Shell 384-well PCR plates, thin wall, skirted, clear/clearBio-RadCat#HSP38015 XYZ racks of 384 tipsINTEGRACat#6465384-well plate magnetic blockSPT LabtechCat#3268-02008neoVortex shaker, with fixed rotation 2500 rpmneoLabCat#D-6013Spool of 18500 gamma ray sterilized pipettes 4.5 mm Pitch HVSPT LabtechCat#4150-03033VIAFLO 384 base unitINTEGRACat#6031384-channel pipetting head 2–50 μLINTEGRACat#613616 channel VIAFLO lightweight electronic pipetteINTEGRACat#4646Mantis V3.3 with integrated RFIDFORMULATRIXCat#MANTV3.3_RFIDMANTIS chip – silicone, LV (0.1 μl & 0.5 μl), RFIDFORMULATRIXCat#233649MANTIS chip – silicone, HV (1 μl & 5 μl), RFIDFORMULATRIXCat#233648MANTIS chip – silicone, continuous Flow (CF), RFIDFORMULATRIXCat#232724Mosquito HV liquid handling systemSPT LabtechCat#3097-01057NextSeq 2000 sequencing systemIlluminaCat#20038897NextSeq 550 sequencing systemIlluminaCat#SY-415-1002NextSeq 1000/2000 P2 reagents (200 cycles) v.3IlluminaCat#20046812NextSeq 500/550 mid output Kit v.2.5 (150 CYS)IlluminaCat#20024904NextSeq 500/550 High Output Kit v.2.5 (150 CYS)IlluminaCat#20024907^∗^Phosphorothioate.
Materials and equipment
As described before, we recommend liquid handler platforms to obtain reproducible results. Viaflo 384 (INTEGRA) can be used for the nucleic acid purification steps and gDNA and mRNA separation. Mantis (FORMULATRIX) is used for adding low amounts of cost-intensive reagents with little dead volume. Viaflo 16-channel electronic pipette (INTEGRA) is used to prepare pre-aliquoted plates with master mixtures or reagents.
For dispensing low volumes (less than 3 μL) we usually use Mantis (FORMULATRIX) and Mosquito HV (SPT Labtech), while for dispensing larger volumes we pre-aliquot the specific solution into a fresh 384-deep well plate and then use Viaflo 384 (INTEGRA) to transfer it. For aspirating lower volumes, we use Mosquito HV (SPT Labtech) and for higher volumes we use Viaflo 384 (INTEGRA). When proceeding with the protocol, it is up to the user to decide how to dispense and aspirate solutions.
Of note, the 384-well plates should be DNA low-bind and PCR-clean. We opted for twin.tec PCR Plates LoBind (Eppendorf, see key resources table), but Hard-Shell 384-well PCR Plates (Bio-Rad) worked equally well based on our experience.
Below we describe the solutions that need to be prepared in order to perform the protocol.
Transcriptomic part
Oligo dT bead preparation
Timing: 20 min Dynabead solution AReagentFinal concentrationAmountNaOH (10 M)0.1 M100 μLNaCl (5 M)0.05 M100 μLddH_2_ON/A9.8 mLTotalN/A10 mLCan be stored at 4°C for 1 month. Dynabead solution BReagentFinal concentrationAmountNaCl (5 M)0.1 M200 μLddH_2_ON/A9.8 mLTotalN/A10 mLCan be stored at 4°C for 1 month. Dynabead 2× “Bind and wash” buffer (B&W)ReagentFinal concentrationAmountTris-HCl pH 7.5 (1 M)0.01 M100 μLEDTA (0.5 M)1 mM20 μLNaCl (5 M)2 M4 mLddH_2_ON/A5.88 mLTotalN/A10 mLCan be stored at 4°C for 1 month. Genome and transcriptome wash buffer (G&T)ReagentFinal concentrationAmountTris-HCl pH 8.3 (1 M)0.05 M500 μLKCl (3 M)0.075 M250 μLMgCl_2_ (1 M)3 mM30 μLDTT (0.1 M)0.01 M1 mLTween-20 (100%)0.5%50 μLddH_2_ON/A8.17 mLTotalN/A10 mLCan be stored at 4°C for 1 month. PEG 50%ReagentFinal concentrationAmountPEG 800050% w/v5 gddH_2_ON/AAdd untilTotalN/A10 mLCan be stored at 4°C for 6 months. This solution is used It is used for the RT master mix.
Genomic part
Conversion reagent
Timing: 20 min ReagentFinal concentrationAmountCT Conversion Reagent (powder)N/A1 bottleM-solubilization bufferN/A7.9 mLM-Dilution bufferN/A3 mLM-Reaction bufferN/A1.6 mLTotalN/A12.5 mL
- •Add 7.9 mL of M-solubilization Buffer + 3 mL of M-Dilution Buffer into CT Conversion Reagent (Powder bottle). Vortex 10 min.
- •Add 1.6 mL of M-Reaction Buffer. Vortex 3 min. Aliquot into dark 1.5 mL microcentrifuge tubes and store for up to 1 month a −20°C. 1 bottle of conversion reagent can be used to process 1 ½ plates.
PEG buffer 18%
Timing: 20 min ReagentFinal concentrationAmountPEG 800018% w/v9 gNaCl2.5 M7.3 gTris-HC pH 8 (1 M)10 mM500 μLEDTA (0.5 M)1 mM100 μL100% Tween-200.05%25 μLddH_2_ON/AAdd until 50 mLTotalN/A50 mLSterilize through a 0.2 μm filter and treat the buffer with UV irradiation for 1 h (a laminar flow hood with UV light can be used to sterilize the solution). It can be stored for 1 month at 4°C.
Step-by-step method details
Tissue processing for the preparation of single-cell suspension
Timing: 2–3 h
Here a solution of single cells will be prepared starting from the tissue or cell system of origin.Note: The time for obtaining a single cell preparation depends on the starting tissue. For isolating neural stem cells, neuroblasts and neurons, the times per mouse are explained below. Subventricular zone and olfactory bulb dissociation: 15 min. Tissue processing and single cell preparation with the Neural Tissue Dissociation Kit (NTDK, Miltenyi, see key resources table): 40 min (follow the manufacturer protocol: https://www.miltenyibiotec.com/upload/assets/IM0001320.PDF). Antibody labeling and final wash: 30 min. For more information on the sorting strategy see the following paper.16
For the isolation of single cells from pancreatic organoids the times are explained below. Incubation of organoid with TrypLE Express: 30 min. Washing and single cell resuspension: 30 min. For more information on the generation of pancreatic organoids, see the following papers.17^,^18
Single-cell collection and methyltransferase reaction
Timing: 1 h
Through this step, cells will be sorted into 384-well plates and will undergo a reaction with a methyltransferase to obtain information about DNA accessibility.Note: Prepare a single cell suspension of your cell type of interest. Then proceed to cell collection. Collect cells on individual wells of a low binding 384-well plate. For sorting live cells, we use Sytox blue dead cell stain (see key resources table) on our sorting strategy. The use of FACS is preferred. Alternatively, cell printing devices like cellenONE (Cellenion) can also be used. The collection solution is composed of a mild lysis buffer (IGEPAL CA-630), used to permeabilize the nuclear membrane and a GpC methyltransferase (M.CviPI), which adds methyl groups to cytosines in GpC islands located in non-nucleosome bound DNA. The latter allows the assessment of chromatin accessibility throughout the genome.
- 1.Prepare GpC methyltransferase reaction buffer. Prepare fresh and keep on ice. GpC methylase master mixReagentFinal concentrationAmount for 1 reactionAmount for 1 plate (384 + 10%)ddH_2_O0.57 μL240.79 μLGpC methyltransferase buffer (10×)1×0.1 μL42.24 μLSAM (32 mM)0.16 mM0.005 μL2.11 μLIGEPAL CA-630 (1%)0.1%0.1 μL42.24 μLRNase-in (40 U/μL)1 U/μL0.025 μL10.56 μLM.CviPI (4 U/μL)0.8 U/μL0.2 μL84.48 μLTotal1 μL422.42 μL
- 2.Add 1 μL of the mix into every well of a 384-well plate. Index sort single cells on the plate. Note: Index sorting is a mode of the FACS instrument that allows the isolation of single cells while recording the coordinates of all fluorescence and scatter parameters for each individual event. It is advisable to keep the temperature of the plate holder at 4°C during sorting.Optional: Sort minibulks of 25–100 cells per cell type into single wells as positive control and to obtain a deeper coverage from both the transcriptome and the genome of specific cell populations. For minibulks, the volume per well and the incubation time can remain the same as with single cells.CRITICAL: The FACS sorter or cell printing device (e.g. FACS Aria II) should have a 4°C cooling block, to keep the methyltransferase reaction inhibited until all the cells are sorted.
- 3.After sorting, centrifuge the plate at 1,000 × g for 10 s.
- 4.Incubate on a thermocycler for 15 min at 37°C with the lid at 50°C. Add 2 μL of RLT Plus buffer and centrifuge at 1,000 × g for 20 s. CRITICAL: Aliquot the RLT Plus buffer upon arrival to avoid contamination of the reagent, which can cause a decrease in the quality of the cDNA library.Pause Point: Store plate at −80°C or proceed directly with the separation of the mRNA and gDNA.
Separation of mRNA from gDNA
Oligo dT bead preparation
Timing: 40 min
Here the binding of the dynabeads to the oligo-dT takes place through the strong interaction between Streptavidin and Biotin. To that end, we prepare and wash the dynabeads with a series of buffers.
- 5.Add 225 μL Dynabeads (MyOne Streptavidin C1) to a 1.5 mL microcentrifuge tube.
- a.Place on a magnet, wait 30 s and remove supernatant (SN).
- 6.Wash the beads with Solutions A, B and B&W buffer.
- a.Resuspend beads in 400 μL of Solution A by pipetting outside the magnet. Place on magnet, wait 30 s and remove the SN.
- b.Repeat step a one more time.
- c.Resuspend beads in 200 μL of Solution B by pipetting outside the magnet. Place on magnet, wait 30 s and remove the SN.
- d.Resuspend the beads in 225 μL of 2× B&W buffer and add 225 μL of Oligo-dT-SS3 (100 μM).
- e.Incubate by rotation for 15 min at 18°C–25°C. Pause Point: This solution can be stored overnight at 4°C.
- 7.Prepare the bead resuspension solution, G&T wash buffer + RNase inhibitor and the reverse transcription (RT) Master Mix. Bead resuspension solutionReagentFinal concentrationAmount for 1 reaction (1×)Amount for 1 plate (384 + 15%, i.e., 441.6×)ddH_2_O3.1 μL1368.96 μLBuffer RT (5 ×) from Maxima enzyme1 ×0.8 μL353.28 μLRNAse Inhibitor (40 U/μL)1 U/μL0.1 μL44.16 μLTotal4 μL1766.4 μLStore on ice until use. Once used to resuspend the Oligo-dT beads, aliquot solution into a fresh 384-well plate.G&T Wash buffer with RNase InhibitorReagentFinal concentrationAmount for 1 reaction (1×)Amount for 1 plate (384 + 15%, i.e., 441.6×)G&T Wash buffer14.85 μL6557.76 μLRNase Inhibitor (40 U/μL)0.4 U/μL0.15 μL66.24 μLTotal15 μL6624 μLStore on ice until use.Optional: Aliquot the G&T wash buffer + RNase Inhibitor in a new plate to increase the efficiency of the separation of mRNA and gDNA. By aliquoting the G&T wash buffer in a different plate, we reduced the time for transferring the wash buffer to the sample plate, thereby decreasing the time that the beads are drying out. Over-drying beads might prevent an efficient elution of the mRNA in the RT mix.RT master mix (mind the order)ReagentInitial concentrationAmount for 1 reaction (1×)Amount for 1 plate (384 + 15%, i.e., 441.6×)Final concentrationddH_2_O1.185 μL523.30 μLdNTP mix10 mM0.2 μL88.32 μL1 mMTris-HCl pH 8.31 M0.040 μL17.66 μL25 mMNaCl1 M0.060 μL26.5 μL30 mMMgCl_2_100 mM0.050 μL22.08 μL2.5 mMGTP100 mM0.020 μL8.83 μL1 mMTSO (Template switching oligo)100 μM0.040 μL17.66 μL2 μMRNase Inhibitor40 U/μL0.025 μL11.04 μL0. 5 U/μLPEG50%0.2 μL88.32 μL5%DTT (add second to last)100 mM0.160 μL70.66 μL8 mMMaxima H-minus RT (add last)200 U/μL0.020 μL8.83 μL2 U/μLTotal2 μL883.2 μLStore on ice until use.
Bead resuspension and separation of genomic and transcriptomic fractions
Timing: 30 min
Through these steps the polyadenylated RNAs will bind to the oligo-dT-bound dynabeads which will be kept on the well through the use of a magnetic block. On a second step, the gDNA will be separated from the RNA faction by a series of washes.
- 8.Resuspend the beads in 400 μL of B&W buffer 1× by pipetting outside the magnet.
- a.Place on magnet, wait 30 s and remove the SN.
- b.Repeat this step 3 times more to reach a total of 4 washes.
- 9.Resuspend beads with the prepared Bead Resuspension solution. Mix by vortexing thoroughly 15 s (we apply 2500 rpm for vortexing). CRITICAL: After resuspending the beads with the bead resuspension solution, please use the solution within the next 30 min, to keep the RNase inhibitor within its optimal activity time window.
- 10.Transfer 4 μL of bead resuspension solution to the mRNA plate.
- a.Vortex 30 s at maximum speed, spin down the plate and incubate 3 min at 18°C–25°C.
- b.Repeat twice more to reach a total incubation time of approx. 10 min.
- c.After the incubation centrifuge at 1,000 × g for 1 min at room temperature (RT, 18°C–25°C).
- 11.Separation of gDNA from polyadenylated RNAs.
- a.Place the plate on magnet and incubate 2 min until the suspension is clear.
- b.Aspirate 7 μL from the mRNA plate still on the magnet and transfer to the gDNA plate.
- c.Add 5 μL of G&T wash buffer to the mRNA plate.
- d.Vortex mRNA plate for 30 s, spin down on a benchtop centrifuge for 10 s and incubate 1 min.
- e.Repeat step d two more times to achieve an incubation time of 5 min. Centrifuge the mRNA plate for 1 min at 1,000 × g.
- f.Put mRNA plate on magnet, incubate 2 min and transfer SN to gDNA plate.
- g.Repeat steps c-f twice more. Now you have 22 μL of gDNA eluate on the gDNA plate. Store the gDNA plate at −20°C until proceeding with the gDNA library preparation at step 38.
- 12.Immediately add 2 μL of the 18°C–25°C mix to the mRNA plate on ice.
Transcriptomic part
Reverse transcription, cDNA amplification, and cDNA purification
Timing: 6 h
Here the polyadenylated RNA will be retrotranscribed, and then subsequently amplified. At the end the cDNA will be purified with magnetic beads.
Reverse transcription and cDNA amplification.
Through these steps the polyA mRNA will be reverse-transcribed and amplified. Afterward, the obtained cDNA will be purified before proceeding with tagmentation and library amplification.
The first PCR is a standard reverse transcription reaction with no amplification step. In the following PCR amplification step, generating a double stranded cDNA from the single stranded cDNA template needs to be optimized per cell type to ensure amplification of just sufficient cDNA with minimal PCR amplification bias. For testing this, we advise users to prepare a so-called validation plate per cell type to run tests for determining RNA quality and optimal PCR cycle before proceeding with a sample plate.
- 13.Incubate plate on a thermocycler as follows.Reverse transcription. PCR cycling conditionsTemperatureTimeCycles42°C90 min150°C2 min1042°C2 min85°C5 min14°CHoldOptional: A pre-wash of unbound TSO before proceeding to the cDNA amplification step might help reducing TSO dimers (peak between 80 and 150 bp in the Bioanalyzer traces). To avoid this, perform a TSO wash after the reverse transcription. We therefore advise to perform a test run with few samples to see whether TSO dimers represent a problem for the tested samples. If so, proceed with TSO wash.
- a.After reverse transcription, place mRNA plate on magnet and incubate 3 min.
- b.Discard SN. Add 20 μL of 1× RT buffer.
- c.Vortex 30 s and spin down. Incubate on magnet 3 min. Discard SN and add TSO-wash cDNA amplification master mix (5 μL).TSO-wash cDNA amplification master mix (when doing TSO-wash)ReagentInitial concentrationAmount for 1 reaction (1×)Amount for 1 plate (384 + 15%, i.e., 441.6×)Final concentrationddH_2_O3.075 μL1357.92 μLHiFi HotStart (KAPA HiFI HotStart Polymerase)1 U/μL0.1 μL44.16 μL0.02 U/μL5× HiFi Fid. With Mg (KAPA High Fidelity Buffer 5×)5 ×1 μL441.6 μL1 ×MgCl_2_100 mM0.075 μL33.12 μL0.5 mMdNTP mix10 mM0.15 μL66.24 μL0.5 mMForward Primer10 μM0.25 μL110.4 μL0.5 μMReverse Primer10 μM0.05 μL22.08 μL0.1 μMPEG50%0.2 μL88.32 μL5%Tris-HCl pH 8.31 M0.040 μL17.66 μL25 mMNaCl1 M0.060 μL26.5 μL30 mMTotal5 μL2208 μL
- 14.If no TSO wash is performed, prepare cDNA amplification master mix (MM) and add 3 μL of the MM to the plate. Vortex gently and spin down on benchtop centrifuge.cDNA amplification master mixReagentInitial concentrationAmount for 1 reaction (1×)Amount for 1 plate (384 + 15%, i.e., 441.6×)Final concentrationddH_2_O1.425 μL629.28 μLHiFi HotStart (KAPA HiFI HotStart Polymerase)1 U/μL0.1 μL44.16 μL0.02 U/μL5× HiFi Fid. With Mg (KAPA High Fidelity Buffer 5×)5 ×1 μL441.6 μL1 ×MgCl_2_100 mM0.025 μL11.04 μL0.5 mMdNTP mix10 mM0.15 μL66.24 μL0.5 mMForward Primer10 μM0.25 μL110.4 μL0.5 μMReverse Primer10 μM0.05 μL22.08 μL0.1 μMTotal3 μL1324.8 μL
- a.Incubate plate on thermocycler as follows:cDNA Amplification. PCR cycling conditionsStepsTemperatureTimeCyclesInitial Denaturation98°C3 min1Denaturation98°C20 s18–27Annealing65°C30 sExtension72°C4 minFinal extension72°C5 min1Hold4°CNote: Cycle number depends strongly on the cell type used. In our case we used 24 cycles for primary NSCs, astrocytes, oligodendrocytes, neuroblasts and neurons. For pancreatic organoid cells we used 20 cycles. It is advisable to test different cycle numbers between 18 and 25 before proceeding with the full protocol. A concentration of more than 0.3 ng/μL and the lack of fragments smaller than 500 bp are characteristics of a good cDNA profile.Pause Point: Store at 4°C up to 16 h or proceed directly with the purification of the cDNA.cDNA purification: Bead clean-up.
- 15.Equilibrate AMPure XP beads at 18°C–25°C for 30 min. Add 3 μL of beads to the mRNA plate (reaching 0.6× ratio of beads to sample volume).
- 16.Vortex for 30 s and spin down. Incubate 3 min. Repeat twice more to reach a total of 10 min of incubation at RT. Centrifuge the plate at 1,000 × g for 1 min.
- a.During the incubation time prepare 18 mL of EtOH 80% and aliquot 41 μL into a new 384-well plate.
- 17.Incubate the mRNA plate 2 min on magnet. Discard the SN and perform the following step twice (EtOH wash):
- a.Add 20 μL of EtOH 80% to the mRNA plate (on magnet). Wait 30 s and discard SN. Let the beads from the mRNA plate dry for 2 min, until no EtOH 80% is seen on the wells.
- 18.Remove mRNA plate from magnet. Add 8 μL of nuclease-free water. Vortex 30 s, spin down and incubate 1 min at RT. Repeat the vortexing and incubation two times more, to reach a total of 5 min incubation.
- 19.Place the plate on magnet for 2 min and transfer SN to a new plate (cDNA plate).
- 20.Perform quality control:
- a.Measure the concentration of 10 random samples (wells) with Qubit dsDNA HS Assay Kit as described by the manufacturer’s instructions (https://www.thermofisher.com/document-connect/document-connect.html?url=https://assets.thermofisher.com/TFS-Assets%2FLSG%2Fmanuals%2FQubit_dsDNA_HS_Assay_UG.pdf):
- i.Mix 1 μL of sample + 199 μL of a mix consisting of 199 μL of Qubit HS buffer + 1 μL of Qubit reagent. Vortex and measure on Qubit Fluorometer (Thermo Fisher Scientific).
- b.Load 1 μL of the 10 samples onto a Bioanalyzer High Sensitivity DNA chip (or TapeStation, Agilent) (concentration should not exceed 5 ng/μL, otherwise dilute in nuclease-free water before loading). Follow the manufacturer’s instructions (https://www.agilent.com/cs/library/usermanuals/public/G2938-90322_HighSensitivityDNAKit_QSG.pdf).
- c.Check the quality of the cDNA (see Figure 1 that displays good quality cDNA profiles, and troubleshooting 1).Figure 1. Expected outcomes after cDNA amplificationMeasure the concentration of the cDNA with a Qubit Fluorometer (Thermo Fisher Scientific) and the fragment distribution with Bioanalyzer or Tape Station (Agilent). cDNA profile of 4 random samples. Note that the proportion of primer dimer (50–150 bp) is lower than the one of the cDNA fragments (400–10000 bp). The proportion of primer dimers should not exceed the one showed here. Parts of this figure are created with BioRender.com. Optional: To get a better overview of the quality of the whole plate, the concentration of all the samples (384) can be measured using a fluorescent microplate reader (Biotek Synergy LX, Agilent) together with the Quant-IT PicoGreen dsDNA Assay-Kit. This also allows an optimal normalization of the cDNA before proceeding to the tagmentation.
For more information follow the manufacturer’s instructions (https://www.thermofisher.com/document-connect/document-connect.html?url=https://assets.thermofisher.com/TFS-Assets%2FLSG%2Fmanuals%2Fmp07581.pdf).
Tagmentation-based library preparation
Timing: 2 h
Through these steps, the cDNA will be tagmented with sequencing adaptors and indexed. This allows the final multiplexing of the 384 or 768 single cells, depending on whether you plan to sequence 1 or 2 plates on the same transcriptomics sequencing run. For more information about the amount of input and cycle number required for the tagmentation process, please refer to the Smart-seq3 protocol.5^,^6
Tagmentation.
- 21.Normalize the cDNA to a concentration of 1 ng/μL. If the overall concentration of the plate is lower, normalize to 0.7 ng/μL and adjust appropriately the reaction volumes. Note: If a microplate reader is not available, average the concentration measurements from 10–15 random cells and then dilute the cDNA to the final concentration of 1 ng/μL with nuclease-free water. If a microplate reader is available, determine the cDNA concentrations and add the proper volumes of water per well in order to normalize the concentration of each well to 0.4–2.5 ng/μL. This can be done with Mantis.
- 22.Prepare the tagmentation master mix and aliquot 1.2 μL on a new plate (tagmentation plate). Tagmentation master mixReagentAmount for 1 reaction (1×)Amount for 1 plate (384 + 15%, i.e., 441.6×)Tagment DNA buffer0.8 μL353.28 μLAmplicon Tagment mix0.4 μL176.64 μLTotal1.2 μL529.92 μL
- 23.Add 0.4 μL of normalized cDNA (100–1000 pg of input) to the tagmentation plate. Vortex 30 s, and spin down. Repeat vortex and spin two times more. Incubate on thermocycler. Note: Input amounts of cDNA can vary. For a specific table describing the input amount for tagmentation please refer to the Smart-seq219 and Smart-seq35^,^6 papers. In addition, if having remaining TSO dimers from the cDNA amplification part, increase the input amount to compensate for their presence. The same procedure can be applied in case of obtaining suboptimal profiles after tagmentation (see troubleshooting).cDNA tagmentation. PCR cycling conditionsStepsTemperatureTimeCyclesTagmentation55°C10 min1Hold4°C
- 24.Add 0.4 μL of 0.2% SDS to the tagmentation plate. Vortex for 30 s and spin down. Incubate 5 min at 18°C–25°C. Optional: Instead of 0.2% SDS, NT buffer (Nextera XT DNA sample preparation kit) can be used.SDS 0.2%ReagentAmount for 1 reaction (1×)Amount for 1 plate (384 + 15%, i.e., 441.6×)SDS 0.2%0.4 μL70.66 μL
Library amplification.
- 25.Add 1.2 μL of Nextera PCR master mix (NPM) to the tagmentation plate. Optional: Alternatively, KAPA HiFi ready mix (2×) can be used instead of the Nextera PCR master mix. In this case use 3.2 μL instead of 1.2 μL for the final mix. Our experience shows that the results are similar by comparing the use of the 2 polymerases. If using the KAPA mix, make sure to keep the same proportion of beads to the sample volume in the further clean-up steps.Nextera PCR Master mixReagentAmount for 1 reaction (1×)Amount for 1 plate (384 + 15%, i.e., 441.6×)Nextera PCR Mastermix1.2 μL529.92 μL
- 26.Add 0.8 μL of Nextera Primer index mix (i5 + i7 indexes combined at a concentration of 12.5 μM, see enclosed table with the index sequences: Table S1: mRNA index primers). Vortex 30 s, spin down and incubate on thermocycler.Figure 2mRNA library amplification indexesThe figure shows the possible combinations of i5 and i7 indexes in order to multiplex 768 cells on a single sequencing run. Note: Example layout of indexes for multiplexing 768 cells for the same sequencing run (Figure 2). This strategy uses combinatorial indexing and the numbers represent the indexes used. We provide the files with the index sequences in a format that can be easily used for ordering the oligos (5er and 7er indexes). The original design of the primers can be found here.10Library amplification. PCR cycling conditions with NPMStepsTemperatureTimeCyclesInitial Extension72°C3 min1Initial Denaturation98°C3 min1Denaturation98°C10 s6–16Annealing55°C30 sExtension72°C30 sFinal extension72°C5 min1Hold4°CCRITICAL: Cycle number can be adjusted according to the input of cDNA. For primary NSCs, astrocytes, oligodendrocytes, neuroblasts and neurons we have used 13 cycles for an input of 500 pg. For pancreatic organoids we have used 12 cycles for an input of 400 pg. However, the number of cycles and the amount of input depend on the cell type. When using KAPA instead of Nextera PCR Mastermix, the PCR conditions are different for certain steps, as follows. Denaturation: 98°C for 20, Annealing: 63°C for 15 s. For more information on input and cycle number please refer to the Smart-seq2 and Smart-seq3 protocols.5^,^6 Below is the table showing the cycle layout.Library amplification. PCR cycling conditions with KAPAStepsTemperatureTimeCyclesInitial Extension72°C3 min1Initial Denaturation98°C30 s1Denaturation98°C20 s6–16Annealing63°C15 sExtension72°C30 sFinal extension72°C3 min1Hold4°C
cDNA library purification, quality control, and sequencing
Timing: 4 h
Through these steps the cDNA library will be purified and checked for quality control.
Purification by bead clean-up.
- 27.Equilibrate AMPure XP beads at RT for 30 min. Add 3 μL of beads to the tagmentation plate, reaching a 0.75× proportion.
- 28.Vortex for 30 s and spin down. Incubate 3 min.
- a.Repeat twice more to reach a total of 10 min of incubation at RT.
- b.Centrifuge the plate at 1,000 × g for 1 min.
- c.During the incubation time prepare 18 mL of EtOH 80% and aliquot 41 μL into a new 384-well plate.
- 29.Incubate the tagmentation plate 2 min on Magnet. Discard the SN perform the following step twice (EtOH wash):
- a.Add 20 μL of EtOH 80% to the tagmentation plate.
- b.Wait 30 s and discard SN. Note: Let the beads from the tagmentation plate dry for 2 min, until no EtOH 80% is seen on the wells.
- 30.Remove the tagmentation plate from the magnet.
- a.Add 7 μL of nuclease-free water.
- b.Vortex 30 s, spin down and incubate 1 min.
- c.Repeat the vortexing and incubation two times more, to reach a total of 5 min incubation.
- 31.Place plate on magnet for 2 min and transfer SN to a new plate (purified mRNA library plate).
- 32.Repeat the purification by adding 4.5 μL of AMPure beads (0.65×). Elute in 7 μL of nuclease-free water.
- 33.Perform Quality control similarly to the quality control of the cDNA (step 20).
Pooling of final library.
- 34.Normalize tagmented cDNA to a concentration of 0.5 ng/μL and pool 5 μL of every well into a final tube (for concentration measurement and normalization please use a similar workflow as step 21). Pooling procedure:
- a.Use Mosquito HV (SPT Labtech) to aspirate 5 μL from every column of the source plate (sample plate) and transfer to one column of a deep-well plate (called pool plate). Always change tips between transfers, to avoid contamination between the samples.
- b.After pooling into a single column, use a normal 1000 μL pipette to transfer the contents into a 2 mL microcentrifuge tube. The ideal amount should be 384∗5=1920 μL. Mix the solution by pipetting up and down 10 times. The volume might be sometimes less than 1920 μL.
- c.Transfer 960 μL into a new 2 μL microcentrifuge tube. Now the pool should be divided on 2 tubes.
- 35.Perform a 1× bead cleanup.
- a.Measure exactly the volume of pool in every tube and add the same amount of AMPure XP beads in order to reach a 1× proportion. Mix by pipetting.
- b.Incubate 10 min at RT. Place the tube 3 min on magnet and discard SN.
- c.Wash two times with EtOH 80% and resuspend in 35 μL of nuclease-free water. CRITICAL: When adding the water, resuspend first the beads with water on one tube, and then transfer the resuspended beads to the second tube (which has the dry beads). With this procedure, the two tubes are now fused into one, and the pool is resuspended in 35 μL of water containing the pooled cDNA library.
- 36.Measure the DNA concentration of the final pool using Qubit dsDNA HS Assay Kit as described before. Analyze the fragment distribution with Bioanalyzer or TapeStation (Agilent).
Sequencing
- 37.The pool can be sequenced on both patterned (NextSeq 2000 (https://emea.support.illumina.com/sequencing/sequencing_instruments/nextseq-1000-2000/documentation.html) and NovaSeq 6000 (https://emea.support.illumina.com/sequencing/sequencing_instruments/novaseq-6000/documentation.html)) and non-patterned flow cell sequencers (NextSeq550 (https://emea.support.illumina.com/sequencing/sequencing_instruments/nextseq-550/documentation.html) and HiSeq2000 (https://emea.support.illumina.com/sequencing/sequencing_instruments/hiseq_2000/documentation.html)).
Note: For a 1-plate run (384 cells) it is advisable to sequence either on a NextSeq2000 P1 100 cycles (100 million reads) or on a NexSeq 550 75 bp Paired End Mid output (MO) (104 million reads), in order to reach 300,000 reads per cell. For a 2-plate run (786 cells) the NS550 75 bp Paired End High output (HO) (320 Million reads) or the NS2000 P2 100 cycles (400 million reads) are recommended. Patterned-flow cell sequencers offer an improved sequencing yield together with a much lower cost per sequenced read. We think this improvement will allow users to reduce the price of their sequencing runs. It is always recommended to spike in PhiX to the sample before sequencing. PhiX is an adapter-ligated library used as a control for Illumina sequencing runs. It offers benefits for sequencing and alignment. We have used 1% as a final concentration of PhiX in our sequencing runs for the NS550. When sequencing on a NS2000, users should add PhiX at 8%–10% final concentration, instead of the 1% that is used for non-patterned flow cells. The combinatorial indexing strategy for mRNA sequencing remains the same as in the original protocol.
Genomic part
gDNA purification and bisulfite conversion
Timing: 4 h
Through these steps the gDNA will be purified and bisulfite-converted. In this process, the gDNA will be fragmented and non-methylated cytosines will be chemically modified into uracils. In the conversion step, unmethylated cytosines will be deaminated. In order to save time, this step can be performed on the same day as the final part of the cDNA library preparation.
gDNA purification.
- 38.Equilibrate AMPure XP beads at RT for 30 min.
- a.Add 15 μL of beads to the gDNA plate (reaching 0.68× proportion) which was frozen and stored at −20°C on step 11.
- 39.Vortex for 30 s and spin down.
- a.Incubate 10 min at RT.
- b.Repeat twice more to reach a total of 30 min of incubation.
- c.Centrifuge the plate at 1,000 × g for 1 min. During the incubation time, prepare 18 mL of EtOH 80% and aliquot 41 μL into a new 384-well plate.
- 40.Incubate 2 min on magnet. Discard SN and perform the following step twice (EtOH wash):
- a.Add 20 μL of EtOH 80% to the gDNA plate. Wait 30 s and transfer SN to waste plate. Let the beads dry for 2 min, until no EtOH 80% is seen on the wells.
- 41.Remove gDNA plate from magnet.
- a.Add 2.5 μL of nuclease-free water.
- b.Vortex 30 s, spin down and incubate 1 min.
- c.Repeat the vortexing and incubation twice more, to reach a total of 5 min incubation. CRITICAL: Do not aspirate the water from the gDNA plate.
Bisulfite conversion.
- 42.Place gDNA plate on magnet. Add 16 μL of pre-warmed (37°C) CT conversion reagent. Do not vortex (in order to avoid the beads mixing with the conversion reagent). Incubate on thermocycler as follows: Bisulfite Conversion. PCR cycling conditionsStepsTemperatureTimeCyclesInitial Denaturation98°C8 min1Conversion64°C180 min1Hold4°CPause Point: gDNA plate can be left 16–24 h at 4°. Do not exceed 24 h of incubation at 4°C.
Desulfonation, 1° strand synthesis, and exonuclease treatment
Timing: 8 h
Through these steps the converted gDNA will be purified and the desulfonation process will take place, whereby the sulfite moiety from the cytosines will be removed to generate uracil bases. At the end the process of DNA amplification will start, with the 1° strand synthesis and the remaining free primers will be excised by exonuclease treatment.
gDNA clean-up with MagBinding beads.
- 43.Prepare Zymo MagBinding bead mix by mixing beads with M-Binding buffer in the following proportion: MagBinding bead mixReagentAmount for 1 reaction (1×)Amount for 1 plate (384 + 15%, X441.6)MagBinding beads5 μL2208 μLM-Binding buffer70 μL30912 μLTotal75 μL33120 μL
- 44.Aliquot 75 μL of bead mix into a 384-deep well plate. Also prepare an EtOH plate with 41 μL per well.
- 45.Perform the binding of the Bead mix with the gDNA.
- a.Transfer 25 μL of bead mix from the deep-well plate to the gDNA plate, perform a pipette mix and transfer 45 μL back to the deep-well plate.
- b.Add again 25 μL of bead mix to the gDNA plate, mix and transfer 25 μL back to the deep-well plate.
- c.Rinse the gDNA plate with 20 μL of bead mix and transfer all the remaining liquid to the deep-well plate. Vortex the deep-well plate 30 s and incubate 5 min at 18°C–25°C.
- 46.Procedure for discarding of SN and washing of the gDNA:
- a.Transfer 33.3 μL of bead mix from the deep-well plate to the gDNA plate. Spin down the gDNA plate at 1,000 × g for 1 min and then put plate on the magnet. Incubate 2 min. Discard SN.
- b.Repeat step a twice more and make sure that there are no beads remaining on the deep-well plate.
- c.Perform the following step once (EtOH wash):
- i.Add 20 μL of EtOH 80% to the gDNA plate. Wait 30 s and transfer SN to waste plate. Let the beads air dry at 18°C–25°C for 2 min.
Desulfonation and 1° strand synthesis.
- 47.Add 25 μL of M-Desulfonation to the gDNA plate. Vortex 30 s and spin the samples shortly. Incubate 15 min at 18°C–25°C. Meanwhile, prepare the 1° strand synthesis mix: 1° strand synthesis master mixReagentInitial concentrationAmount for 1 reaction (1×)Amount for 1 plate (384 + 15%, i.e., 441.6×)Final concentrationddH_2_O7.9 μL3488.64 μLBlue buffer (Part of the Klenow enzyme kit, see key resources table)10 ×1 μL441.6 μL1×dNTP mix10 mM0.4 μL176.64 μL0.4 mMPreamplification Oligo (1° Strand oligo)10 μM0.4 μL176.64 μL0.4 μMTotal9.7 μL4283.52 μL
- 48.Centrifuge the gDNA plate at 1,000 × g for 1 min and place on magnet for 2 min. Perform two EtOH washes (as explained on step 46.c.I).
- 49.To dry the beads, put the gDNA plate without foil on a thermocycler with the lid open for 8 min at 55°C.
- 50.Add 9.7 μL of First Strand synthesis mix and seal the plate. Vortex 30 s, spin down briefly and incubate 1 min. Repeat the vortexing step twice more to reach a total of 5 min incubation.
- 51.Incubate the sealed plate 5 min at 55°C on a thermocycler with the lid closed.
- a.Centrifuge plate at 1,000 × g for 1 min.
- b.Put on magnet for 2 min and transfer SN to a new, fresh plate.
- c.Incubate 3 min at 65°C on a thermocycler. Immediately cool on ice.
- 52.Add 0.3 μL of Klenow (50 U/μL). Vortex 10 s and spin down. Incubate on thermocycler as follows: 1° strand synthesis – short PCR. PCR cycling conditions - 1 partStepsTemperatureTimeCyclesInitial Incubation4°C5 min1Slow ramping4°C–37°C at a rate of 4°C/min (0.06°C/s)8.25 min1Extension37°C30 min1Hold4°C
- 53.Incubate at 95°C for 45 s and afterward cool to 4°C on an ice block.
- 54.Add 0.6 μL of “first strand extra cycles” mix. 1° strand synthesis “extra cycles” master mixReagentInitial concentrationAmount for 1 reaction (1×)Amount for 1 plate (384 + 15%, i.e., 441.6×)ddH_2_O0.156 μL68.89 μLBlue Buffer10×0.06 μL26.50 μLdNTP mix10 mM0.024 μL10.60 μLPreamplification Oligo (1° Strand oligo)10 μM0.24 μL105.98 μLKlenow exo-50 U/μL0.12 μL52.99 μLTotal0.6 μL264.96 μL
- 55.Vortex 10 s, spin down and incubate as follows: 1° Strand synthesis – short PCR. PCR cycling conditions - 2 PartStepsTemperatureTimeCyclesInitial incubation4°C5 min1Slow ramping4°C–37°C at a rate of 4°C/min (0.06°C/s)8.25 min1Extension37°C30 min1Hold4°C
- 56.Go to step “53” and repeat steps 53–55 three more times. For the last repetition, use the following program for the thermocycler: 1° strand synthesis – long PCR. PCR cycling conditionsStepsTemperatureTimeCyclesInitial Incubation4°C5 min1Slow ramping4°C–37°C at a rate of 4°C/min (0.06°C/s)8.25 min1Extension37°C90 min1Hold4°C
- 57.In total you have done 5 PCRs. Pause Point: You can incubate the plate at 4°C between 16–24 h or proceed to the next step.
- 58.Add 15 μL of exonuclease mix. Vortex 30 s and spin down. Incubate on thermocycler at 37°C for 60 min with the lid at 50°C. The total volume in plate is now 27.4 μL. Pause Point: The plate can be stored up to 1 month at −20°C.Exonuclease mixReagentInitial concentrationAmount for 1 reaction (1×)Amount for 1 plate (384 + 15%, i.e., 441.6×)ddH_2_O14.5 μL6403.2 μLExonuclease I20 U/μL0.5 μL220.8 μLTotal15 μL6624 μL
1° strand product purification, 2° strand synthesis and purification, and library amplification
Timing: 4 h
Through these steps the 1° strand product will be purified and further amplified using a second primer (Adapter 2 oligo). This product will be purified at the end. On the final step, the library will be amplified by using indexed primers (Unique dual index, UDI) and the KAPA enzyme.
1° strand purification.
- 59.Equilibrate AMPure XP beads at RT for 30 min. Add 17 μL of beads to the gDNA plate (reaching 0.62× bead proportion).
- 60.Vortex for 30 s and spin down. Incubate 3 min. Repeat twice more to reach a total of 10 min of incubation. Centrifuge the plate at 1,000 × g for 1 min.
- a.During the incubation time prepare 18 mL of EtOH 80% and aliquot 41 μL into a new 384-well plate.
- b.During the incubation time also prepare the 2° strand synthesis master mix. 2° strand synthesis master mixReagentInitial concentrationAmount for 1 reaction (1×)Amount for 1 plate (384 + 15%, i.e., 441.6×)Final concentrationddH_2_O9.8 μL4327.68 μLBlue Buffer10 ×1.22 μL538.75 μL1 ×dNTP mix10 mM0.49 μL216.38 μL0.4 mMAdaptor 2 Oligo (2° Strand oligo)10 μM0.49 μL216.38 μL0.4 μMTotal12 μL5299.2 μL
- 61.Incubate 2 min on Magnet. Transfer the SN to the waste plate and perform the following step twice (EtOH wash).
- a.Add 20 μL of EtOH 80% to the mRNA plate. Wait 30 s and transfer SN to waste plate. Let the beads from the gDNA plate dry for 2 min, until no EtOH 80% is seen on the wells.
2° strand amplification.
- 62.Remove gDNA plate from magnet. Add 12 μL of 2° strand synthesis master mix. Vortex 30 s, spin down and incubate 1 min. Repeat the vortexing and incubation two times more, to reach a total of 5 min incubation. Transfer the content of every well to a new plate (without magnet).
- 63.Incubate at 95°C for 45 s and afterward cool to 4°C on an ice block.
- 64.Add 0.3 μL of Klenow-exo. Vortex 10 s and spin down. The total volume is 12.3 μL. Incubate on thermocycler as follows: 2° strand synthesis – long PCR. PCR cycling conditions.StepsTemperatureTimeCyclesInitial Incubation4°C5 min1Slow ramping4°C–37°C at a rate of 4°C/min (0.06°C/s)8.25 min1Extension37°C90 min1Hold4°C
2° strand purification.
- 65.Equilibrate PEG buffer 18% at RT for 30 min. Add 12 μL of nuclease-free water and mix. Add 18 μL of PEG buffer and mix again (the bead proportion is now 0.74×).
- 66.Vortex for 30 s and spin down. Incubate 3 min. Repeat twice more to reach a total of 10 min of incubation. Centrifuge the plate at 1,000 × g for 1 min.
- a.During the incubation time prepare 18 mL of EtOH 80% and aliquot 41 μL into a new 384-well plate.
- b.During the incubation time also prepare the library amplification master mix (KAPA mix). Library amplification master mixReagentInitial concentrationAmount for 1 reaction (1×)Amount for 1 plate (384 + 15%, i.e., 441.6×)Final concentrationddH_2_O5.75 μL2539.2 μLKAPA HiFi ready mix2×6.25 μL2760 μL1×Total12 μL5299.2 μL
- 67.Incubate 2 min on magnet. Transfer the SN to the waste plate and perform the following step twice (EtOH wash).
- a.Add 20 μL of EtOH 80% to the mRNA plate. Wait 30 s and transfer SN to waste plate. Let the beads from the gDNA plate dry for 2 min, until no EtOH 80% is seen on the wells.
Library amplification and purification
- 68.Add 12 μL of KAPA mix, vortex 30 s, and spin down. Incubate 10 min at RT to elute the DNA.
- 69.Add 0.5 μL of Index mix (combinatorial indexing of the primer mix for gDNA, see key resources table, Figure S1 and enclosed file; Table S2: gDNA index primers).
Note: This allows the full multiplexing of 384 cells on the gDNA level, with no reduction in sequencing quality and decrease in sequencing costs. Vortex 30 s and spin down. Incubate on thermocycler as follows. gDNA library amplification. PCR cycling conditionsStepsTemperatureTimeCyclesInitial denaturation95°C2 min1Denaturation94°C80 s14Annealing65°C30 sExtension72°C30 sFinal extension72°C3 min1Hold4°C
- 70.Equilibrate PEG buffer 18% at RT for 30 min. Add 12 μL of nuclease-free water and mix. Add 18 μL of PEG and mix again (the bead proportion is now 0.73×).
- 71.Vortex for 30 s and spin down. Incubate 3 min. Repeat twice more to reach a total of 10 min of incubation. Centrifuge the plate at 1,000 × g for 1 min.
- 72.Incubate 2 min on magnet. Transfer the SN to the waste plate and perform the following step twice (EtOH wash).
- a.Add 20 μL of EtOH 80% to the mRNA plate. Wait 30 s and transfer SN to waste plate. Let the beads from the gDNA plate dry for 2 min, until no EtOH 80% is seen on the wells.
- 73.Add 7 μL of nuclease-free water. Vortex 30 s, spin down and incubate 1 min. Repeat the vortexing and incubation twice more, to reach a total of 5 min incubation.
- 74.Place plate on magnet for 2 min and transfer SN to a new plate (final gDNA plate).
- 75.Perform quality control similarly to the quality control of the cDNA in step 20.
Pooling of final gDNA library.
- 76.Normalize the gDNA library to a concentration of 0.5 ng/μL and pool 3 μL of every well into a final tube (for concentration measurement and normalization, please use a similar workflow as in step 21; for pooling, use a similar workflow as in step 34).
- 77.Perform a 1× bead clean-up as described for the tagmented cDNA in step 27.
- 78.Measure the DNA concentration of the final pool with Qubit dsDNA HS Assay Kit as described before. Analyze the fragment distribution with Bioanalyzer.
Sequencing
- 79.The pool can be sequenced on an Illumina NextSeq 1000–2000 sequencer (or any other patterned-flow cell sequencer: HiSeq X, HiSeq 3000/4000, NovaSeq 6000). For 96 cells per sequencing run, it is advisable to aim for 4–6 million reads per cell, in order to reach the minimum of 50.000 CpGs per cell. It should always be sequenced paired-end and with a read length of at least 75 bp. Note that the gDNA libraries can also be sequenced on non-patterned flow cell sequencers (NextSeq550), since the samples have UDI. However, we prefer to use patterned-flow cell sequencer, since the output of sequencing data is more cost-effective. We have used 15% as a final concentration of PhiX in our sequencing runs for the gDNA part. Note that this high concentration is due to the low diversity of bisulfite treated gDNA libraries.
Alignment and quantification of transcriptomic data
Timing: 4 h
Through these steps the transcriptomic data will be mapped to the reference genome. This allows the quantification of the gene expression profile of single cells.
Follow the steps recommended by5^,^6 in the SmartSeq3 protocol. For convenience, we briefly recapitulate these methods.
- 80.Convert Binary Base Call (BCL) files to FASTQ format with the bcl2fastq software provided by Illumina.bcl2fastq --use-bases-mask Y150N,I8,I8,Y150N --no-lane-splitting --create-fastq-for-index-reads -R /run_directory/where /run_directory/ is the directory containing the BCL files.
- a.Inspect the quality of several FASTQ files with FASTQC (https://www.bioinformatics.babraham.ac.uk/projects/fastqc/).
- b.All FASTQ files may then be demultiplexed, mapped, and quantified with the software zUMIs (https://github.com/sdparekh/zUMIs). To configure your zUMIs run, you will need to prepare a YAML file that denotes all parameters and paths.5^,^6 provide the following template for a typical Smart-seq3 run:project: Smartseq3sequence_files: file1: name: /smartseq3/fastq/Undetermined_S0_R1_001.fastq.gz base_definition: - cDNA(23-150) - UMI(12-19) find_pattern: ATTGCGCAATG file2: name: /smartseq3/fastq/Undetermined_S0_R2_001.fastq.gz base_definition: - cDNA(1-150) file3: name: /smartseq3/fastq/Undetermined_S0_I1_001.fastq.gz base_definition: - BC(1-8) file4: name: /smartseq3/fastq/Undetermined_S0_I2_001.fastq.gz base_definition: - BC(1-8) reference: STAR_index: /resources/genomes/Mouse/STAR5idx_noGTF/ GTF_file: /resources/genomes/Mouse/Mus_musculus.GRCm38.91.gtf additional_STAR_params: '--clip3pAdapterSeq CTGTCTCTTATACACATCT' additional_files: - /resources/genomes/spikes/ERCC92.fa out_dir: /smartseq3/zUMIs/ num_threads: 20 mem_limit: 50 filter_cutoffs: BC_filter: num_bases: 3 phred: 20 UMI_filter: num_bases: 2 phred: 20 barcodes: barcode_num: ∼ barcode_file: /smartseq3/expected_barcodes.txt automatic: no BarcodeBinning: 1 nReadsperCell: 100 demultiplex: no counting_opts: introns: yes downsampling: '0' strand: 0 Ham_Dist: 1 write_ham: no velocyto: no primaryHit: yes twoPass: no make_stats: yes which_Stage: Filtering samtools_exec: samtools pigz_exec: pigz STAR_exec: STAR Rscript_exec: Rscript
- 81.After substituting the appropriate paths in this template, your zUMIs run may be started: zUMIs.sh –c -y Smartseq3_config.yaml
Alignment and quantification of epigenomic data
Timing: 3 days
Through these steps the epigenomic data will be mapped to the reference genome. This allows the quantification of the methylation and chromatin accessibility profile of single cells.
The total time will depend on the power of the computer cluster used for processing the data. On average we find that 3 days are enough to map 96 cells. This part of the protocol is based on recommendations described in the original scNMT-seq paper.4 We recommend Bismark (https://www.bioinformatics.babraham.ac.uk/projects/bismark/) (10.1093/bioinformatics/btr167) for mapping and quantification of genomic reads, since Bismark can quantify both CpG-methylation and GpC-methylation. Since mapping of bisulfite-converted whole-genome reads is computationally expensive, you should consider performing this analysis on a large compute cluster or a similar system. The following steps are required for every cell, so it’s advisable to use a workflow manager like Snakemake or Nextflow to process multiple cells in parallel. It is not advisable to process FASTQ-files with extremely low read number (e.g., below 10.000 reads) since these cells will not pass later quality checks anyways, and they might cause crashes in later processing steps.
- 82.Follow the steps recommended by Illumina to demultiplex your sequencing data and to convert them to FASTQ format.
- 83.Prepare the genome for methylation-aware alignment with Bismark. This step is only required once. bismark_genome_preparation --path_to_aligner /usr/bin/bowtie2/ --verbose /genomes/homo_sapiens/GRCh37/
- 84.Trim sequencing adapters with trim_galore (https://www.bioinformatics.babraham.ac.uk/projects/trim_galore/) as follows: trim_galore --output_dir trimmed/ --paired cell1_read1.fastq.gz cell1_read2.fastq.gz
- 85.Map sequencing reads to the genome in single-end non-directional mode: bismark --non_directional --genome /genomes/homo_sapiens/GRCh37/ cell1_read1.fastq.gz --output_dir mapped/bismark --non_directional --genome /genomes/homo_sapiens/GRCh37/ cell1_read2.fastq.gz --output_dir mapped/
- 86.Remove PCR duplicates: deduplicate_bismark mapped/cell1_read1_bismark_bt2.bam --single --bam --output_dir mapped/ --outfile read1_deduplicated.bamdeduplicate_bismark mapped/cell1_read2_bismark_bt2.bam --single --bam --output_dir mapped/ --outfile read2_deduplicated.bam
- 87.Merge mates: samtools merge merged/cell1_merged.bam cell1_read1_deduplicated.bam cell1_read2_deduplicated.bam
- 88.Quantify DNA methylation at all cytosines. bismark_methylation_extractor --gzip --CX --output methylation-calls/ merged/cell1_merged.bam
- 89.Use Bismark’s NOMe-seq option to distinguish between CpG and GpC methylation: coverage2cytosine --nome-seq --dir methylation-calls/ --genome_folder /genomes/homo_sapiens/GRCh37/ --output cell1 methylation-calls/cell1_merged.bismark.cov.gz
Expected outcomes
cDNA amplification
cDNA profile after amplification: The profiles should look as indicated in Figure 1. The presence of TSO dimers at around 80–150 bp in high proportion might hinder the downstream processing of the sample, in particular the tagmentation process. In this case, perform the TSO-wash as described previously. In addition, to obtain a good profile, it is advisable to reduce the time that the beads are without liquid (in particular in the mRNA and gDNA separation steps) and to pre-aliquot reagents in fresh 384-well plates in order to increase the speed of reagent transfer (see troubleshooting for more information). New data generated with this protocol can be found here.1^,^2
cDNA library preparation
cDNA library profile: The profiles should look as shown in Figure 3. An average fragment size of 500–900 bp is expected. If primer dimers are still present, perform another 0.8× purification.Figure 3cDNA library profile of 4 random samplesMeasure the concentration with a Qubit Fluorometer (Thermo Fisher Scientific) and the fragment distribution with Bioanalyzer or Tape Station (Agilent). The average fragment size should vary between 400–900 bp. If primer dimers are still present, perform one 0.8× purification. Parts of the figure are created with BioRender.com.
cDNA library pool
Pooled cDNA library profile: The profile should look as shown in Figure 4. An average fragment size of 400–900 bp is expected. If primer dimers are still present, repeat again a 1× purification. On the final pool there should not be free adaptors (fragments of size less than 200 bp), as they will interfere with the sequencing.Figure 4. Pooled cDNA librariesMeasure the concentration with a Qubit Fluorometer (Thermo Fisher Scientific) and the fragment distribution with Bioanalyzer or Tape Station (Agilent). Here two random mRNA library pools are shown. The average fragment size should be between 400–900 bp free of fragment smaller than 200 bp. Parts of the figure are created with BioRender.com.
gDNA library
gRNA library profile: The profiles should look as shown in Figure 5. An average fragment size of 500–900 bp is expected. We had some runs with an average fragment size of 500 bp and some other runs with an average fragment size of 800–900 bp. For both neural cells and pancreatic organoid cells, we have used 14 cycles. Presence of fragment at ∼200–300 bp indicates the presence of primer concatemers, which might reduce the quality of the data.Figure 5gDNA library profile of 3 random samplesMeasure the concentration of the gDNA with a Qubit Fluorometer (Thermo Fisher Scientific) and the fragment distribution with Bioanalyzer or Tape Station (Agilent). The average fragment size should vary between 500 and 900 bp. Parts of the figure are created with BioRender.com.
gDNA library pool
gRNA library pool profile: The profiles should look as shown in Figure 6. An average fragment size of 500–900 bp is normal. New gDNA data generated with this combinatorial indexing protocol can be found here.1^,^2 The combinatorial indexing data (384 cells per sequencing run) has a similar quality than the unique-dual indexed data (96 cells per run), since both types of experiments could be seamlessly integrated (for more information see supplementary table 2 of ref.2). An advantage of the combinatorial indexing approach is the reduced input requirement per well, as 384 wells are pooled for a single sequencing run instead of the standard 96. This increased multiplexing capacity reduces the need for extensive PCR amplification during library preparation.Figure 6. Pooled gDNA library profiles of two random samplesMeasure the concentration of the gDNA with a Qubit Fluorometer (Thermo Fisher Scientific) and the fragment distribution with Bioanalyzer or Tape Station (Agilent). The average fragment size should be between 500–900 bp. Parts of the figure are created with BioRender.com.
Alignment of transcriptomic data
zUMIs will create a directory zUMIs_output/expression that contains the single-cell RNA sequencing (scRNA-seq) count matrix in .loom and .rds formats for standard scRNA-seq analysis in R or Python. As is common practice, we recommend to filter cells with an unusually low number of observed genes. Note that the gene number depends not just on RNA quality and sequencing depth, but also on the overall transcriptional activity of the sample (Figure 7).Figure 7. Quality metrics of single cell transcriptomes from five different platesCells with less than 2000 observed genes are highlighted in red. These cells are candidates for quality filtering. Note that the in vitro acinar organoid cells appear to express more genes than murine in vivo cells since this difference cannot be explained by read number alone.
Alignment of epigenomic data
This workflow will produce two output files per cell, methylation-calls/cell1.NOMe.CpG.cov and methylation-calls/cell1.NOMe.GpC.cov, which list the methylation level at all CpG sites and GpC sites. Downstream analysis of these raw data may be performed with R or Python.
For quality filtering, we recommend to discard cells with less than 50.000 observed CpG sites, and possibly cells with extremely high or low global DNA methylation. Depending on DNA quality, sequencing depth, and the proportion of PCR duplicate reads, the number of observed CpG sites may vary between experiments (Figure 8).Figure 8. Quality metrics of single cell methylomes from five different plates(A) Observed CpG sites per cell versus global DNA methylation. Cells with less than 50,000 observed CpG sites are highlighted in red. These cells are candidates for quality filtering.(B) Observed CpG sites per cell versus number of reads. This shows that with at least 3–4 million reads per cell, the number of CpGs pass the lower threshold of 50,0000 CpGs.
It may also be useful to inspect DNA methylation patterns and chromatin accessibility patterns at transcription start sites, to judge the quality of the data. In mammalian cells, the average transcription start site should be less methylated and more accessible than neighboring regions (Figure 9).Figure 9. Average methylation of all transcription start sites one a single high-quality cellGenomic position is binned in bins of 10 bp width.
Limitations
The updated version of the protocol allows the processing of 384 cell per protocol run, for mRNA as well as for gDNA. To increase the number of cells to be processed and sequence, the gDNA indexes can be multiplexed to reach 768 cells per sequencing run. The protocol is also laborious and might take to up to 1 week. To reduce time, the use of the liquid handlers is recommended. As explained before, the gDNA purification and conversion step can be done on the last day of the mRNA library part, in order to save one day of work.
Troubleshooting
Problem 1
High proportion of primer or TSO dimers after cDNA amplification (steps 13 and 14).
Potential solution
- •Perform TSO-wash (See step 13).
- •Prealiquot the G&T wash buffer in a fresh plate. That enables an efficient separation of the gDNA and the mRNA and also reduces the time that the OligodT beads are exposed to air.
- •Increase the number of PCR cycles in order to amplify more the cDNA.
Problem 2
Primer dimer presence after cDNA tagmentation or suboptimal profiles (steps 21–33).
Potential solution
- •Perform another 0.6× bead cleanup in order to eliminate the presence of primer dimers.
- •Increase the input of cDNA for tagmentation.
Problem 3
Small average fragment size on gDNA library (200–300 bp, steps 68–75).
Potential solution
- •The initial material (gDNA) is in low concentration. Increase the incubation time with water from 30 min to 45 min on the gDNA purification step (step 39).
- •Decrease the proportion of beads in the purification steps of the gDNA library to 0.6×.
Problem 4
Low amount of gDNA library (less than 0.2 ng/μL, steps 68–75).
Potential solution
Repeat library amplification with 2–4 cycles.
Problem 5
High average fragment size on gDNA library (1200–1400 bp, steps 68–75).
Potential solution
The conversion was not efficient. However, the library is still sequence-ready. For the next trial use freshly prepared conversion reagent and make sure that you don’t see crystals on the solution before aliquoting into a new plate.
Problem 6
The 0.3 μL of klenow is too little to be dispensed and checked in Mantis (steps 52 and 64)
Potential solution
After preparing the 1st and 2nd strand synthesis master mix, take out 322 μL (0,7 μL∗460) of master mix and transfer to a new tube. Then add 136 μL (0.3 μL∗460) Klenow to the 322 μL of the master mix epi. In this way, you would be able to deliver 1 μL of the Klenow + Master mix in the well, instead of 0.3 μL, making the workflow easier.
Problem 7
There is still primer dimers at high concentration with respect to cDNA after the purification and quality control (step 20).
Potential solution
Perform a second 0.6× purification, and elute in 6 μL of water.
Resource availability
Lead contact
Further information and requests for resources and reagents should be directed to and will be fulfilled by the lead contact, Ana Martin-Villalba ([email protected]).
Technical contact
Request for resources and questions about the protocol can be fulfilled by the technical contact, Santiago Cerrizuela ([email protected])
Materials availability
This study did not generate new unique reagents.
Data and code availability
All sequencing data are available at the NCBI Gene Expression Omnibus (GEO) under the SuperSeries accession GSE210806. The four brain data sets depicted in Figure 7 correspond to plates pD, pH, pI, and pE. The code used to process scNMT-seq data is provided as part of the protocol.
Acknowledgments
We would like to thank the colleagues of the Molecular Neurobiology Division for fruitful discussions regarding the optimization of the protocol and Jan Philipp Mallm at the Single-Cell Open Lab at the DKFZ for providing the dual indexing primers used in the gDNA part. We thank S. Wolf & D. Helm from the DKFZ Genomics and Proteomics Core Facility; S. Schmitt from the DKFZ Flow Cytometry Core Facility, and the DKFZ Center for Preclinical Research. This work was supported by the 10.13039/100010663European Research Council (ERC; REBUILD_CNS).
Author contributions
Conceptualization: A.M.-V., S.C., and O.K. Writing – review and editing: S.C., L.P.M.K., O.K., and A.M.-V. Methodology – performing the scNMT protocol with different cell types: S.C., T.E., A.S., J.S., and A.K. Development of the miniaturized protocol: S.C., O.K., and T.E. Design and implementation of troubleshooting alternatives: A.S.-M. and A.S. Establishment of pancreatic organoid culture: J.B. and A.S. Formal analysis – data processing and statistical analysis: L.P.M.K. Funding acquisition: A.M.-V.
Declaration of interests
The authors declare no competing interests.
The reference list from the paper itself. Each links out to its DOI / PubMed record.
- 1Kremer L.P.M.Braun M.M.Ovchinnikova S.Küchenhoff L.Cerrizuela S.Martin-Villalba A.Anders S.Analyzing single-cell bisulfite sequencing data with Meth SC An Nat. Methods 2120241616162310.1038/s 41592-024-02347-x 39085432 PMC 11399085 · doi ↗ · pubmed ↗
- 2Kremer L.P.M.Cerrizuela S.El-Sammak H.Al Shukairi M.E.Ellinger T.Straub J.Korkmaz A.Volk K.Brunken J.Kleber S.DNA methylation controls stemness of astrocytes in health and ischaemia Nature 634202441542310.1038/s 41586-024-07898-939232166 PMC 11464379 · doi ↗ · pubmed ↗
- 3Clark, S. (2019). sc NMT-seq protocol. 10.17504/protocols.io.4iiguce. · doi ↗
- 4Clark S.J.Argelaguet R.Kapourani C.-A.Stubbs T.M.Lee H.J.Alda-Catalinas C.Krueger F.Sanguinetti G.Kelsey G.Marioni J.C.sc NMT-seq enables joint profiling of chromatin accessibility DNA methylation and transcription in single cells Nat. Commun.9201878110.1038/s 41467-018-03149-429472610 PMC 5823944 · doi ↗ · pubmed ↗
- 5Hagemann-Jensen M.Ziegenhain C.Chen P.Ramsköld D.Hendriks G.-J.Larsson A.J.M.Faridani O.R.Sandberg R.Single-cell RNA counting at allele and isoform resolution using Smart-seq 3Nat. Biotechnol.38202070871410.1038/s 41587-020-0497-032518404 · doi ↗ · pubmed ↗
- 6Hagemann-Jensen, M., Ziegenhain, C., Chen, P., Ramsköld, D., Hendriks, G.-J., Larsson, A.J.M., Faridani, O.R., and Sandberg, R. (2020). Smart-seq 3 Protocol. 10.17504/protocols.io.bcq 4ivyw.32518404 · doi ↗ · pubmed ↗
- 7Cerrizuela S.Kaya O.Kremer L.P.M.Sarvari A.Ellinger T.Straub J.Brunken J.Sanz-Morejón A.Korkmaz A.Martín-Villalba A.High-throughput sc NMT protocol for multiomics profiling of single cells from mouse brain and pancreatic organoids STAR Protoc.3202210155510.1016/j.xpro.2022.101555 PMC 944134036072757 · doi ↗ · pubmed ↗
- 8Dimitriu M.A.Lazar-Contes I.Roszkowski M.Mansuy I.M.Single-Cell Multiomics Techniques: From Conception to Applications Front. Cell Dev. Biol.10202285431710.3389/fcell.2022.854317 PMC 897911035386194 · doi ↗ · pubmed ↗