Etiological shifts and clinical outcomes of acute pancreatitis between urban and rural areas: evidence from a 20-year retrospective database
Ximei Cao, Zide Liu, Jingwen Rao, Jie Wu, Xin Huang, Liang Xia, Lingyu Luo, Xu Shu, Yin Zhu, Nonghua Lu, Wenhua He

TL;DR
This study shows urban and rural areas have different causes and outcomes for acute pancreatitis, with urban areas seeing more hypertriglyceridemia cases and rural areas facing more severe outcomes.
Contribution
The study provides new insights into urban–rural disparities in acute pancreatitis etiology and outcomes using a 20-year retrospective database.
Findings
Urban areas showed a higher rise in hypertriglyceridemia-induced AP compared to rural areas.
Rural patients had longer symptom-to-admission intervals and more severe AP outcomes.
Both urban and rural groups experienced accelerated growth in hypertriglyceridemia-induced AP after 2020.
Abstract
Acute pancreatitis (AP) is a well-recognized digestive emergency with established clinical significance. However, current evidence regarding urban–rural distribution patterns of AP patients remains relatively limited. Through large-scale data analysis, this study aims to provide preliminary epidemiological references for this understudied area. This 20-year retrospective cohort study (2005–2024) analyzed 12,214 acute pancreatitis (AP) cases from a tertiary medical center to investigate urban–rural disparities in etiology and clinical outcomes. Patients were stratified into urban (n = 5,002) and rural (n = 7,212) groups based on residential location. We compared demographic characteristics, etiological distributions, disease severity, complications, and hospitalization outcomes between the groups. Risk factors for moderate-to-severe AP were assessed using multivariable logistic…
Genes, proteins, chemicals, diseases, species, mutations and cell lines named across the full text — each resolved to its canonical identifier and authoritative record.
Click any figure to enlarge with its caption.
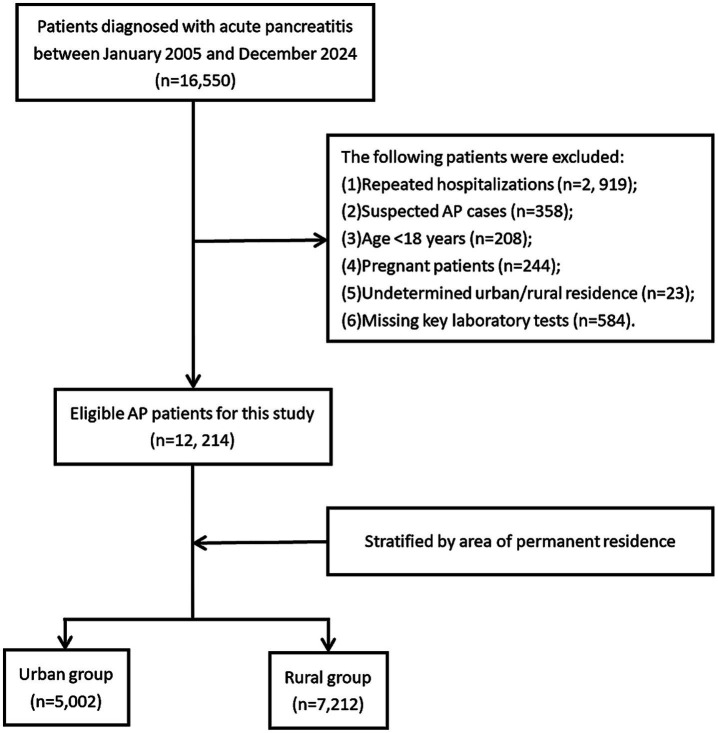 Figure 1
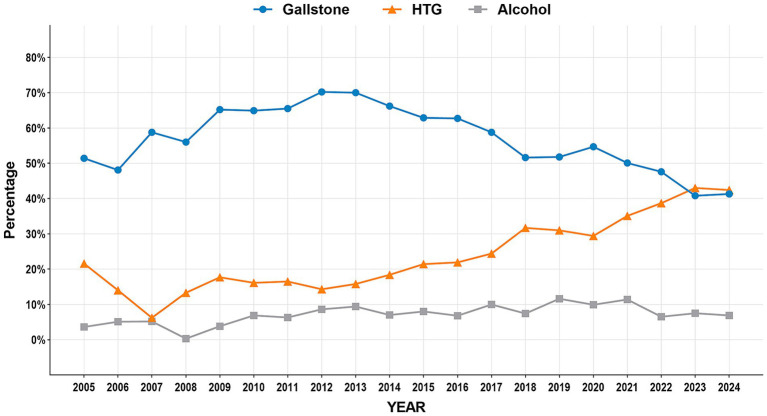 Figure 2
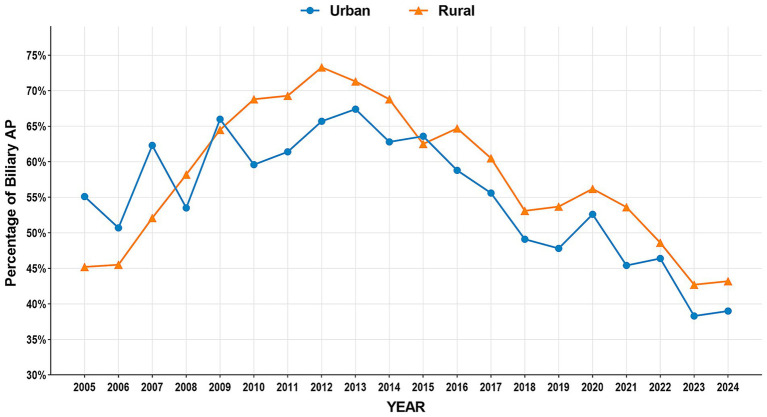 Figure 3
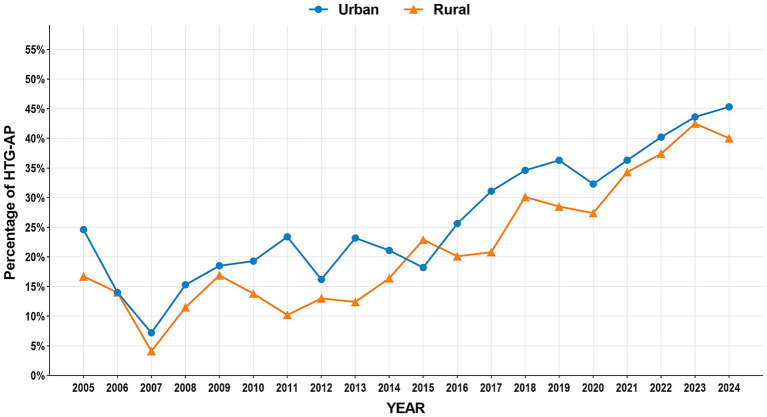 Figure 4
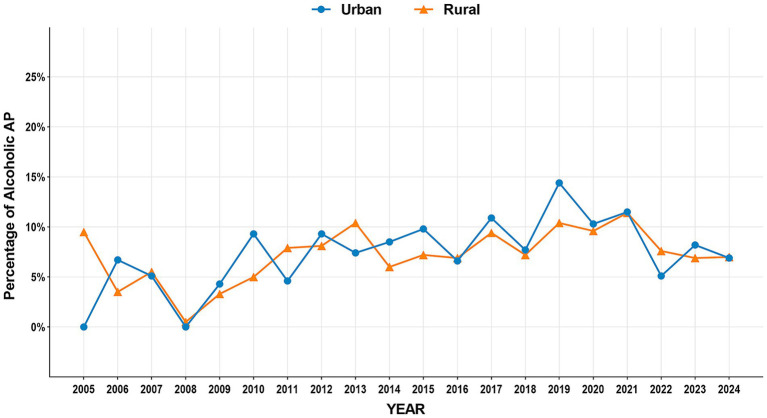 Figure 5
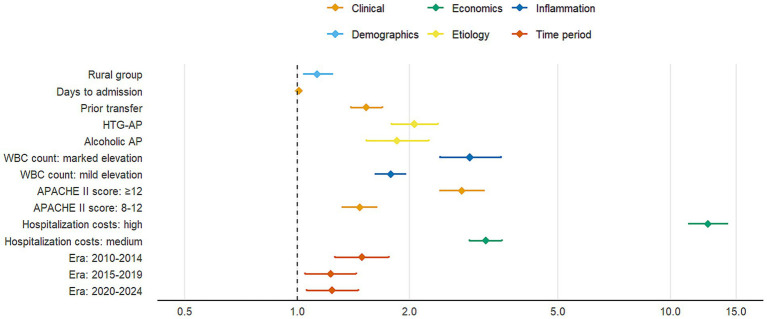 Figure 6
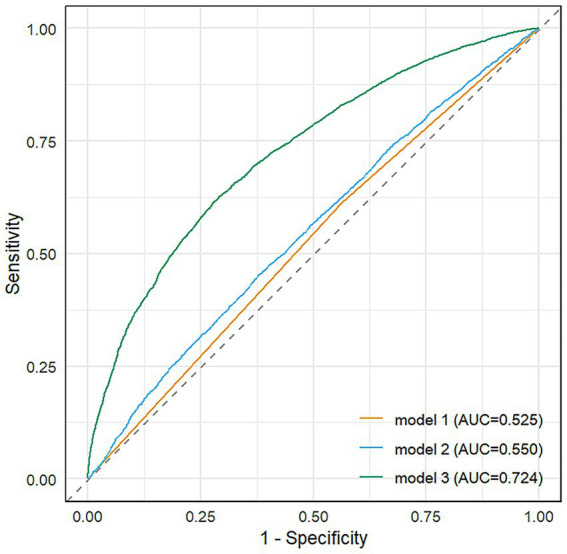 Figure 7
| Variable | Total ( | Urban ( | Rural ( | |
|---|---|---|---|---|
| Gender, | <0.001 | |||
| Male | 7,284 (59.6) | 3,182 (63.6) | 4,102 (56.9) | |
| Female | 4,930 (40.4) | 1,820 (36.4) | 3,110 (43.1) | |
| Age, [IQR], (y) | 51.00 [40.00, 64.00] | 50.00 [39.00, 63.00] | 52.00 [40.00, 64.00] | 0.002 |
| Smoking, | 3,221 (26.4) | 1,351 (27.0) | 1,870 (25.9) | 0.19 |
| Alcohol consumption, n (%) | 3,315 (27.1) | 1,423 (28.4) | 1,892 (26.2) | 0.007 |
| Comorbidities, | ||||
| Hypertension | 2,347 (19.2) | 1,022 (20.4) | 1,325 (18.4) | 0.005 |
| Diabetes mellitus | 1,282 (10.5) | 568 (11.4) | 714 (9.9) | 0.011 |
| Hyperlipidemia | 892 (7.3) | 403 (8.1) | 489 (6.8) | 0.009 |
| COPD | 114 (0.9) | 47 (0.9) | 67 (0.9) | 1 |
| Coronary heart disease | 127 (1.0) | 58 (1.2) | 69 (1.0) | 0.319 |
| Cirrhosis | 39 (0.3) | 18 (0.4) | 21 (0.3) | 0.618 |
| Cerebral infarction | 184 (1.5) | 78 (1.6) | 106 (1.5) | 0.746 |
| Chronic renal failure | 47 (0.4) | 14 (0.3) | 33 (0.5) | 0.158 |
| Clinical characteristics | ||||
| Prior transfer, | <0.001 | |||
| Yes | 8,643 (70.8) | 3,202 (64.0) | 5,441 (75.4) | |
| No | 3,571 (29.2) | 1,800 (36.0) | 1,771 (24.6) | |
| Fever on admission, [IQR] (°C) | 36.85 [0.85] | 36.90 [0.90] | 36.80 [0.80] | 0.058 |
| Days to admission, [IQR] | 3.00 [1.00, 6.00] | 2.00 [1.00, 5.00] | 3.00 [1.00, 6.00] | <0.001 |
| WBC [IQR] (×10⁹/L) | 11.54 [8.00, 15.22] | 11.59 [8.10, 15.00] | 11.50 [8.00, 15.42] | 0.93 |
| AMY [IQR] (U/L) | 212.00 [76.00, 684.78] | 223.90 [76.08, 736.38] | 203.95 [76.00, 649.00] | 0.005 |
| APACHE II score, [IQR] | 8.00 [5.00, 11.00] | 7.00 [4.00, 11.00] | 8.00 [5.00, 11.00] | <0.001 |
| Disease severity, | <0.001 | |||
| MAP | 5,536 (45.3) | 2,421 (48.4) | 3,115 (43.2) | |
| MSAP | 4,268 (34.9) | 1,665 (33.3) | 2,603 (36.1) | |
| SAP | 2,410 (19.7) | 916 (18.3) | 1,494 (20.7) | |
| Hospital stays, [IQR] (days) | 8.00 [6.00, 14.00] | 8.00 [6.00, 13.00] | 9.00 [6.00, 14.00] | 0.059 |
| ICU stay, mean ± SD (days) | 2.56 ± 0.070 | 2.44 ± 0.108 | 2.64 ± 0.093 | 0.012 |
| Hospitalization costs, [IQR] (CNY) | 17,199.67 [9,232.59, 34,380.93] | 15,753.47 [8,585.58, 32,420.09] | 18,369.00 [9,668.40, 35,632.40] | <0.001 |
| Mortality, | 235 (1.9) | 84 (1.7) | 151 (2.1) | 0.116 |
| Time period, | <0.001 | |||
| 2005–2009 | 1,299 (10.6) | 676 (13.5) | 623 (8.6) | |
| 2010–2014 | 2,182 (17.9) | 904 (18.1) | 1,278 (17.1) | |
| 2015–2019 | 3,967 (32.5) | 1,332 (26.6) | 2,635 (36.5) | |
| 2020–2024 | 4,766 (39) | 2090 (41.8) | 2,676 (37.1) | |
| Complication | Total ( | Urban ( | Rural ( | |
|---|---|---|---|---|
| Acute respiratory failure, | 2, 014 (16.5) | 794 (15.9) | 1, 220 (16.9) | 0.133 |
| Acute kidney failure, | 640 (5.2) | 255 (5.1) | 385 (5.3) | 0.586 |
| Circulatory failure, | 410 (3.4) | 145 (2.9) | 265 (3.7) | 0.022 |
| Septic shock, | 175 (1.4) | 61 (1.2) | 114 (1.6) | 0.115 |
| Heart failure, | 40 (0.3) | 21 (0.4) | 19 (0.3) | 0.185 |
| Liver dysfunction, | 769 (6.3) | 305 (6.1) | 464 (6.4) | 0.475 |
| Abdominal compartment syndrome, | 181 (1.5) | 57 (1.1) | 124 (1.7) | 0.011 |
| Portal/splenic/mesenteric vein thrombosis, | 134 (1.1) | 52 (1.0) | 82 (1.1) | 0.675 |
| Deep vein thrombosis of the lower limbs, | 39 (0.3) | 16 (0.3) | 23 (0.3) | 1 |
| Intestinal fistula, | 87 (0.7) | 33 (0.7) | 54 (0.7) | 0.641 |
| Infected necrotizing pancreatitis, | 594 (4.9) | 214 (4.3) | 380 (5.3) | 0.014 |
| Etiology | Total ( | Urban ( | Rural ( | |
|---|---|---|---|---|
| Biliary, | 6,654 (54.5) | 2, 588 (51.7) | 4, 066 (56.4) | <0.001 |
| HTG, | 3,430 (28.1) | 1, 533 (30.6) | 1, 897 (26.3) | <0.001 |
| Alcoholic, | 952 (7.8) | 398 (8.0) | 554 (7.7) | 0.601 |
| Idiopathic, | 909 (7.4) | 409 (8.2) | 500 (6.9) | 0.01 |
| Drug-induced, | 30 (0.2) | 5 (0.1) | 25 (0.3) | 0.012 |
| Post-surgical#, | 29 (0.2) | 8 (0.2) | 21 (0.3) | 0.202 |
| Traumatic, | 43 (0.4) | 17 (0.3) | 26 (0.4) | 0.973 |
| Post-ERCP, | 62 (0.5) | 34 (0.7) | 28 (0.4) | 0.036 |
| Autoimmunity, | 36 (0.3) | 14 (0.3) | 22 (0.3) | 0.934 |
| Parapapillary diverticulum of duodenum, | 40 (0.3) | 19 (0.4) | 21 (0.3) | 0.495 |
| Other causes*, | 509 (4.2) | 203 (4.1) | 306 (4.2) | 0.616 |
| Variable | Model 1 | Model 2 | Model 3 | Reference | |||
|---|---|---|---|---|---|---|---|
| OR (95% CI) | aOR (95% CI) | aOR (95% CI) | |||||
| Rural group | 1.23 (1.15–1.33) | <0.001 | 1.24 (1.16–1.34) | <0.001 | 1.13 (1.04–1.24) | 0.005 | Urban group |
| Female gender | – | – | 1.00 (0.92–1.09) | 0.95 | 1.01 (0.93–1.00) | 0.91 | Male |
| Age (per 10 years) | – | – | 1.01 (0.99–1.04) | 0.26 | 0.97 (0.93–1.00) | 0.049 | – |
| Smoking | – | – | 1.02 (0.92–1.12) | 0.76 | 0.96 (0.85–1.09) | 0.54 | Non-smoker |
| Alcohol consumption | – | – | 1.40 (1.27–1.55) | <0.001 | 1.01 (0.97–1.25) | 0.12 | Non-drinker |
| Etiology | |||||||
| Biliary AP | – | – | – | – | 1.05 (0.933–1.169) | 0.45 | No |
| HTG-AP | – | – | – | – | 2.06 (1.79–2.38) | <0.001 | No |
| Alcoholic AP | – | – | – | – | 1.93 (1.624–2.351) | <0.001 | No |
| Clinical features | |||||||
| Prior transfer | – | – | – | – | 1.53 (1.39–1.69) | <0.001 | Non-transfer |
| Days to admission | – | – | – | – | 1.01 (1.01–1.02) | <0.001 | – |
| WBC count | |||||||
| Mild elevation | – | – | – | – | 1.78 (1.62–1.95) | <0.001 | Normal |
| Marked elevation | – | – | – | – | 2.9 (2.41–3.51) | <0.001 | Normal |
| APACHE II score | |||||||
| 8–12 | – | – | – | – | 1.47 (1.32–1.63) | <0.001 | <8 |
| ≥12 | – | – | – | – | 2.76 (2.41–3.16) | <0.001 | <8 |
| Hospitalization costs | |||||||
| Medium | – | – | – | – | 3.20 (2.89–3.54) | <0.001 | low |
| High | – | – | – | – | 12.6(11.2–14.2) | <0.001 | low |
| Time period | |||||||
| 2010–2014 | – | – | – | – | 1.49 (1.26–1.76) | <0.001 | 2005–2009 |
| 2015–2019 | – | – | – | – | 1.23 (1.05–1.44) | 0.011 | 2005–2009 |
| 2020–2024 | – | – | – | – | 1.24 (1.06–1.46) | 0.008 | 2005–2009 |
Peer Reviews
No public reviews on file for this paper yet. If you reviewed it on a platform where reviews are public (OpenReview, ICLR, NeurIPS, ICML), you can paste yours below so the community can read it here.
Videos
No videos yet. Explain this paper in a talk, walkthrough, or lecture? Add one.
Taxonomy
TopicsPancreatitis Pathology and Treatment · Pancreatic and Hepatic Oncology Research · Pediatric Hepatobiliary Diseases and Treatments
Introduction
1
Acute pancreatitis (AP) is one of the most common critical illnesses in the digestive system, with a global annual incidence of approximately 34 per 100,000 population (1), showing an increasing trend year by year. AP has a complex etiology with highly variable clinical outcomes. Approximately 20% of patients may progress to severe acute pancreatitis (SAP), a condition associated with multiple organ failure and mortality rates reaching 30% (2, 3). In recent years, with changes in dietary patterns and the rising prevalence of metabolic diseases, the etiological spectrum of AP has undergone significant shifts. In China, hypertriglyceridemia (HTG) has nearly surpassed or even exceeded alcohol consumption as the second most common cause of AP, following biliary etiology (4–6). However, the epidemiological characteristics and clinical outcomes of AP exhibit notable regional heterogeneity, particularly between urban and rural areas with significant disparities in healthcare resource allocation and lifestyle (7). Previous studies have suggested that the etiology, severity, and clinical outcomes of AP may be influenced by multiple factors, including demographic characteristics, underlying diseases, laboratory findings, healthcare accessibility, and health behaviors (1, 2, 8–10).
Against the backdrop of rapid urbanization in China, systematic differences exist between urban and rural residents in dietary patterns (e.g., carbohydrate-dominant diets in rural areas vs. high-fat diets in urban areas), health behaviors (e.g., alcohol consumption, physical activity levels), and healthcare accessibility (e.g., primary care capacity, referral efficiency) (11, 12). The role of urban–rural disparities in the epidemiological features and clinical outcomes of AP has attracted considerable attention. Significant differences in dietary habits, lifestyle, and healthcare resource distribution between urban and rural populations may influence the occurrence and prognosis of AP (12–14). For instance, high-fat diets and alcohol intake are major risk factors for AP, and these factors are more prevalent among urban residents (15, 16). However, rural patients may face challenges such as insufficient medical resources and delayed treatment, which could adversely affect disease management and therapeutic outcomes (17).
This study, based on a prospectively maintained large-sample AP database, presents the first longitudinal comparison over 20 years of demographic characteristics, etiological composition, and clinical outcomes between urban and rural hospitalized AP patients, aiming to provide evidence for optimizing region-specific diagnostic and therapeutic strategies.
Materials and methods
2
Data source
2.1
This study was a retrospective single-center cohort study utilizing data from a prospectively maintained AP inpatient database at the First Affiliated Hospital of Nanchang University. The database was established by trained clinicians through structured electronic medical record (EMR) extraction and independently verified by two researchers to ensure data accuracy and completeness. It encompasses comprehensive information, including demographic characteristics, laboratory findings, radiological reports, AP scoring systems (e.g., APACHE II, BISAP), clinical features, and discharge outcomes. All methods were performed in accordance with the relevant guidelines and regulations, and in compliance with the Declaration of Helsinki. The study was approved by the Medical Ethics Research Committee of the First Affiliated Hospital of Nanchang University.
Study population
2.2
A total of 16,550 patients discharged with a diagnosis of acute pancreatitis (AP) from the First Affiliated Hospital of Nanchang University between January 2005 and December 2024 were initially identified. Hospital admission data for patients with AP were retrieved using the International Classification of Diseases, 10th Revision (ICD-10) codes K85-K85.92. AP diagnosis and severity classification followed the 2012 revised Atlanta criteria (18). Exclusion criteria included: (1): non-index admission for AP (prior AP hospitalization), (2), suspected AP cases, (3) age <18 years, (4) pregnancy, (5) undetermined urban–rural residency, and (6) missing critical laboratory parameters. After screening, 12,214 eligible AP patients were enrolled and stratified into urban (n = 5,002) and rural (n = 7,212) groups based on residential status. Figure 1 depicts the participant selection procedure.
Flow chart of the patient selection process.
Urban–rural classification
2.3
Patients were stratified into urban or rural groups based on residential duration and geographical criteria: urban residency was defined as permanent residence (≥6 months/year) in prefecture-level cities or municipal districts, while rural residency encompassed townships or administrative villages. Residential data were extracted from hospitalization records, which mandated patients to report detailed addresses and contact information. For migrant populations, classification prioritized actual residential address over household registration (e.g., rural-registered individuals residing long-term in urban areas were categorized as urban). Additionally, health insurance type (urban employee/resident insurance vs. new rural cooperative medical scheme) and occupation (agricultural vs. non-agricultural) were used as secondary reference criteria. Cases with indeterminate residency (e.g., temporary migrant workers lacking fixed addresses) were excluded to minimize misclassification bias. This approach ensured alignment between residential exposure and epidemiological risk profiles.
Data extraction
2.4
Data collection encompassed five domains: (1) Demographics—age, gender, residential status, smoking, and alcohol consumption; (2) Baseline disease characteristics—subclassified into etiology (biliary, HTG, alcoholic, idiopathic, drug-induced, post-surgical, traumatic, post-ERCP, autoimmune, parapapillary diverticulum of duodenum, or other), severity (mild, moderately severe, or severe AP per revised Atlanta criteria), comorbidities (hypertension, diabetes mellitus, hyperlipidemia, chronic obstructive pulmonary disease [COPD], coronary heart disease, cirrhosis, cerebral infarction, chronic renal failure), and admission clinical status (fever on admission, APACHE II score within 24 h); (3) Treatment process—including healthcare access (prior hospital transfer) and time metrics (symptom-to-admission interval); (4) Laboratory parameters—white blood cell count (×10^9^/L) and serum amylase (U/L); (5) Clinical outcomes—stratified into short-term outcomes (in-hospital mortality, total hospital stay, ICU stay, hospitalization costs) and complications (local: infected pancreatic necrosis, abdominal compartment syndrome, enteric fistula; systemic: acute respiratory failure, acute kidney injury, circulatory failure, septic shock, heart failure, hepatic dysfunction; thrombotic: portosplenomesenteric venous thrombosis, deep vein thrombosis). This classification aligns with acute pancreatitis research frameworks, ensuring logical separation of intrinsic disease attributes from care-related factors.
Statistical analysis
2.5
All statistical analyses were performed using R software (version 4.4.1). Missing data were handled using multiple imputation with chained equations (MICE), generating 20 imputed datasets based on all analysis variables. Continuous variables were evaluated for normality using Shapiro–Wilk tests and presented as mean ± standard deviation (SD) for normally distributed data or median (interquartile range, IQR) for non-normally distributed data. Categorical variables were expressed as frequencies (percentages). Group comparisons were conducted using independent t-tests (for normally distributed continuous variables), Mann–Whitney U tests (for non-normally distributed continuous variables), or chi-square/Fisher’s exact tests (for categorical variables), as appropriate.
Continuous variables that violated linearity assumptions were categorized into clinically meaningful groups: hospitalization costs (≤11,250, 11,251-26,270, >26,270 Yuan), APACHE II scores (<8, 8–12, ≥12), and white blood cell counts (≤10, 10.1–20, >20 × 10^9^/L). Multivariable logistic regression models were developed to identify risk factors, incorporating variables with p < 0.1 in univariate analysis or clinical significance (Supplementary Table 1). Multicollinearity was assessed using variance inflation factors (VIF < 5 for all retained variables). Model performance was evaluated by calculating area under the receiver operating characteristic curve (AUC). Temporal trends were analyzed using 5-year intervals (2005–2009 to 2020–2024). Results were presented as adjusted odds ratios with 95% confidence intervals and visualized in forest plots. All tests were two-tailed with p < 0.05 considered statistically significant.
Results
3
Demographic and clinical characteristics
3.1
This study enrolled 12,214 acute pancreatitis patients, comprising 5,002 urban cases (40.9%) and 7,212 rural cases (59.1%). Comparative analysis revealed urban group had significantly higher proportions of males, younger age, greater alcohol, and higher prevalence of hypertension, diabetes, and hyperlipidemia (all p < 0.05). Rural patients demonstrated significantly higher rates of prior hospital transfer, longer symptom-to-admission intervals, elevated APACHE II scores, and greater severe acute pancreatitis incidence (all p < 0.01). While rural patients incurred higher hospitalization costs, no significant differences existed in length of stay or mortality. Temporal trends showed rural case proportions increased markedly post-2015 (rising from 8.6% in 2005–2009 to 36.5% in 2015–2019), whereas urban cases peaked during 2020–2024. Baseline clinical characteristics of the two groups are detailed in Table 1.
Systemic complications
3.2
As shown in Table 2, acute respiratory failure and acute kidney injury were the most common systemic complications overall, with no significant urban–rural differences (both p > 0.05). Notably, rural patients exhibited significantly higher rates of circulatory failure (3.7% vs. 2.9%, p = 0.022), abdominal compartment syndrome (1.7% vs. 1.1%, p = 0.011), and infected pancreatic necrosis (5.3% vs. 4.3%, p = 0.014). In contrast, other complications including septic shock, heart failure, and thrombotic events showed no statistically significant intergroup differences.
Etiology of AP
3.3
As shown in Table 3, biliary, HTG, and alcoholic etiologies constituted the top three causes of AP in both urban and rural populations. Biliary AP was the most prevalent (54.5%), with significantly higher incidence in rural patients (56.4% vs. 51.7%, p < 0.001). HTG-AP accounted for 28.1% of cases, demonstrating a higher proportion in urban areas (30.6% vs. 26.3%, p < 0.001). No significant urban–rural difference was observed in alcoholic AP, while idiopathic AP was more common in urban patients (8.2% vs. 6.9%, p = 0.010). Notably, statistically significant disparities were identified in drug-induced AP and post-ERCP AP between the two groups. Other etiologies (e.g., traumatic, autoimmune, and periampullary diverticulum-associated AP showed no significant intergroup differences).
Temporal trends in the three major etiologies of AP (2005–2024)
3.4
The study period witnessed significant epidemiological shifts in AP etiology (Figure 2). Biliary AP demonstrated a consistent downward trend (51.4% → 41.3%), with rural areas maintaining higher prevalence than urban areas (2024, 43.2% vs. 39.0%) (Figure 3). In contrast, HTG-AP showed remarkable growth (21.6% → 42.4%), surpassing biliary AP as the leading etiology in 2023 (43.0%). The urban group consistently demonstrated higher proportions than the rural group in most years, with both groups exhibiting a steep surge in growth rates since 2020 (Figure 4). Alcoholic AP displayed fluctuating proportions (3.6–11.6%) with diminishing urban–rural disparities (Figure 5). Importantly, the urban–rural gaps for HTG-AP and biliary AP narrowed substantially from 7.9 to 5.3% and 9.9 to 4.2%, respectively, suggesting converging epidemiological patterns.
Annual variation in major etiologies of acute pancreatitis (2005–2024).
Annual proportion changes of biliary acute pancreatitis cases: Urban vs. Rural Groups.
Annual proportion changes of hypertriglyceridemic acute pancreatitis cases: Urban vs. Rural Groups.
Annual proportion changes of alcoholic acute pancreatitis cases: urban vs. rural groups.
Multivariable logistic regression analysis of factors associated with moderate-to-severe AP
3.5
Multivariable logistic regression analysis identified significant risk factors for moderate-to-severe AP (Table 4). As shown in the fully adjusted model (Model 3), rural group was significantly associated with increased disease severity (adjusted OR = 1.13, 95% CI: 1.04–1.24, p = 0.005) compared with urban residence. Hypertriglyceridemia-induced AP (HTG-AP) demonstrated the strongest association (aOR = 2.06, 95% CI: 1.79–2.38, p < 0.001), followed by alcoholic etiology. Clinical predictors including prior hospital transfer, delayed admission, elevated white blood cell count, and higher APACHE II scores were all significantly associated with increased disease severity (all p < 0.001). Notably, patients with APACHE II scores ≥12 had 2.76-fold higher risk of severe outcomes (p < 0.001). Higher hospitalization costs were strongly correlated with disease severity (aOR = 12.6, p < 0.001), likely reflecting the more intensive treatment required for severe cases. Compared with the 2005–2009 baseline period, subsequent years showed elevated risks of severe AP.
The forest plot (Figure 6) displays adjusted odds ratios with 95% confidence intervals for all variables showing statistically significant associations with disease severity (p < 0.05), organized by clinical domains. The final multivariable model (Model 3) demonstrated good discriminative capacity (AUC = 0.724; Figure 7), representing a 39.8% relative improvement over the crude model (Model 1 AUC = 0.525).
Forest plot of significant risk factors for moderate-to-severe acute pancreatitis.
Receiver operating characteristic (ROC) curves of three prediction models.
Discussion
4
This study, based on 20-year inpatient data from a single tertiary center, reveals distinct etiological, clinical, and prognostic differences between urban and rural AP patients in the region. Despite limitations in generalizability inherent to single-center data, the large sample size and extended observational period provide valuable insights into regional urban–rural healthcare disparities.
Both urban and rural populations showed similar etiological shifts in AP, characterized by decreasing biliary cases and significantly increasing HTG-AP incidence. These findings are consistent with our prior collaborative research conducted with the North China Pancreatic Center (19). HTG-AP has emerged as the second leading etiology after gallstone disease (5, 6), with its incidence persistently increasing over the past 7 years, demonstrating notable seasonality and holiday-related peaks (20). The persistently higher prevalence of biliary AP in rural patients (56.4% vs. 51.7%) may reflect insufficient screening for biliary stones and delayed health awareness despite increasing high-fat dietary intake (21, 22). Meanwhile, the narrowing urban–rural gap in HTG-AP (from 7.9 to 5.3%) highlights emerging challenges in managing metabolic risk factors in rural areas. Additionally, the higher incidence of drug-induced AP in urban patients (0.3% vs. 0.1%) may correlate with more frequent use of medications such as antineoplastic and antibiotics (23, 24), warranting enhanced clinical vigilance in pharmacotherapy.
Despite comparable mortality rates, rural patients exhibited delayed symptom-to-admission intervals (3 vs. 2 days), higher prior hospital transfer rates (75.4% vs. 64.0%), and elevated APACHE II scores (8 vs. 7), suggesting deficiencies in early AP recognition and initial management at primary care facilities (25). Multivariable analysis revealed that rural residence may be associated with an increased risk for moderate-to-severe AP (adjusted OR = 1.13, 95% CI: 1.04–1.24), likely attributable to delays in referral and insufficient prehospital emergency resources (26, 27). Notably, rural patients had higher rates of infected pancreatic necrosis (5.3% vs. 4.3%) and abdominal compartment syndrome (1.7% vs. 1.1%), potentially linked to delayed standardized fluid resuscitation and antibiotic administration (3, 28), underscoring the need to optimize acute-phase management in hierarchical healthcare systems.
Temporal trends showed a marked rise in rural AP cases after 2015 (8.6% → 36.5%), likely driven by expanded reimbursement coverage under the New Rural Cooperative Medical Scheme and improved referral practices (29, 30). The peak severity risk during 2010–2014 (aOR = 2.23) and subsequent decline to 2020–2024 (aOR = 1.75) may reflect the dissemination of AP management guidelines and minimally invasive techniques (3, 31). However, the post-2020 surge in HTG-AP across both populations raises concerns about COVID-19-related lifestyle changes (e.g., reduced physical activity, dietary shifts) accelerating metabolic pancreatitis (32, 33), a hypothesis requiring multicenter validation.
While this study benefits from its large sample and longitudinal design, limitations persist. First, as a single-center retrospective study, selection bias may distort the true urban–rural AP distribution in the general population. Second, reliance on tertiary hospital data may overestimate disease severity, particularly for rural cases due to referral bias. Third, the lack of prehospital management details and socioeconomic factors (e.g., insurance types, income) limits mechanistic exploration. Future multicenter studies incorporating primary care data and community-based surveys are needed to clarify sociodemographic determinants of urban–rural disparities and inform targeted prevention strategies.
Conclusion
5
In conclusion, our study reveals that rural patients exhibit a higher prevalence of gallstone-related AP, delayed hospital visits, and more severe clinical conditions, while HTG-AP shows a rapid upward trend in both urban and rural areas, potentially linked to dietary changes. Although rural patients demonstrate higher referral rates and complication risks, recent improvements in medical care have reduced their severe AP incidence. These findings underscore the necessity to enhance primary healthcare systems and implement targeted prevention strategies.
The reference list from the paper itself. Each links out to its DOI / PubMed record.
- 1Petrov MS Yadav D. Global epidemiology and holistic prevention of pancreatitis. Nat Rev Gastroenterol Hepatol. (2019) 16:175–84. doi: 10.1038/s 41575-018-0087-5, PMID: 30482911 PMC 6597260 · doi ↗ · pubmed ↗
- 2Garg PK Singh VP. Organ failure due to systemic injury in acute pancreatitis. Gastroenterology. (2019) 156:2008–23. doi: 10.1053/j.gastro.2018.12.041, PMID: 30768987 PMC 6486861 · doi ↗ · pubmed ↗
- 3Trikudanathan G Yazici C Evans Phillips A Forsmark CE. Diagnosis and Management of Acute Pancreatitis. Gastroenterology. (2024) 167:673–88. doi: 10.1053/j.gastro.2024.02.052, PMID: 38759844 · doi ↗ · pubmed ↗
- 4Chinese General Practice. Expert consensus on diagnosis and treatment of hypertriglyceridemic acute pancreatitis in emergency medicine. Chin Gen Pract. (2021) 24:3781–93. doi: 10.12114/j.issn.1007-9572.2021.02.028 · doi ↗
- 5Zhang NZH Guo X Liu L. Meta-analysis of the etiological changes of acute pancreatitis in China over the past decade. Chin J Dig Dis Imaging (Electron Ed). (2016) 6:71–5. doi: 10.3877/cma.j.issn.2095-2015.2016.02.006 · doi ↗
- 6Zhu Y Pan X Zeng H He W Xia L Liu P. A study on the etiology, severity, and mortality of 3260 patients with acute pancreatitis according to the revised Atlanta classification in Jiangxi, China over an 8-year period. Pancreas. (2017) 46:504–9. doi: 10.1097/mpa.0000000000000776, PMID: 28196012 · doi ↗ · pubmed ↗
- 7Iannuzzi JP King JA Leong JH Quan J Windsor JW Tanyingoh D. Global incidence of acute pancreatitis is increasing over time: a systematic review and meta-analysis. Gastroenterology. (2022) 162:122–34. doi: 10.1053/j.gastro.2021.09.043, PMID: 34571026 · doi ↗ · pubmed ↗
- 8Lankisch PG Apte M Banks PA. Acute pancreatitis. Lancet. (2015) 386:85–96. doi: 10.1016/s 0140-6736(14)60649-8, PMID: 25616312 · doi ↗ · pubmed ↗