Correction to “Comprehensively Analysis of Splicing Factors to Construct Prognosis Prediction Classifier in Prostate Cancer”

Abstract
Genes, proteins, chemicals, diseases, species, mutations and cell lines named across the full text — each resolved to its canonical identifier and authoritative record.
Click any figure to enlarge with its caption.
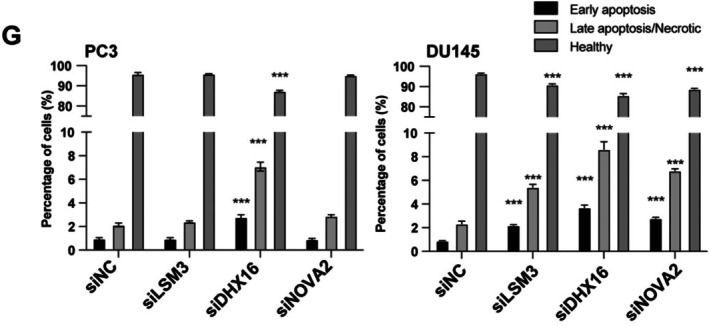 Figure 1
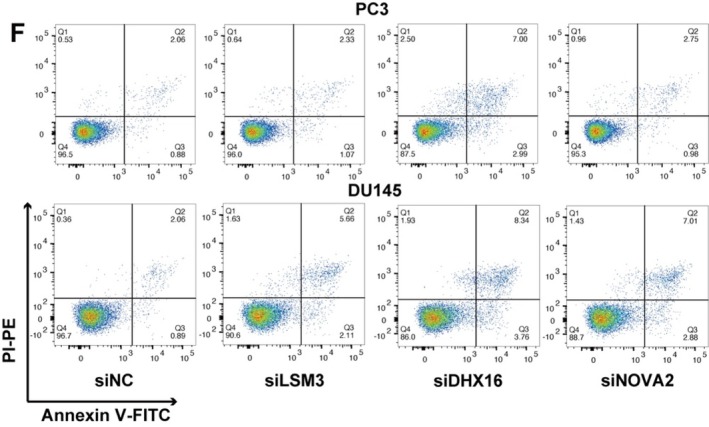 Figure 2
Peer Reviews
No public reviews on file for this paper yet. If you reviewed it on a platform where reviews are public (OpenReview, ICLR, NeurIPS, ICML), you can paste yours below so the community can read it here.
Videos
No videos yet. Explain this paper in a talk, walkthrough, or lecture? Add one.
Taxonomy
TopicsMolecular Biology Techniques and Applications · Radiomics and Machine Learning in Medical Imaging · Cancer-related molecular mechanisms research
H. Zhang, J. Tian, S. Ren, B. Han, R. Tian, X. Zuo, H. Liu, Z. Wang, Y. Cui, L. Liu, H. Guo, F. Zhang, and R. Niu, “Comprehensively Analysis of Splicing Factors to Construct Prognosis Prediction Classifier in Prostate Cancer,” Journal of Cellular and Molecular Medicine 27, no. 18 (2023): 2684–2700, https://doi.org/10.1111/jcmm.17849.
Concerns were raised by a third party regarding the shape of the ROC curves (Figures 4–6) and the apoptosis measurements in Figure 8 of this article.
As stated by the authors, the observed irregularity in the curve shape results from methodological distinctions between the Kaplan–Meier (KM) and nearest neighbour estimation (NNE) approaches in the ‘survivalROC’ analysis package (R software, version 4.2.1). The selection of KM methodology was based on three considerations: (1) The results of NNE are highly dependent on the choice of span parameter; (2) KM provides reproducible results without parameter tuning requirements; and (3) KM maintains data fidelity despite producing less visually smooth curves. This methodological decision prioritises analytical precision over aesthetic considerations.
Regarding the apoptosis measurements, the main concern was that based on the data presented and the apoptosis detection kit used, it is not possible to clearly distinguish between late apoptotic and necrotic cells. The fraction of cells labelled as ‘necrotic’ in Figure 8G could be an artifact due to mechanical damage of the cell membrane and false positive cytoplasmic RNA staining by PI. Additional technical issues were identified regarding the lack of manual compensation of the FACS samples in Figure 8F, leading to incorrect live, early apoptotic, and late apoptotic cell population percentages; therefore, incorrect FACS analysis results in Figure 8F,G. Hence, the authors were asked to repeat the experiments in question to provide further clarification.
The new results confirmed the conclusions presented in section 3.8 of the published manuscript: ‘down‐regulation of both LSM3, DHX16 and NOVA2 induced cell apoptosis in DU145 cells (Figure 8F,G)’ ‘NOVA2 did not affect the apoptosis of PC3 cells, and LSM3 did not associate with the apoptosis in PC3 cells (Figure 8F,G)’, the experimental results and conclusions of the paper remain unaffected.
The corrected Figure 8F,G are as follows: