Development and validation of the VAE-NT index: a novel biomechanical parameter for distinguishing subclinical corneal abnormalities
Lanting Yang, Hui Xu, Honghu Jiang, Jingyin Zhu, Shihao Chen

TL;DR
This study developed a new biomechanical index called VAE-NT to accurately distinguish between abnormal and normal corneas, showing high accuracy and reliability.
Contribution
The VAE-NT index is a novel, reliable, and accurate biomechanical parameter for identifying subclinical corneal abnormalities.
Findings
The VAE-NT index achieved an AUC of 0.971 in the training dataset and 0.980 in the validation dataset.
The index outperformed the tomographic and biomechanical index (TBI) in both datasets.
The VAE-NT index demonstrated high sensitivity (96.23%) and specificity (94.34%) in the training dataset.
Abstract
The aim of this study is to develop an index for distinguishing between very asymmetric ectasia with normal topography (VAE-NT) eyes and normal eyes, with good performance in validity, reliability, and predictive values. In the training dataset, this single-center retrospective study involved 102 healthy eyes and 97 VAE-NT eyes. After propensity score matching (PSM), data from 53 healthy eyes and 53 VAE-NT eyes, including demographic and Corvis ST examination results, were collected. The area under the receiver operating characteristic curve (AUC), sensitivity, specificity, intraclass correlation coefficient (ICC), and positive and negative likelihood ratios were calculated for the dynamic corneal response (DCR) parameters of Corvis ST. The Technique for Order of Preference by Similarity to Ideal Solution (TOPSIS) model was used to objectively and comprehensively evaluate the Corvis ST…
Genes, proteins, chemicals, diseases, species, mutations and cell lines named across the full text — each resolved to its canonical identifier and authoritative record.
Click any figure to enlarge with its caption.
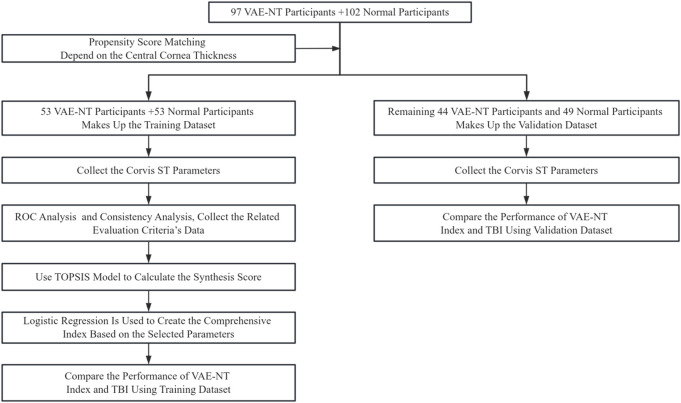 FIGURE 1
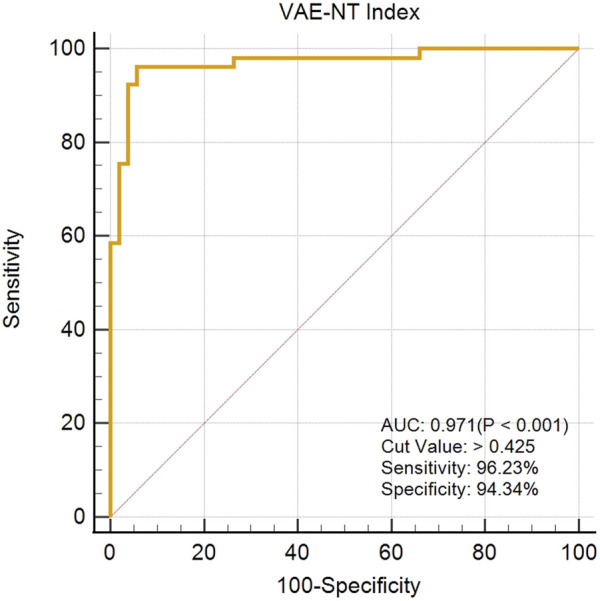 FIGURE 2
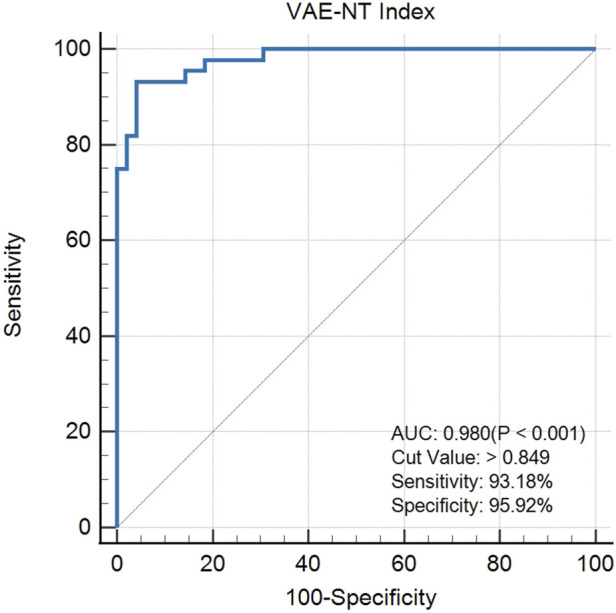 FIGURE 3
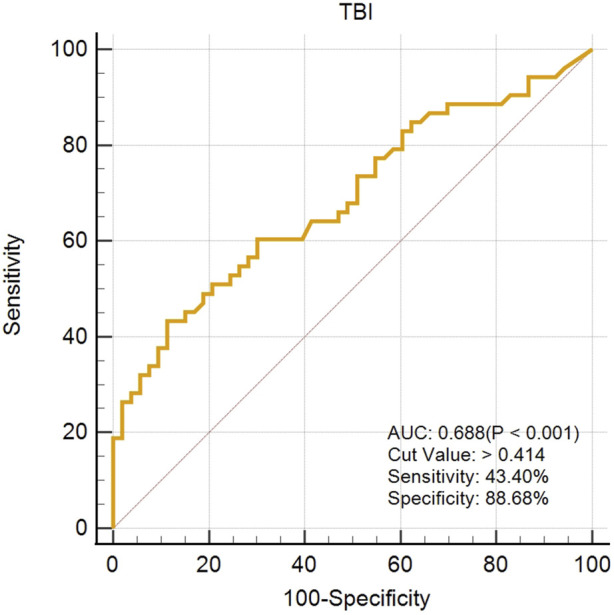 FIGURE 4
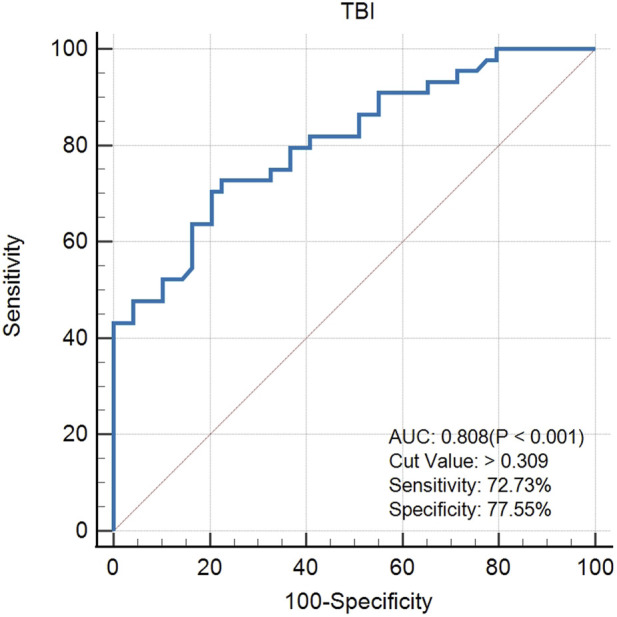 FIGURE 5
| Parameter | VAE-NT(53 eyes) | Normal (53 eyes) | Test statistic Z | χ2 | t value |
|
|---|---|---|---|---|---|---|
| Age | 18.736 ± 5.368 | 20.264 ± 3.187 | −2.077 | 0.038 | ||
| Gender | F/M = 11/42 | F/M = 16/37 | 1.242 | 0.265 | ||
| CCT | 548.148 ± 27.664 | 549.153 ± 26.904 | −0.190 | 0.850 | ||
| bIOP | 13.947 ± 2.076 | 16.124 ± 1.672 | −5.947 | <0.001 |
| Assessment | Assessment indicator | Description of the indicator |
|---|---|---|
| Validity | AUC | Area under the receiver operating characteristic curve |
| Sensitivity | Proportion of true positive tests out of all patients with a condition | |
| Specificity | Percentage of true negatives out of all subjects who do not have a disease or condition | |
| Reliability | ICC | Intraclass correlation coefficient is a measure of the correlation between individuals clustered within the same context |
| Predictive value | +LR | The probability that a positive test would be expected in a patient divided by the probability that a positive test would be expected in a patient without a disease |
| −LR | The probability of a patient testing negative who has a disease divided by the probability of a patient testing negative who does not have a disease |
| Parameter | AUC | Sensitivity | Specificity | +LR | −LR | ICC | US | NS |
|---|---|---|---|---|---|---|---|---|
| A1 Time [ms] | 0.871 | 81.130 | 92.450 | 10.750 | 0.200 | 0.826 | 0.921 | 0.062 |
| SP HC | 0.701 | 43.400 | 96.230 | 11.500 | 0.590 | 0.744 | 0.780 | 0.052 |
| SP A1 | 0.772 | 62.260 | 92.450 | 8.250 | 0.410 | 0.602 | 0.718 | 0.048 |
| DA Ratio Max (2 mm) | 0.660 | 43.400 | 94.340 | 7.670 | 0.600 | 0.796 | 0.670 | 0.045 |
| CBI | 0.710 | 52.830 | 92.450 | 7.000 | 0.510 | 0.828 | 0.667 | 0.045 |
| Integrated Radius [mm] | 0.651 | 49.060 | 86.790 | 3.710 | 0.590 | 0.800 | 0.514 | 0.034 |
| SSI2 | 0.733 | 64.150 | 77.360 | 2.830 | 0.460 | 0.812 | 0.502 | 0.034 |
| DA Ratio Max (1 mm) | 0.644 | 50.940 | 86.790 | 3.860 | 0.570 | 0.583 | 0.491 | 0.033 |
| A1 Velocity [m/s] | 0.602 | 45.280 | 86.790 | 3.430 | 0.630 | 0.737 | 0.488 | 0.033 |
| cCBI | 0.674 | 56.600 | 79.250 | 2.730 | 0.550 | 0.815 | 0.487 | 0.033 |
| HC Time [ms] | 0.728 | 60.380 | 81.130 | 3.200 | 0.490 | 0.543 | 0.475 | 0.032 |
| HC Deflection Area [mm2] | 0.647 | 54.720 | 73.580 | 2.070 | 0.620 | 0.822 | 0.459 | 0.031 |
| ARTh | 0.591 | 56.600 | 69.810 | 1.870 | 0.620 | 0.884 | 0.458 | 0.031 |
| Radius [mm] | 0.689 | 52.830 | 81.130 | 2.800 | 0.580 | 0.612 | 0.458 | 0.031 |
| PachySlope [µm] | 0.625 | 64.150 | 58.490 | 1.550 | 0.610 | 0.893 | 0.451 | 0.030 |
| Deformation Amp. Max [mm] | 0.651 | 77.360 | 47.170 | 1.460 | 0.480 | 0.829 | 0.450 | 0.030 |
| HC Deformation Amp. [mm] | 0.651 | 77.360 | 47.170 | 1.460 | 0.480 | 0.829 | 0.450 | 0.030 |
| Peak Dist. [mm] | 0.587 | 92.450 | 24.530 | 1.220 | 0.310 | 0.783 | 0.441 | 0.030 |
| Max Inverse Radius [mm^-1] | 0.679 | 77.360 | 58.490 | 1.860 | 0.390 | 0.567 | 0.437 | 0.029 |
| HC Deflection Length [mm] | 0.646 | 45.280 | 84.910 | 3.000 | 0.640 | 0.300 | 0.410 | 0.027 |
| A1 Deflection Velocity [m/s] | 0.517 | 39.620 | 79.250 | 1.910 | 0.760 | 0.455 | 0.379 | 0.025 |
| A1 Deformation Amp. [mm] | 0.559 | 35.850 | 86.790 | 2.710 | 0.740 | 0.141 | 0.368 | 0.025 |
| A1 Deflection Area [mm2] | 0.514 | 30.190 | 81.130 | 1.600 | 0.860 | 0.472 | 0.365 | 0.024 |
| dArc Length Max [mm] | 0.614 | 60.380 | 67.920 | 1.880 | 0.580 | 0.157 | 0.361 | 0.024 |
| Deflection Amp. Max [mm] | 0.614 | 37.740 | 83.020 | 2.220 | 0.750 | 0.136 | 0.353 | 0.024 |
| Deflection Amp Max [ms] | 0.543 | 86.790 | 28.300 | 1.210 | 0.470 | 0.136 | 0.351 | 0.024 |
| A1 dArc Length [mm] | 0.534 | 20.750 | 92.450 | 2.750 | 0.860 | 0.006 | 0.349 | 0.023 |
| HC Deflection Amp. [mm] | 0.631 | 45.280 | 75.470 | 1.850 | 0.730 | 0.166 | 0.346 | 0.023 |
| A1 Deflection Amp. [mm] | 0.628 | 60.380 | 66.040 | 1.780 | 0.600 | 0.014 | 0.344 | 0.023 |
| A1 Deflection Length [mm] | 0.590 | 62.260 | 60.380 | 1.570 | 0.630 | 0.104 | 0.339 | 0.023 |
| HC dArc Length [mm] | 0.572 | 49.060 | 71.700 | 1.730 | 0.710 | 0.144 | 0.339 | 0.023 |
| SSI | 0.503 | 81.130 | 5.660 | 0.860 | 3.330 | 0.578 | 0.307 | 0.021 |
| Parameter | β | S.E. | Wald | df | Sig | Exp( |
|---|---|---|---|---|---|---|
| A1 Time [ms] | −19.943 | 5.219 | 14.602 | 1 | <0.001 | 0.000 |
| SP HC | 1.594 | 0.461 | 11.982 | 1 | 0.001 | 4.925 |
| SP A1 | −0.218 | 0.060 | 13.084 | 1 | <0.001 | 0.804 |
| DA Ratio Max (2 mm) | −5.659 | 2.761 | 4.201 | 1 | 0.040 | 0.003 |
| DA Ratio Max (1 mm) | 52.669 | 21.004 | 6.288 | 1 | 0.012 | 7.477E+22 |
| SSI2 | −11.914 | 5.873 | 4.115 | 1 | 0.043 | 0.000 |
| Integrated Radius [mm] | −1.427 | 0.733 | 3.787 | 1 | 0.052 | 0.240 |
| Constant | 117.602 | 32.822 | 12.838 | 1 | <0.001 | 1.185E+51 |
| Dataset | Omnibus test of model coefficients | Hosmer and Lemeshow test | Model accuracy (%) | AUC | Sensitivity (%) | Specificity (%) | +LR | −LR | ICC |
|---|---|---|---|---|---|---|---|---|---|
| Training dataset | <0.001 | 0.272 | 95.283 | 0.971 | 96.230 | 94.340 | 17.000 | 0.040 | 0.777 |
| Validation dataset | - | - | 94.624 | 0.980 | 93.180 | 95.920 | 22.830 | 0.071 | 0.835 |
Peer Reviews
No public reviews on file for this paper yet. If you reviewed it on a platform where reviews are public (OpenReview, ICLR, NeurIPS, ICML), you can paste yours below so the community can read it here.
Videos
No videos yet. Explain this paper in a talk, walkthrough, or lecture? Add one.
Taxonomy
TopicsCorneal surgery and disorders · Glaucoma and retinal disorders · Corneal Surgery and Treatments
Introduction
Forme fruste keratoconus (FFKC), recently termed very asymmetric ectasia with normal topography (VAE-NT), is a clinically significant condition characterized by normal topography and slit-lamp examination in one eye, whereas the fellow eye shows signs of keratoconus. This atypical manifestation implies an incomplete state of the disease, in which the cornea protrudes, causing irregular astigmatism and vision impairment (Henriquez et al., 2020). Early diagnosis of FFKC is crucial as it enables patients to proactively address the condition and prevent its progression into fully developed keratoconus (KC), thereby mitigating the risk of further vision loss (Rabinowitz, 1998).
The biomechanical properties of KC play a pivotal role in understanding FFKC. KC is a corneal disorder marked by alterations in the normal collagen fibril network, frequently exhibiting asymmetry between the two eyes. It has been proposed that the progression of keratoconus is driven by a biomechanical cycle of decompensation, involving corneal thinning, increased mechanical strain, and stress redistribution, initiated by a localized reduction in corneal material properties (Ruberti et al., 2011; Roberts and Dupps, 2014). In FFKC, subtle biomechanical abnormalities are often present despite the absence of overt clinical findings. These biomechanical alterations may precede morphological changes, potentially leading to progressive corneal protrusion, irregular astigmatism, and visual impairment if left undetected. To improve diagnostic precision, the term VAE-NT has been proposed to replace the previously used designation of FFKC (Ambrósio et al., 2023; Ambrósio et al., 2017; Hwang et al., 2018). Early identification of these subtle biomechanical alterations is critical for the diagnosis of VAE-NT, enabling timely intervention to prevent progression to clinically manifest keratoconus and preserve visual function.
Corneal biomechanics have gained significant attention in recent decades, with their importance recognized in several applications, including the measurement of intraocular pressure, evaluation of ectasia risk following refractive surgeries, and assessment of the effectiveness of corneal cross-linking (CXL) treatment (Roberts and Dupps, 2014; Herber et al., 2021; Ramm et al., 2019; Girard et al., 2015; Piñero and Alcón, 2015). Several in vivo methods have been developed to assess corneal biomechanics, among which the Corvis ST (Oculus, Wetzlar, Germany) is widely used. The Corvis ST uses an ultra-fast Scheimpflug camera that captures 140 frames over 32.11 ms, allowing detailed analysis of corneal deformation in response to an air puff stimulus (Tian et al., 2014). Analysis of the resulting deformation yields several dynamic corneal response (DCR) parameters, which correlate with corneal stiffness (Xian et al., 2023; Miao et al., 2023). These metrics include the stiffness parameter at first applanation (SP-A1) (Ambrósio et al., 2017; Zhang et al., 2021a), the deflection amplitude DA, and the ratio between the deflection amplitudes at apex and 2 mm away from apex (DA Ratio Max 2 mm) (Lu et al., 2022). Additional parameters, such as Ambrósio’s relational thickness to the horizontal profile (ARTh) (Tian et al., 2021a), the Corvis biomechanical index (CBI) (Wang et al., 2017), the stress–strain index (SSI) (Zhang et al., 2021b), and the Chinese CBI (cCBI) (Zhang et al., 2024), have all demonstrated clinical utility in the diagnosis of keratoconus (Ren et al., 2021).
The evaluation criteria for diagnostic indicators are primarily based on metrics derived from receiver operating characteristic (ROC) analysis, including the area under the ROC curve (AUC), sensitivity, specificity, and positive and negative likelihood ratios (Mandrekar, 2010). Although an ideal diagnostic indicator should exhibit high performance across all metrics, in practice, some indicators may not simultaneously achieve high AUC, sensitivity, and specificity. Therefore, clinicians often rely on their clinical experience to interpret these metrics, which can further complicate the diagnostic decision-making process. In addition, the intraclass correlation coefficient (ICC) is commonly used to assess the repeatability and stability of diagnostic indicators (Muller R, 1994). Therefore, this study aims to identify diagnostic indicators that demonstrate superior performance in terms of AUC, sensitivity, specificity, and ICC.
Multi-criteria decision analysis (MCDA) is a structured methodology developed to support decision-making processes involving multiple and often conflicting evaluation criteria (Talukder et al., 2018). As described by Keeney, MCDA provides a logical and systematic framework for evaluating options based on multiple criteria (Keeney, 1982). In this study, we used the Technique for Order of Preference by Similarity to Ideal Solution (TOPSIS), which is a widely used MCDA method. Hwang and Yoon (1981) originally proposed that TOPSIS evaluates alternatives based on their geometric proximity to an ideal solution and distance from a negative ideal solution. Due to its computational simplicity and robustness, TOPSIS has become one of the most widely adopted quantitative techniques in multi-criteria decision-making. Its applicability spans various domains and relies on a well-established mathematical foundation. It has been applied for more than three decades (Hwang and Yoon, 1981; Jahanshahloo et al., 2006), with extensive validation and documentation in the scientific literature (Huang et al., 2016; Yoon and Hwang, 1995). In the TOPSIS framework, the optimal alternative is defined as the one with the shortest distance to the positive ideal solution and the greatest distance from the negative ideal solution.
In this study, the validity, reliability, and predictive performance of Corvis ST DCR parameters for identifying VAE-NT were comprehensively evaluated using the TOPSIS approach. Based on sample size requirements and TOPSIS rankings, the seven highest-performing DCR parameters were selected and integrated to construct a novel composite biomechanical index for differentiating VAE-NT from normal corneas.
Methods
The steps followed in this study are illustrated in Figure 1.
Study workflow and methodology overview.
Participants
All study participants were recruited at the Eye Hospital of Wenzhou Medical University. This single-center retrospective study initially enrolled 102 healthy eyes and 97 VAE-NT eyes. Each patient underwent a comprehensive eye examination, incorporating tests using the Pentacam and Corvis ST (Oculus Optikgeräte GmbH). The study complied with the ethical principles outlined in the Declaration of Helsinki and was approved by the Ethics Committee of the Eye Hospital of Wenzhou Medical University (ethics approval number: 2022-198-K-154).
In detecting KC, the following criteria were considered: (a) an irregular cornea, determined by distorted keratometry mires and distortion of the retinoscopic, ophthalmoscopic red reflex, or a combination of these and (b) the presence of at least one of the following biomicroscopic signs: Vogt’s striae, Fleischer’s ring of greater than 2-mm arc, or corneal scarring consistent with keratoconus (Rabinowitz, 1998; Arbelaez et al., 2012).
The criteria for very asymmetric ectasia (VAE) refer to the diagnosis of ectasia in one eye, according to previously established definitions, with the fellow eye considered clinically normal based on unremarkable corneal topography; VAE-NT eyes are the fellow eyes of these patients that have normal topography and a keratoconus percentage index (KISA%) score lower than 60, along with a paracentral inferior–superior (I–S value) asymmetry value at 6 mm (3-mm radii) of less than 1.45.
On the other hand, the inclusion criteria for healthy individuals included providing a signed informed consent form, qualification as a candidate for refractive surgery with the absence of topographic distortions (LASIK or SMILE), and having a Corvis ST assessment in the database. The exclusion criteria encompassed any prior ocular surgery or illness, myopia exceeding 10.00 diopters (D), concurrent or prior glaucoma, and the use of hypotonic treatments.
Corvis ST examinations
All DCR parameters were measured using the same Corvis ST device, and baseline values were recorded. In addition to the biomechanically corrected intraocular pressure (bIOP) and the central corneal thickness (CCT), the Corvis ST provided detailed information on corneal response to an air pulse. To eliminate inter-rater variations, the same technician, blinded to the study design, performed all the examinations. Only results with “OK” in the QS window indicating good image quality were included in the statistical analyses. The Corvis ST provided values of DCRs, including SP A1, DA Ratio Max (2 mm), ARTh, CBI, cCBI, and SSI version 2 (SSI2) (Zhang et al., 2021b). All the information regarding the included Corvis ST parameters is listed in Supplementary Table S1.
TOPSIS model
We implemented the TOPSIS model to create the VAE-NT index. This work used the TOPSIS method to build an evaluation system (Ramón-Canul et al., 2021).
In this process, positive and negative ideal solutions could be developed using Equation 1 and Equation 2, respectively:
The Euclidean distance from the ith evaluated object to the positive ideal solution is presented in Equation 3:
For each evaluation object, its Euclidean distance to the negative ideal solution is presented in Equation 4 as follows:
The closeness of the ith evaluation object to the ideal solution is described in Equation 5:
After normalization, the TOPSIS composite score could be obtained, as shown in Equation 6:
where denotes the proximity of each evaluation object to the optimal solution. 0 ≤ ≤ 1; the closer was to 1, the better the evaluation object was.
Statistical analyses
The Shapiro–Wilk test assessed the normality of continuous variables. Descriptive statistics, including mean ± standard deviation (SD), were used for value description. ROC analysis evaluated the diagnostic efficacy of Corvis ST parameters and the new index for VAE-NT diagnosis. Reliability was assessed using the ICC for averaged measurements, using a two-way random-effects model with “single rater” type and “absolute agreement” ICC definition (Koo and Li, 2016). Propensity score matching (PSM) was used to match CCT between groups, reducing confounding bias. Binary logistic regression with backward stepwise inclusion determined the optimal combination of predictors from individual Corvis ST parameters for creating the VAE-NT index. Due to the requirements for the sample size based on research design and statistical methods, the top seven parameters ranked based on TOPSIS models and AUC values were considered. MedCalc software version 12.3.0.0 (Ostend, Belgium) was used for ROC analysis in both the TOPSIS and AUC groups. R was used for PSM matching. Other statistical analyses were conducted using SPSS (version 22.0, IBM, Inc.). A significance level of 0.05 was applied.
Results
Demographic data
Initially, the study included 102 healthy eyes and 97 VAE-NT eyes. After PSM, 53 healthy eyes and 53 VAE-NT eyes were selected for further analysis in the training dataset. The remaining eyes were included in the validation dataset. Table 1a provides information on participants’ age, CCT, bIOP, and gender in the training dataset. The data for CCT in both eyes were comparable (t = −0.019; P = 0.850).
Table 1b provides information on participants’ age, CCT, bIOP, and gender in the validation dataset. The data for CCT in both eyes were significantly different (t = 15.811; P < 0.001).
Assessment criteria included in the TOPSIS model
The Corvis DCR parameters were assessed in terms of validity, reliability, and predictive values. Validity included AUC, sensitivity, and specificity, while reliability was measured using ICC. The predictive value was evaluated through + LR (positive likelihood ratio) and −LR (negative likelihood ratio). Detailed criteria for evaluation are presented in Table 2.
Corvis ST parameters ranked based on the TOPSIS evaluation and AUC scores
After the TOPSIS model analysis, the Corvis ST DCRs were ranked based on the comprehensive evaluation score (Table 3a). Additionally, the ranking according to the AUC score is presented in Table 3b. The results of the ROC analysis and ICC scores for all included Corvis ST parameters are provided in Supplementary Table S2 and Supplementary Table S3, respectively.
VAE-NT index formula
Backward stepwise logistic regression was used to analyze the top seven parameters based on the TOPSIS score, and the following formula was derived:
where Beta = B0+B1 * A1 Time + B2 * SP A1 + B3 SP HC + B4 DA Ratio Max (2 mm) +B5* DA Ratio Max (1 mm) +B6* SSI2+B7* Integrated Radius.
Moreover, B0 = 117.602, B1 = −19.943, B2 = −0.218, B3 = 1.594, B4 = −5.659, B5 = 52.669, B6 = −11.914, and B7 = −1.427. The results of logistic regression are shown in Table 4.
The regression results of the top seven parameters are based on the AUC value, and the final equation only contains A1 Time, SP HC, SP A1, and HC Time. The details are shown in Supplementary Table S4.
Assessment of the VAE-NT detection index
The created VAE-NT index was then tested for validity, reliability, and predictive value in diagnosing VAE-NT from a normal cornea. In the training dataset, the AUC value of the VAE-NT index was 0.971, with a sensitivity of 96.230%, a specificity of 94.340%, and a cutoff value of 0.425. The ICC of VAE-NT was 0.777. Detailed results are presented in Table 5a. Additionally, the AUC value of the composite index based on the AUC value was 0.958, with a sensitivity of 90.570%, a specificity of 92.450%, and a cutoff value of 0.434. Supplementary Table S5 provides detailed results. The AUC value of the tomographic and biomechanical index (TBI) was 0.688, with a sensitivity of 43.400% and a specificity of 88.680%. Detailed results are presented in Table 5b. In the validation dataset, the AUC value of the VAE-NT index was 0.980. The sensitivity and specificity of the VAE-NT index were 93.180% and 95.920%, respectively. The positive and negative likelihood ratios of VAE-NT were 22.830 and 0.071, respectively. The ICC of VAE-NT was 0.835, and the accuracy was 94.624%. Detailed results are presented in Table 5a. For TBI, the receiver operating characteristic curve analysis showed an AUC value of 0.808, with a cutoff value of 0.309, an accuracy of 76.087%, a specificity of 77.550%, and a sensitivity of 72.730%. The positive and negative likelihood ratios were 3.240 and 0.350, respectively. The ICC was 0.881. Detailed results are presented in Table 5b. The ROC curves of VAE-NT and TBI in both the training and validation datasets are shown in Figures 2–5.
ROC curve of VAE-NT in the training dataset.
ROC curve of VAE-NT in the validation dataset.
ROC curve of TBI in the training dataset.
ROC curve of TBI in the validation dataset.
Discussion
In recent years, several composite diagnostic indices have been developed to diagnose keratoconus. Vinciguerra et al. (2016) introduced the CBI to differentiate between normal and keratoconus corneas. Ambrósio et al. (2017) developed the TBI, which exhibited superior diagnostic performance. Subsequent studies have consistently confirmed their high diagnostic accuracy for keratoconus; however, their performance in detecting FFKC has been comparatively limited (Tian et al., 2021b; Asroui et al., 2022; Wallace et al., 2023; Koh et al., 2019; Ferreira-Mendes et al., 2019; Kataria et al., 2019; Song et al., 2022). Although studies have shown that these indices can achieve an AUC value greater than 0.90, there remains a need to further improve sensitivity, specificity, likelihood ratios (positive and negative), and ICCs (Zhang et al., 2020). This situation requires clinicians to consider multiple diagnostic indices simultaneously when making clinical decisions, thereby increasing the complexity and burden of diagnosis. To address this issue, we developed a novel diagnostic index, VAE-NT. The VAE-NT index demonstrated robust diagnostic performance, achieving high AUC, sensitivity, specificity, favorable likelihood ratios (positive and negative), and ICC values in both the training and validation datasets. Furthermore, compared with the TBI, the VAE-NT index exhibited superior diagnostic efficiency and predictive performance in our dataset.
The primary distinction of the VAE-NT index from previous indices lies in its parameter selection methodology, which is based on the TOPSIS model. Unlike the CBI and TBI, which rely solely on AUC-based parameter selection, the VAE-NT index incorporates a TOPSIS-based multi-criteria evaluation approach (Ambrósio et al., 2017; Vinciguerra et al., 2016). In this study, the TOPSIS model was utilized to evaluate the Corvis ST parameters in terms of validity, predictive power, and reliability. Based on this evaluation, the parameters were ranked according to their TOPSIS-normalized scores. The top seven parameters, determined by the available sample size, were then used in a binary logistic regression analysis, and the model with the optimal diagnostic performance was retained. This study represents a novel integration of the MCDA technique and statistical modeling for the comprehensive evaluation of diagnostic parameters in keratoconus detection.
Corneal thickness is a well-recognized factor influencing the diagnosis of keratoconus. It can significantly affect the diagnostic performance of parameters used to differentiate VAE-NT or KC from normal corneas. It is important to note that corneal thickness was not matched during the development of the CBI and TBI (6, 34). In the present study, the PSM method was applied to balance the distribution of central corneal thickness and other potential confounders between the normal and VAE-NT groups (Kane et al., 2020). The matching process also ensured a consistent sample size across both groups. This approach improves the reliability of the subsequent ROC analysis by meeting sample size requirements and effectively controlling for the potential confounding effects of corneal thickness on diagnostic outcomes. In the validation dataset, which exhibited significant differences in central corneal thickness, the VAE-NT index maintained superior discriminatory ability between VAE-NT and normal eyes. Recently, Ambrósio et al. (2023) introduced the TBI version 2 (TBI_V2_), which showed high diagnostic accuracy for detecting VAE-NT, with an AUC value of 0.945 (DeLong test, P < 0.0001), a sensitivity of 84.4%, and a specificity of 90.1%.
In our dataset, TBI_V2_ demonstrated slightly lower diagnostic performance than the VAE-NT index, although it remains highly effective in identifying VAE-NT. Notably, the VAE-NT index is exclusively based on Corvis ST parameters, which reflect corneal biomechanical properties, whereas TBI_V2_ integrates both biomechanical and tomographic data. These findings highlight the important contribution of biomechanical information to VAE-NT diagnosis, aligning with the well-established role of collagen disruption in keratoconus pathogenesis (Rabinowitz, 1998; Roberts and Dupps, 2014). The components of the VAE-NT index—including SP A1, SSI2, A1 Time, SP HC, DA Ratio Max (2 mm), DA Ratio Max (1 mm), and Integrated Radius—were selected based on their demonstrated effectiveness in distinguishing VAE-NT from normal corneas (Miao et al., 2023; Tian et al., 2021b; Huo et al., 2023; Zhang et al., 2022). Moreover, SP HC, DA Ratio Max (2 mm), DA Ratio Max (1 mm), and Integrated Radius have also been reported to differ significantly between normal and keratoconus corneas (Song et al., 2023).
This study has several limitations. First, the single-center design and relatively moderate sample size (n = 106) may limit the generalizability of the findings. Future studies involving larger, multi-center cohorts are warranted to validate the results. Second, the retrospective nature of data collection may introduce selection bias, highlighting the need for well-designed prospective studies. Third, although the VAE-NT index demonstrated promising diagnostic performance, its validity, reliability, and predictive values require further evaluation using independent external datasets from other clinical centers.
Conclusion
In this study, the VAE-NT index was developed to distinguish VAE-NT from normal eyes. It demonstrated high sensitivity, specificity, AUC, favorable likelihood ratios, and good reliability, indicating strong diagnostic potential. The use of the TOPSIS model enabled a comprehensive evaluation of diagnostic indicators, facilitating the selection of features with superior overall diagnostic strength and providing clinicians with a more objective decision-making reference. Further validation in larger, more diverse populations and with longer follow-ups is necessary to support clinical implementation.
The reference list from the paper itself. Each links out to its DOI / PubMed record.
- 1Ambrósio R.Lopes B. T.Faria-Correia F.Salomão M. Q.Bühren J.Roberts C. J. (2017). Integration of scheimpflug-based corneal tomography and biomechanical assessments for enhancing ectasia detection. J. Refract Surg. 33 (7), 434–443. 10.3928/1081597 x-20170426-02 28681902 · doi ↗ · pubmed ↗
- 2Ambrósio R.Machado A. P.Leão E.Lyra J. M. G.Salomão M. Q.Esporcatte L. G. P. (2023). Optimized artificial intelligence for enhanced ectasia detection using scheimpflug-based corneal tomography and biomechanical data. Am. J. Ophthalmol. 251, 126–142. 10.1016/j.ajo.2022.12.016 36549584 · doi ↗ · pubmed ↗
- 3Arbelaez M. C.Versaci F.Vestri G.Barboni P.Savini G. (2012). Use of a support vector machine for keratoconus and subclinical keratoconus detection by topographic and tomographic data. Ophthalmology 119 (11), 2231–2238. 10.1016/j.ophtha.2012.06.005 22892148 · doi ↗ · pubmed ↗
- 4Asroui L.Dagher S. A.Elsheikh A.Lopes B. T.Roberts C. J.Assouad M. (2022). Biomechanical evaluation of topographically and tomographically normal fellow eyes of patients with keratoconus. J. Refract Surg. 38 (5), 318–325. 10.3928/1081597 x-20220225-01 35536713 · doi ↗ · pubmed ↗
- 5Ferreira-Mendes J.Lopes B. T.Faria-Correia F.Salomão M. Q.Rodrigues-Barros S.Ambrósio R. (2019). Enhanced ectasia detection using corneal tomography and biomechanics. Am. J. Ophthalmol. 197, 7–16. 10.1016/j.ajo.2018.08.054 30201341 · doi ↗ · pubmed ↗
- 6Girard M. J. A.Dupps W. J.Baskaran M.Scarcelli G.Yun S. H.Quigley H. A. (2015). Translating ocular biomechanics into clinical practice: current state and future prospects. Curr. Eye Res. 40 (1), 1–18. 10.3109/02713683.2014.914543 24832392 PMC 4233020 · doi ↗ · pubmed ↗
- 7Henriquez M. A.Hadid M.Izquierdo L. (2020). A systematic review of subclinical keratoconus and forme fruste keratoconus. J. Refract Surg. 36 (4), 270–279. 10.3928/1081597 x-20200212-03 32267959 · doi ↗ · pubmed ↗
- 8Herber R.Pillunat L. E.Raiskup F. (2021). Development of a classification system based on corneal biomechanical properties using artificial intelligence predicting keratoconus severity. Eye Vis. 8 (1), 21–11. 10.1186/s 40662-021-00244-4 PMC 816794234059127 · doi ↗ · pubmed ↗