Whole genome sequencing and assembly of the house sparrow, Passer domesticus
Vikas Kumar, Gopesh Sharma, Sankalp Sharma, Samvrutha Prasad, Shailesh Desai, Toral Vaishnani, Dalia Vishnudasan, Gopinathan Maheswaran, Kaomud Tyagi, Inderjeet Tyagi, Polavarapu B Kavi Kishor, Gyaneshwer Chaubey, Prashanth Suravajhala, Prashanth Suravajhala

TL;DR
This paper presents a high-quality genome assembly for the house sparrow, which will aid in studying bird and vertebrate evolution.
Contribution
The paper provides a new annotated genome assembly for the house sparrow using advanced sequencing and assembly tools.
Findings
The genome assembly spans 922 MB with contigs totaling 268,193 bases.
The assembly shows significant similarity to the chicken and zebra finch genomes.
Functional annotations were added to enhance the genome's utility for comparative studies.
Abstract
The common house sparrow, Passer domesticus, is a small bird belonging to the family Passeridae. Here, we provide high-quality whole-genome sequencing data along with its assembly for the house sparrow. The final genome assembly was generated using a workflow that included Shovill, SPAdes, MaSuRCA, and BUSCO. The assembly consists of contigs spanning 268,193 bases and coalescing around a 922 MB sized reference genome. We used rigorous statistical thresholds to check the coverage, as the Passer genome showed considerable similarity to the Gallus gallus (chicken) and Taeniopygia guttata (Zebra finch) genomes, also providing functional annotations. This new annotated genome assembly will be a valuable resource for comparative and population genomic analyses of passerine, avian, and vertebrate evolution.
Genes, proteins, chemicals, diseases, species, mutations and cell lines named across the full text — each resolved to its canonical identifier and authoritative record.
Click any figure to enlarge with its caption.
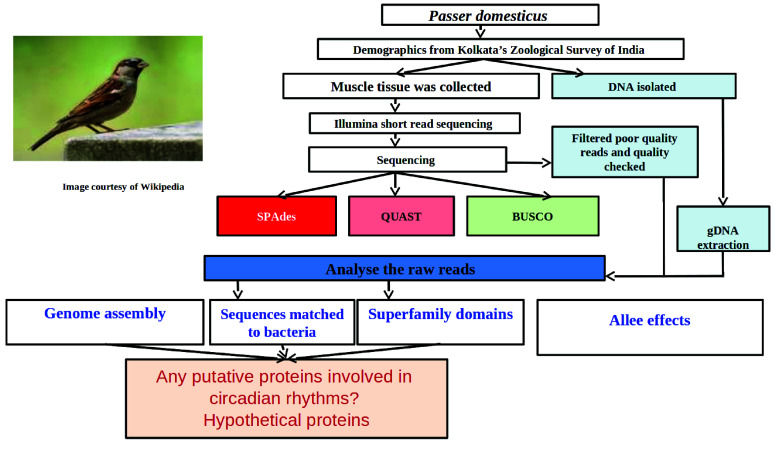 Figure 1
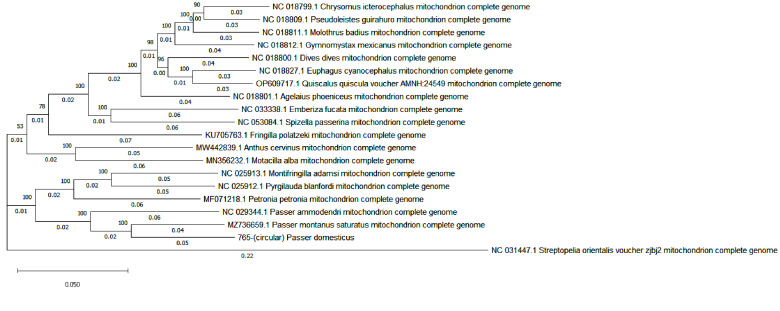 Figure 2
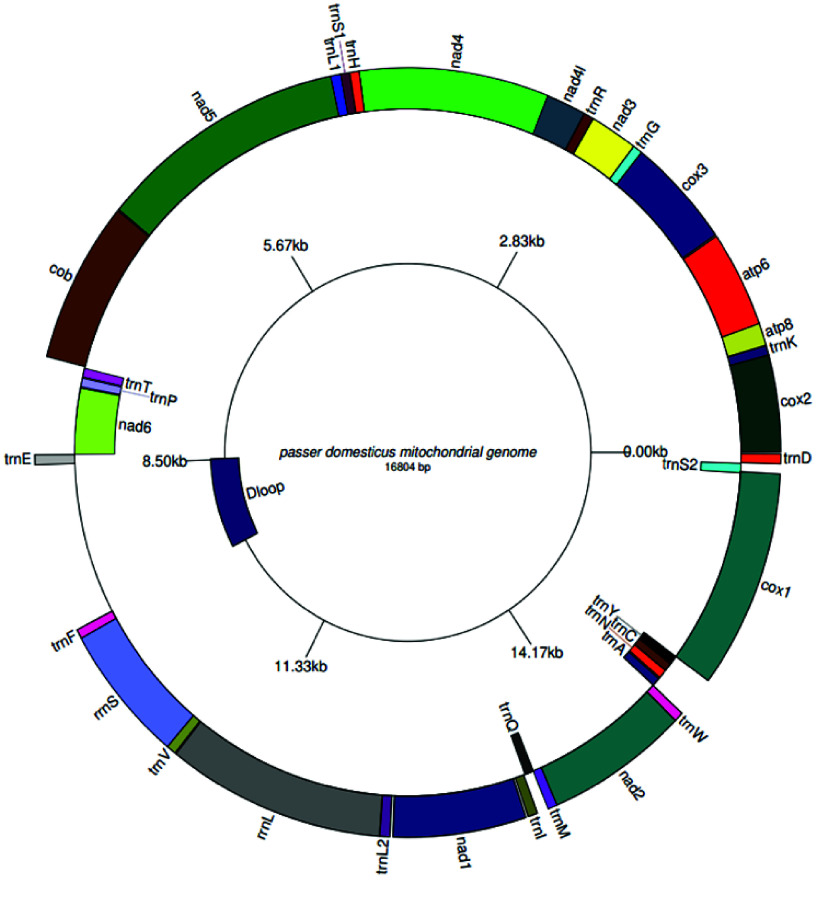 Figure 3
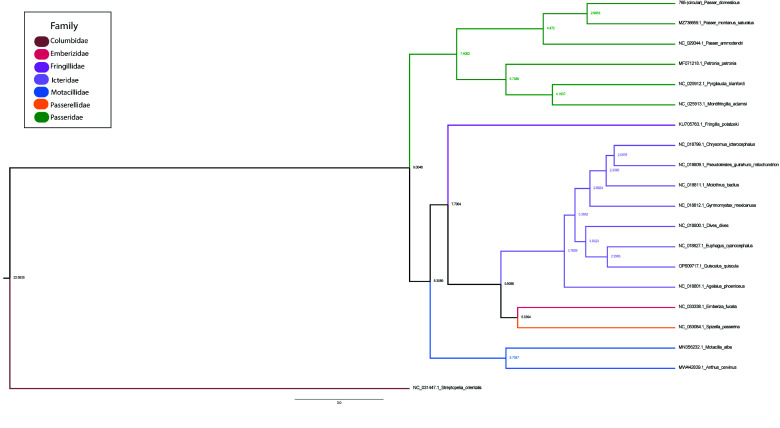 Figure 4
| Tools >>> | Megahit | SPAdes | MaSuRCA |
|---|---|---|---|
| Contigs (N) | 1,018,705 | 1,000,366 | 608,253 |
| Length | 866 MB | 922 MB | 830 MB |
| Largest contig (BP) | 83,946 | 87,277 | 78,946 |
| N50 (BP) | 1,027 | 1,343 | 740 |
| N90 (BP) | 434 | 399 | 400 |
| N’s (BP) | 0.00 | 0.00 | 0.00 |
| GC % | 41.74 | 41.93 | 41.49% |
| Sl. No. | Gene name | NCBI accession | Contigs mapped |
|---|---|---|---|
| 1 | APC | NODE_14189_length_3730_cov_2.598686 | |
| 2 | HSDL2 | NODE_20005_length_3394_cov_4.411215 | |
| 3 | ETFA | | NODE_45445_length_2642_cov_2.323977 |
| 4 | NOTCH2 | NODE_2951_length_5290_cov_3.101669 | |
| 5 | NOTCH1 | NODE_82034_length_2127_cov_3.214634 | |
| 6 | GLI3 | NODE_5580_length_4619_cov_3.460810 | |
| 7 | WNT4 | | NODE_126693_length_1756_cov_2.892198 |
| 8 | TIMP2 | | NODE_92905_length_2020_cov_2.762738 |
| 9 | RBP1 | NODE_19406_length_3423_cov_2.725344 | |
| 10 | PRK11A | NODE_48977_length_2574_cov_3.450941 | |
| 11 | GNAI1 | | NODE_5061_length_4724_cov_3.114698 |
| 12 | CRHR1 | | NODE_32621_length_2944_cov_3.164632 |
| 13 | ZFAND5 | NODE_86240_length_2083_cov_4.130608 | |
| 14 | SECISBP2 | NODE_2582_length_5428_cov_3.587927 | |
| 15 | REEP5 | NODE_48707_length_2579_cov_3.693046 | |
| 16 | MIA3 | NODE_12474_length_3848_cov_3.843543 | |
| 17 | A2M | NODE_583_length_7451_cov_3.871576 | |
| 18 | KCNN2 | NODE_16813_length_3560_cov_3.043928 | |
| 19 | BNC2 | NODE_5333_length_4668_cov_3.558048 |
| Genes | Ka/ks |
|---|---|
| cox2 | 0.81 |
| atp6 | 1.03 |
| atp8 | 0.429 |
| cox3 | 0.012 |
| nad3 | 0.02 |
| nad4l | 0.035 |
| nad5 | 0.03 |
| nad4 | 0.13 |
| cob | 0.02 |
| nad6 | 0.048 |
| nad1 | 0.034 |
| nad2 | 0.017 |
| cox1 | 0.003 |
| Codon | RSCU | Codons | RSCU | Codons | RSCU | Codons | RSCU |
|---|---|---|---|---|---|---|---|
| UUU(F) | 0.27 | UCU(S) | 0.53 | UAU(Y) | 0.44 | UGU(C) | 0.26 |
| UUC(F) | 1.73 | UCC(S) | 2.08 | UAC(Y) | 1.56 | UGC(C) | 1.74 |
| UUA(L) | 0.47 | UCA(S) | 1.83 | UAA(*) | 0.28 | UGA(*) | 2.69 |
| UUG(L) | 0.18 | UCG(S) | 0.35 | UAG(*) | 0.03 | UGG(W) | 1 |
| CUU(L) | 0.34 | CCU(P) | 0.45 | CAU(H) | 0.32 | CGU(R) | 0.49 |
| CUC(L) | 1.23 | CCC(P) | 1.42 | CAC(H) | 1.68 | CGC(R) | 1.15 |
| CUA(L) | 3.08 | CCA(P) | 1.84 | CAA(Q) | 1.64 | CGA(R) | 3.7 |
| CUG(L) | 0.71 | CCG(P) | 0.29 | CAG(Q) | 0.36 | CGG(R) | 0.49 |
| AUU(I) | 0.52 | ACU(T) | 0.58 | AAU(N) | 0.31 | AGU(S) | 0.14 |
| AUC(I) | 1.61 | ACC(T) | 1.71 | AAC(N) | 1.69 | AGC(S) | 1.07 |
| AUA(I) | 0.86 | ACA(T) | 1.67 | AAA(K) | 1.7 | AGA(R) | 0.08 |
| AUG(M) | 1 | ACG(T) | 0.04 | AAG(K) | 0.3 | AGG(R) | 0.08 |
| GUU(V) | 0.83 | GCU(A) | 0.48 | GAU(D) | 0.29 | GGU(G) | 0.38 |
| GUC(V) | 0.93 | GCC(A) | 2.22 | GAC(D) | 1.71 | GGC(G) | 0.95 |
| GUA(V) | 1.64 | GCA(A) | 1.19 | GAA(E) | 1.47 | GGA(G) | 1.9 |
| GUG(V) | 0.61 | GCG(A) | 0.11 | GAG(E) | 0.53 | GGG(G) | 0.77 |
Peer Reviews
No public reviews on file for this paper yet. If you reviewed it on a platform where reviews are public (OpenReview, ICLR, NeurIPS, ICML), you can paste yours below so the community can read it here.
Videos
No videos yet. Explain this paper in a talk, walkthrough, or lecture? Add one.
Taxonomy
TopicsGenomics and Phylogenetic Studies · Genetic diversity and population structure · Biochemical and Structural Characterization
Introduction
Over the past 12 years, numerous bird reference genomes have been studied, providing valuable insights into their phylogenetic relationships [1–9]. The Bird 10,000 Genomes Project provided major scientific breakthroughs in phylogenetics [10, 11]. With more than 1,200 species, comprising 13% of all known avian species, India has considerable avian diversity. However, India ranks 3rd for rare and threatened avian species worldwide [12]. The house sparrow was introduced to India via Europe from North Africa and Eurasia by the ancient Romans [13]. Sparrows are found in a variety of habitats, including grasslands, forests, deserts, agricultural areas, and urban areas, such as parks and gardens. They are omnivorous, typically feeding on insects, spiders, worms, seeds, fruits, and grains. While primarily seed eaters, they feed their young on insects and other invertebrates; hence, during breeding periods, they prefer areas rich in invertebrates [14]. Over the years, there has been a tremendous decline in their population worldwide. Understanding the mechanisms through which urbanization affects their population is limited by many perplexing factors: rapid urbanization, deforestation, lack of cavity nesting, and absence of hedges in modern landscaping. Many hypotheses have been proposed explaining the house sparrow population decline: the increased predation by domestic cats or sparrow hawks (Accipiter nisus), cleaner streets reducing foraging opportunities, competition for food from other urban species, loss of nesting sites (particularly under the eaves and in the roofs of houses), pollution/air quality, in terms of both immediate and indirect toxicity through the food supply, increased use of pesticides in parks and gardens, disease transmission [15], and the Allee effect [16].
Between 1970 and 1990, common house sparrow Passer domesticus had a vast breeding population, with over 63 million pairs, and has been declining over the years in Turkey and certain parts of the European Union. Analyzing house sparrow habitats on a fine scale in almost 200 sites, using census data from 2003 to 2017, was one of the most complex field studies in urban Paris, with a dramatic decline of ∼89% of the species over the study period [17, 18]. In India, a sharp decline in the house sparrow population was observed across Mumbai, Bengaluru, Hyderabad, and other major cities. Certain places in India experienced a decline of over 70% [19]. The lifespan of the house sparrow is 3 to 5 years in the wild and only about 20 percent of the young ones live past their first year. Cold weather and food availability decide their longevity. Plasmodium relictum, a parasitic infection, also affected house sparrow demography across suburban London, where sparrows have declined by 71% since 1995 [20].
Genome sequencing efforts yielded a debate over the last few years, pitting short and long read chemistries against each other. While the peacock genome yielded results [21], we earlier contemplated asking questions on the Passer genome sequencing [22]. The avian genome project [23], representing several orders, aims to resolve birds’ phylogeny and collate data for testing hypotheses, understanding extinction and speciation of birds, demographic events, and their roles of drift and selection in the divergence process [24]. Recently, Magallanes-Alba et al. generated a pipeline for rapid genome functional-annotation anchored to the house sparrow genome re-annotation and provided transcripts [25].
Avian evolution has been of great interest in the context of extinction. Annotating birds’ genomes, such as those of passerines, would enable a better understanding of their behavior and foraging traits, and further explore their evolutionary landscape.
Here, we present a genome sequencing of the house sparrow based on a muscle of the bird. We performed genome assembly and annotation using in silico approaches with tools that could be a valuable resource for understanding passerines’ evolution, biology, ethnology, geography, and demography [26].
Methods
Sample collection and genome assembly
A bird wing (muscular tissue) was taken from a male house sparrow (P. domesticus NCBI:txid48849) that was found dead in the lawns of the Zoological Survey of India, Kolkata, and frozen immediately in liquid nitrogen. The sample was handled by Unipath Labs for DNA extraction and sequencing using the Illumina HiSeq 2000 platform. We generated paired-end raw reads by the sequencer and used them for further downstream processing after adapter trimming. We used fastp (RRID:SCR_016962), a fast and comprehensive tool for preprocessing FASTQ files that does adapter trimming, quality filtering, read pruning, and the removal of duplicate reads [27]. Hence, fastp is well-suited for handling large sequencing datasets. We performed genome assembly using Shovill (version 1.1.0; RRID:SCR_017077) and SPAdes (version 3.15.4; RRID:SCR_000131) [28]. We initially mapped Gallus gallus (chicken) and Taeniopygia guttata, but the alignment was unsuccessful. Upon further alignment using bowtie2 (RRID:SCR_016368), we found 99% of the reads mapped, which led us to conduct downstream scaffolding. The gene completeness for Passer was assessed using BUSCO (version 5.5.0; RRID:SCR_015008) [29] and orthologous genes in the G. gallus genome. We performed a de novo assembly rather than a reference-based assembly with a specific set of nucleotide sequences used to represent an organism’s genome [30]. In addition to BUSCO, we employed three tools for assembling the sample: Megahit (RRID:SCR_018551) [31], MaSuRCA (RRID:SCR_010691) [32], and SPAdes. A summary of the methods can be found in Figure 1.
An overview of the methodology employed for annotation and assembly of Passer domesticus.
Assembly graph construction
To find read overlaps, which are crucial for contig assembly, we performed a statistical analysis of the assembly. Specifically, this passage identified the best assembly among those generated by the three assemblers (as explained above), and selected the best contigs for further downstream analysis. Statistics of the assembly were done using QUAST (RRID:SCR_001228) to identify the N50 statistics [33]. The ensuing gaps were closed using the command line tool TGS-GapCloser [34], which allowed us to close 3,150 gaps constituting the contigs present in our assembly. Prediction of genes in the genome was performed using Augustus (RRID:SCR_008417) [35], an ab initio hidden Markov model (HMM)-based gene prediction tool. The scaffolds of SPAdes were used as input for Augustus against trained species-specific datasets, i.e., G. gallus as the reference for alignment. The obtained GFF file was parsed to get the predicted coding sequence and amino acid fasta sequences.
Mitochondrial genome assembly
We extracted the mitochondrial genome from the reads and the assembly was performed using the GetOrganelle toolkit (RRID:SCR_022963), which includes a number of scripts and libraries [36]. Next, we employed WGS read data for manipulating and disentangling assembly graphs, and generated reliable organelle genomes, accompanied by labeled assembly graphs that were visualized using Bandage (RRID:SCR_022772) [37]. The prediction of mitochondrial genes from the genome and annotation of the genome were performed using the Mitochondrial Genome Annotation Server (MITOS2) [38], which uses BLAST searches with previously annotated protein sequences to predict protein-coding genes and annotates the tRNAs apart from rRNAs present in the genome. Next, we used BLAST to identify the D-loop, a non-coding region in mitochondria that acts as the promoter for both light and heavy chains, and a key feature in mitochondria. We were able to acquire the order of the genes, their names, start and end points, and obtained the values of the intergenic regions between genes to construct the mitochondrial DNA. Mitochondrial DNA was constructed and visualized using GenomeVX [39]. To measure the codon usage and Ka/Ks, we used relative synonymous codon usage (RSCU) analysis using Molecular Evolutionary Genetics Analysis Version 11 [40].
Phylogenetic analysis
The phylogenetic tree was constructed using MEGA11 (RRID:SCR_000667). Consensus was reached with 1Qq tree [41] and MAFFT (RRID:SCR_011811) [42] considering the following species: Passer montanus, Passer_domesticus, Passer_ammodendri, Petronia_petronia, Pyrgilauda_blanfordi, Montifringilla_adamsi, Fringilla_polatzeki, Anthus_cervinus, Motacilla_alba, Emberiza_fucata, Spizella_passerina, Agelaius_phoeniceus, Dives_dives, Euphagus_cyanocephalus, Quiscalus_quiscula, Chrysomus_icterocephalus, Pseudoleistes_guirahuro, Molothrus_badius, Gymnomystax_mexicanus, streptopelia_orientalis_voucher_zjbj2 (outgroup).
After bootstrapping, we constructed a tree using the unweighted pair group method with arithmetic mean (UPGMA) with a gap penalty of −400 and a gap extension of 0.00. For phylogenetic tree construction, we chose Kimura distance as the substitution model with a bootstrapping set of 100, and the final tree was constructed using MAFFT. While the scoring matrix was given as BLOSUM62 AND 200 PAM, the Jukes-Cantor model was set as the substitution model and neighbor joining (NJ) for tree construction, wherein bootstrapping was set to 100. To validate the inferred tree and assess its reliability and robustness, we employed a statistical method called bootstrapping. From the bootstrapped phylogenetic tree, we concluded that a node was well supported if it remained unchanged after 95 out of 100 iterations of removing one character and resampling our tree (a bootstrap of 95% indicates this). Using the Mega X tool, we constructed a tree using the UPGMA algorithm for the Multiple Sequence Alignment (MSA) method, with a gap penalty of −400 and a gap extension of 0.00. For phylogenetic tree construction, we used the substitution parameter model Kimura-2, the maximum likelihood method, and bootstrapping values of 100. Then, a tree with MAFFT alignment was constructed, where the MSA and the tree construction were performed with a penalty score of 1.53. The sequences were aligned using a progressive method with the tree algorithm as default parameter.
Genome annotation, comparison and statistics
Gene annotation was performed using the protein sequences, obtained from gene prediction, to annotate the genes. Repetitive regions were identified and masked prior to gene prediction using RepeatModeler (RRID:SCR_015027) [43], a de novo transposable element family identification and modeling package with Repeat Scout (RRID:SCR_014653) for identifying boundaries [44]. We used the Shovill contigs generated as input with 1,391 sequences (1,696,224 bp) for downstream analyses. The resulting library was later checked against G. gallus repeat libraries. We compared and verified the annotation using REpeat Detector (Red; version 2018.09.10), a rapid tool for detecting de novo repeats on a genomic scale [45]. As we searched for the prediction of incomplete genes at the sequence boundaries, we also aimed to predict complete genes. The Red GFF file was used as input for Augustus, which produced FASTA files containing predicted coding sequences that were used for Pfamscan searches [46]. The resulting Augustus predictions were used as input with the Pfam-A (RRID:SCR_004726) HMM library, which was manually downloaded in Stockholm format. We also queried for characteristic active site residues, if any, between the overlaps belonging to the same clans, and further checked for functional annotations and domains using InterProScan (RRID:SCR_005829) [47] to infer Gene Ontology terms. The Acanthisitta chloris genome was obtained from CNGB for comparing the contigs with similarity [48]. Batch Entrez, the Smith-Waterman algorithm using UVA FASTA (version 36.3.8i May, 2023) from local searches, was used for predicting proteins [49]. GffCompare was used to compare the predicted sequences at different levels of granularity, thereby annotating the sequences based on their overlaps or proximity to reference annotation transcripts [50]. Sensitivity and precision metrics were computed with the GTF file as input for generating annotated files, yielding the “super-locus” for measuring the accuracy with true positives (TP) with other features like true negatives, false negatives (FN), and false positives (FP): Sensitivity = TP/(TP+FN) and Precision = TP/(TP+FP). Finally, RefMap and TMAP files [4] were obtained measuring the reference transcript that either fully or partially matched a transcript from the GTF and those columns in the file describing the most closely matching reference transcript, respectively. We also used RagTag, a suite of tools for scaffolding and improving modern genome assemblies, to merge contigs from SPAdes [51]. FCS-GX (RRID:SCR_026367) was used to map contamination from foreign organisms using the genome cross-species aligner [52].
Comparative divergence time estimation
In order to estimate the divergence among selected clades and species, we used BEAST V2.0 (RRID:SCR_010228) [53], where jModelTest 2 (RRID:SCR_015244) [54] was used to decide the evolutionary model based on the Bayesian Information Criterion (BIC) value, and the best suggested models were HKY+I+G. We used a mutation rate of 0.018 substitutions per site per million to estimate divergence [55]. The log files were checked using Tracer (RRID:SCR_019121), ensuring that Effective Sample Size (ESS) values were greater than 200. The final trees were then annotated with Treeannotator. Time divergences were estimated using data from all 20 taxa representing seven different families.
Results and discussion
SPAdes achieved better genome assembly statistics when compared to MaSuRCA and Megahit
We obtained the paired-end files of 14 GB each, which underwent quality check clearance. The Phred quality score (RRID:SCR_001017) was improved to 30 after Fastp (RRID:SCR_016962) trims, which was then assembled. SPAdes achieved better genome assembly statistics when compared to MaSuRCA and Megahit (Table 1). While the number of contigs was consistent between Megahit and SPAdes, MaSuRCA yielded a smaller number of contigs, as it is not referenced for bird or avian genomes. However, the GC% was found to be consistent with all three tools, attributing to an average of 771 bp. On the other hand, the N50 was comparatively better for the SPAdes assembly than the other two assemblers. In summary, the genome size of P. domesticus was 922 MB taking the SPAdes assembled genome into consideration.
Gene prediction yielded 24,152 genes across as many as 45,634 transcripts
When genes were predicted using Augustus and mapped using BWA-mem from G. gallus, a significant similarity of 80.3% was achieved, further attributing to 24,152 genes, 38,972 introns, and 45,634 transcripts. The GFF file was then parsed to check downstream functional annotations using the KOG, non-redundant (NR), and Uniprot databases. The consensus hits were searched with “uniq sort” to find the most occurring species, and we selected the 10 best hits. We observed that NR yielded the best results with Passer montanus with 7,308 occurencies, Stutzerimonas stutzeri with 1,365, Melospiza melodia maxima with 939, Pyrgilauda ruficollis with 788, Hirundo rustica rustica with 780, Chloebia gouldiae with 715, Limosa lapponica baueri with 679, Onychostruthus taczazanowskii with 652, Lonchura striata domestica with 457, and Motacilla alba with 319. Surprisingly, we also detected bacterial sequences among the hits [56, 57]. We also identified many hypothetical proteins, corresponding to previously unknown regions, which supports the need to annotate the genome more comprehensively. We identified numerous genes crucial for adaptations, including those involved in vocal learning, circadian rhythms, and Allee effects. For instance, BMAL1 clock genes, known to regulate circadian rhythms, were identified in our list. We also found TLR4, which helps identify pathogens and initiate immune responses, in addition to HBAA, HBB, and HBA, which are known for oxygen transport, thereby also supporting adaptation.
Avian genomes are about 70% smaller than mammalian genomes, and Passerines, being small, are thought to maintain the contiguity that we have shown as compared to other vertebrates. We are limited by the number of genomic attributes coming from non-coding regions; nevertheless, this could be due to the large number of hypothetical proteins that require accurate annotation. While many genomes show synteny, we are planning to sequence more genomes that could provide insights into adaptation, evolutionary mechanisms, substitutions, and, importantly, circadian rhythms and the electromagnetic effects that these birds might be affected by. The latter two may have contributed significantly to their drifting away from urban life.
The 710 contigs were mapped to GenBank, yielding 152 hypothetical proteins. This result indicates that a large number of proteins emerged from the known-unknown regions, implying the need to annotate the genome in more detail [58]. Among these, 252 sequences from protein domains matched to animals while the rest matched to bacteria. We observed a large number of largely conserved Kelch domains in addition to a PHD finger 1 in Histone-lysine N-methyltransferase 2C (KMT2C) and 2D (KMT2D) protein. The myeloid/lymphoid or mixed-lineage leukemia protein 3 (MLL3) is associated with circadian factors contributing to genome-scale circadian transcription. While these observations could indicate that a large number of genes have undergone divergent evolution or that some genes were lost and subsequently regained through speciation, the fragmentation of this genome aligns with BUSCO statistics reported earlier for avian genomes, including those for the Chaffinch [59].
Our sequence annotation is limited but diverse, as evidenced by higher gene counts compared to G. gallus [60]. However, many genes in the Chicken genome remain unmapped and unidentified. Ours is a draft genome; nonetheless, for small species such as Passerines functional diversity is poorly understood, and evidence can only be obtained through experimentation. While we attempted to create a high-quality de novo-based reference genome, our final assembly encompassing 922 MB is in agreement with the Elgvin et al. [61] works of a similarly sized genome, albeit the medium-density linkage map and order. The assembly of scaffolds into chromosomes was precisely done across several samples; however, we were unable to achieve this due to limited sample acquisition. Nevertheless, the genes were mapped to their reference genome for downstream analyses (Table 2). Our BUSCO result indicates a comparatively good assembly, with 747 complete BUSCOs (C), comprising 744 complete and single-copy BUSCOs (S). Although we found 3 complete and duplicated (D) and 603 fragmented BUSCOs (F), the distribution of BUSCO categories suggests that the assembly is complete [62]. Furthermore, RagTag yielded desirable contiguity of sequences in the form of scaffolds, with 623,567 placed sequences totaling 362,669,528 bp, 23,433 unplaced sequences comprising 16,110,716 bp, and an overall 623,407 bp of gap sequences.
Seven superfamily domains are conserved between P. domesticus and Acanthisitta chloris
The final set of contigs obtained for assembly was mapped against NCBI taxa [45]. This mapping revealed matches for 14,947 contigs, with 769 of them achieving 100% query coverage across various taxa. Amongst the superfamily members, the intermediate filament protein Brain Acid Soluble Protein 1 (BASP1), glycine-rich LPXTG-anchored collagen-like adhesin, collagen with keratin, and some hypothetical protein-FTsK, translocase domains. What remains intriguing is the presence of a probable chromatin-remodeling complex ATPase chain, which is possibly associated with Allee effects that occur when individual fitness suffers in populations that are small or sparse [16]. We also suggest that the genetic architecture and community-wide admixture could provide insights into their evolution [58].
On divergence, Columbidae appeared to have diverged early compared to others and were considered an outgroup in this analysis. In our sequenced sample, the house sparrow belonged to the family Passeridae. The divergence and expansion of major families began around 7–9 million years ago. Our studied sample formed a subclade with the Eurasian tree sparrow (P. montanus saturatus) and the Saxual sparrow (P. ammodendri), having a Time to Most Recent Common Ancestor (TMRCA) of 4.4 million years ago. Furthermore, our analysis yielded a TMRCA of 2.9 million years ago for P. domesticus and P. m. saturatus (Figure 2).
Phylogenetic tree representing all 20 species to which P. domesticus is closely related, including P. montanus, P. ammodendri, Petronia petronia, Pyrigilauda blandfordi, and Montifringilla adamsi. All these species have highly supported bootstrap values (i.e., 100). Whereas less closely related species, such as Motacilla alba and Anthus cervinus, all belong to branches with a low bootstrap value (i.e., 78). streptopelia_orientalis_voucher_zjbj2 shows the most distant species in the tree, which are the outgroup species with a low supported bootstrap value of 53.
The mitochondrial genome yielded a genome of size 16,804 bp
Gene annotation predicted 37 genes, including 13 protein-coding genes, 22 tRNAs, 2 rRNAs, and the D-loop non-coding region. A labeled mitogenome was produced using the GenomeVX online platform (Figure 2). The RSCU analysis of the codons was calculated, and the lowest preferences were AGA (R), AGG (R), and ACG (T) (Table 2). Although these codons are less frequently used due to lower levels of their specific tRNAs, they may slow down protein translation efficiently, thus avoiding the use of these codons in efficient protein translation. We observed different patterns of selective pressure by analyzing the Ka/Ks ratios for the specified genes with strong purifying selection seen in the majority of genes, which have Ka/Ks ratios much less than 1, including cox1 (0.003), Cox3 (0.012), Nad2 (0.017), Nad3 (0.02), cob (0.02), NAD1 (0.034), Nad4l (0.035), Nad5 (0.03), and Nad6 (0.048) (Table 3). Given that the proteins encoded by these genes are essential to the organism’s survival and functionality, and that harmful mutations are progressively eliminated, these genes are likely highly conserved. The Atp6 gene, on the other hand, appears to be under positive selection, indicating that natural selection may favor modifications in the protein derived from this gene that may be advantageous, with a Ka/Ks ratio of 1.03 (Table 4; Figure 3). While the scoring matrix was specified as BLOSUM62 AND 200 PAM, the Jukes-Cantor model was set as the substitution model and NJ for tree construction, with bootstrapping set to 100 (Figure 4).
Labeled mitogenome representing 37 genes, including the protein-coding genes tRNAs, rRNAs, and the non-coding region, which is the control region or the d-loop.
A time-calibrated tree with 20 selected taxa using complete mitochondrial DNA sequences. The tree was generated using Beast v2.5 with 20 million MCMC runs. Each respective family is represented by a different color, and the node labels indicate the age in million years.
Conclusions
We provide here a whole genome sequencing and assembly for the house sparrow, P. domesticus, which could help answer many genomic questions. Our annotation serves as a valuable resource for checking adaptation, divergence, and speciation. The orthologous annotation and protein mapping, along with the bacterial correlates, suggest that these are crucial for organismal survival and function.
The reference list from the paper itself. Each links out to its DOI / PubMed record.
- 1Zhang G, Parker P, Li B The genome of Darwin’s finch [Geospiza fortis]. Giga Science Database, 2012; 10.5524/100040. · doi ↗
- 2Jarvis ED, Mirarab S, Aberer AJ Whole-genome analyses resolve early branches in the tree of life of modern birds. Science, 2014; 346(6215): 1320–1331. doi:10.1126/science.1253451.25504713 PMC 4405904 · doi ↗ · pubmed ↗
- 3Poelstra JW, Vijay N, Bossu CM The genomic landscape underlying phenotypic integrity in the face of gene flow in crows. Science, 2014; 344(6190): 1410–1414. doi:10.1126/science.1253226.24948738 · doi ↗ · pubmed ↗
- 4Frankl-Vilches C, Kuhl H, Werber M Using the canary genome to decipher the evolution of hormone-sensitive gene regulation in seasonal singing birds. Genome Biol., 2015; 16(1): 19. doi:10.1186/s 13059-014-0578-9.25631560 PMC 4373106 · doi ↗ · pubmed ↗
- 5Friis G, Fandos G, Zellmer AJ Genome-wide signals of drift and local adaptation during rapid lineage divergence in a songbird. Mol. Ecol., 2018; 27(24): 5137–5153. doi:10.1111/mec.14946.30451354 · doi ↗ · pubmed ↗
- 6Louha S, Ray DA, Winker K A high-quality genome assembly of the North American Song Sparrow, Melospiza melodia . G 3 (Bethesda), 2020; 10(4): 1159–1166. doi:10.1534/g 3.119.400929.32075855 PMC 7144075 · doi ↗ · pubmed ↗
- 7Peñalba JV, Deng Y, Fang Q Genome of an iconic Australian bird: high-quality assembly and linkage map of the superb fairy-wren (Malurus cyaneus). Mol. Ecol. Res., 2020; 20(2): 560–578. doi:10.1111/1755-0998.13124.31821695 · doi ↗ · pubmed ↗
- 8Ducrest AL, Neuenschwander S, Schmid-Siegert E New genome assembly of the barn owl (Tyto alba alba). Ecol. Evol., 2020; 10(5): 2284–2298. doi:10.1002/ece 3.5991.32184981 PMC 7069322 · doi ↗ · pubmed ↗