Lead exposure in homes as modifying factors of blood lead levels among young children in Bihar, India
Emily Nash, Yi Lu, Stephan Bose-O’Reilly, Ambrish Kumar Chandan, Lavanya Nambiar, Meenakshi Kushwaha, Given Moonga, Gordon Binkhorst, Kumar Bhaskar, Promila Sharma Malik, Sumi Mehta, Ashok Kumar Ghosh, Arun Kumar, Mohammad Ali, Abhinav Srivastava, Gabriel Sanchez Ibarra

TL;DR
This study in Bihar, India, finds that lead in spices is a key factor increasing blood lead levels in young children, highlighting the need for stricter regulations and awareness.
Contribution
The study identifies lead in spices as a novel and significant contributor to elevated blood lead levels in children in Bihar.
Findings
Elevated lead levels were found in metal foodware and spices.
Lead content in spices was significantly associated with elevated blood lead levels in children.
Current lead levels in spices and metal foodware in Bihar exceed local and international safety limits.
Abstract
More than 275 million children in India have elevated blood lead levels (BLLs). Previous studies in India have focused on children living in highly polluted areas. In addition to industrial sites, children are exposed to lead in their homes. The study aims to identify sources of lead exposure in a sample of children living in Bihar by assessing lead levels in the children’s homes and products and their association with blood lead levels (BLLs). The study used a subset of a statewide BLL study in Bihar, India. From the larger sample, 150 children were selected, including those with a BLL ≥ 20 µg/dL and a random sample of those below this level. Blood samples from children aged 13 to 60 months were analyzed using the LeadCare II analyzer. A home-based assessment (HBA) was conducted to evaluate lead in soil, drinking water, paint, metal and ceramic cookware, spices, cosmetics, and toys.…
Genes, proteins, chemicals, diseases, species, mutations and cell lines named across the full text — each resolved to its canonical identifier and authoritative record.
Click any figure to enlarge with its caption.
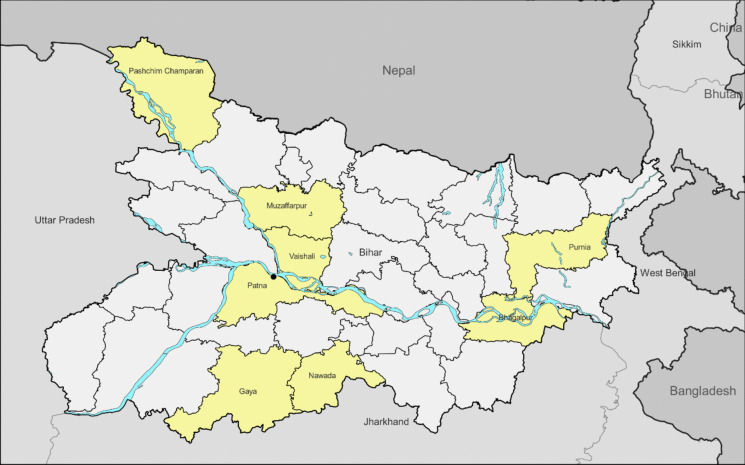 Figure 1
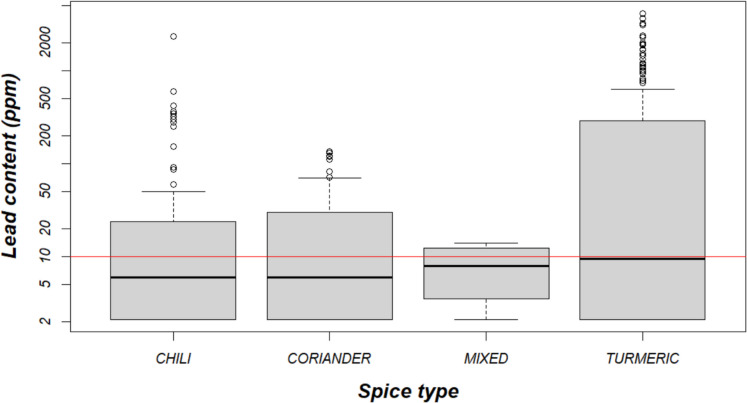 Figure 2
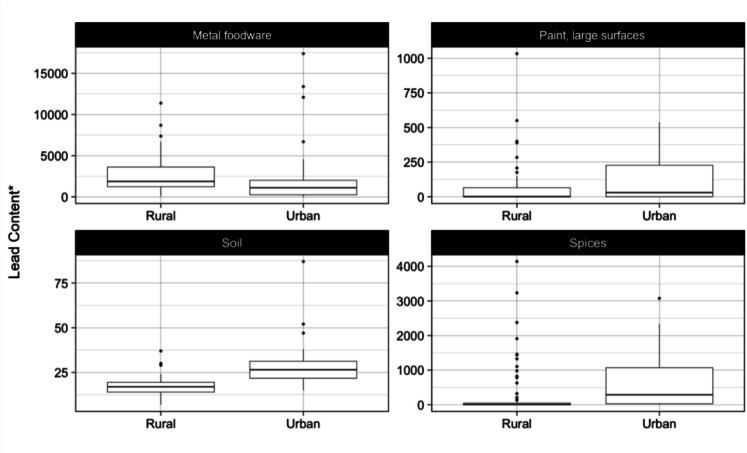 Figure 3
- —GiveWell
- —Effective Altruism Global Health and Development Fund
- —Open Philanthropy
- —Affinity Impact
- —Klinikum der Universität München (6933)
Peer Reviews
No public reviews on file for this paper yet. If you reviewed it on a platform where reviews are public (OpenReview, ICLR, NeurIPS, ICML), you can paste yours below so the community can read it here.
Videos
No videos yet. Explain this paper in a talk, walkthrough, or lecture? Add one.
Taxonomy
TopicsHeavy Metal Exposure and Toxicity · Heavy metals in environment · Recycling and Waste Management Techniques
Introduction
Exposure to lead poses severe health risks, particularly for children. Lead exposure affects children’s brain development and can result in a reduction in intelligence quotient (IQ) and behavioral impacts such as diminished attention span and increased antisocial behavior, as well as lower educational and lifetime earnings achievement (World Health Organization, 2021). Lead exposure can also lead to anemia, hypertension, renal damage, seizures, and impacts on the immune and reproductive systems (World Health Organization, 2021). It is believed that many of the neurological and behavioral effects of lead are irreversible (Bose-O’Reilly & Landrigan, 2021; World Health Organization, 2021).
Young children are especially vulnerable to lead poisoning due to both behavioral and physiological factors. Behaviors like hand-to-mouth activity, ingestion of non-food items, and crawling increase the likelihood of contact with and ingestion of lead present in dust, contaminated soil, or consumer products (Bellinger, 2004; World Health Organization, 2021). In addition, the proportion of ingested lead that is absorbed is significantly higher in children compared to adults (Bellinger, 2004).
Further contributing sources of exposure vary between and within countries (Bose-O’Reilly & Landrigan, 2021). Therefore, identifying potential contributors to lead exposure, particularly within the home environment where young children spend the majority of their time, is crucial. In India, identified or suspected sources have included elevated lead levels in soil and dust from industrial sites (e.g., lead-acid battery manufacturing, and recycling), lead-based paint, lead-contaminated spices, consumer products, food, and water (Ansari et al., 2020; Borah et al., 2010; Brown et al., 2022; Forsyth et al., 2024; Keosaian et al., 2019; Kumar et al., 2022; Mahdi et al., 2020; Mohanty et al., 2013; Rashid et al., 2019; Vishwanath et al., 2012).
An estimated 275 million children in India have blood lead levels (BLLs) exceeding 5 µg/dL (Rees & Fuller, 2020), a globally recognized threshold requiring intervention (World Health Organization, 2021). The associated disease burden is substantial, particularly concerning intellectual disability outcomes in children (Ericson et al., 2018). The loss of an estimated 7 million disability-adjusted life years (DALYs) and 232,500 deaths were attributed to lead exposure in India alone in 2019 (Murray et al., 2020). These health impacts translate to an estimated annual loss of US$236 billion, equivalent to 5% of the country’s gross domestic product (GDP) (Attina & Trasande, 2013).
Bihar, located in eastern India, is the third most populous state in the country. While it has experienced substantial improvements in recent years, Bihar has the highest proportion of its population living below the poverty level of any Indian state (NITI Aayog, 2023). Several previous studies have examined BLLs among children in Bihar, specifically in its capital and largest city, Patna. A recent assessment of BLLs of school children across 10 cities in India reported that the subjects in Patna had median BLLs of 9.7 µg/dL (Kumar et al., 2025). A pilot study of BLLs in children close to an informal lead-acid battery recycling workshop in Patna showed a median BLL of 19.2 µg/dL for children (Ansari et al., 2020). A larger follow-up of 135 children in Patna examined BLLs and exposure sources among children living close to lead-acid battery operations and those living further away (Brown et al., 2022). The difference in BLLs between the two groups was not statistically significant, with an overall geometric mean BLL of 11.6 µg/dL; this study found that lead levels in house dust and spices were the most likely to increase blood lead levels.
Given the prevalence and severity of lead exposure identified among children in Patna, the current study expands the geographic coverage to seven additional districts within the state of Bihar, capturing both rural and urban areas, to characterize contributing risk factors among a state-representative sample.
Methods
Study area and population
Between December 2022 and March 2023, Vital Strategies and Pure Earth assessed BLLs among children under the age of five and their pregnant mothers in eight districts in Bihar, India (Lu et al., 2024). Pure Earth is an international non-profit organization dedicated to solving pollution problems in low- and middle-income countries. Vital Strategies is a global health organization partnering with governments and civil society in 73 countries to implement evidence-based solutions for critical public health challenges.
The primary investigation was carried out as a cross-sectional study in Bihar to understand the prevalence of elevated BLLs among children in Bihar. A multistage sampling design was used for the selection of a state-representative sample of children (N = 697) and a convenience sample of pregnant women who were also mothers of enrolled children (N = 55). First, 8 districts across Bihar were selected to ensure geographic representativeness (Fig. 1). In the selected districts, 2 to 4 wards or villages were selected using probability proportional to size based on the population reported in the 2011 population survey. Urban areas were intentionally oversampled through the selection of 4 urban wards from districts in the state’s most populous city, Patna. Random walk sampling was used to select households within these wards or villages for BLL testing and a questionnaire designed to collect information on factors that may be related to a child’s lead exposure at home (Lu et al., 2024). A subset of participating households was referred for home visits to gather quantitative environmental data on potential sources contributing to elevated BLLs.Fig. 1. Eight districts in the state of Bihar are included in the current study (highlighted)
All households with a participating child with (BLLs equal to or greater than 20 µg/dL or with both a participating child and pregnant mother underwent a comprehensive home-based assessment (HBA) to identify potential lead sources within their homes, with informed written consent from the caregiver. Additionally, a 30% random sample of children with BLLs below 20 µg/dL was selected to create a comparison group. In total, assessments were conducted at 150 households.
Health data
Capillary blood was collected from the participating child and analyzed by LeadCare II, a portable analyzer, during a home visit. Information on household characteristics was collected through computer-assisted personal interviews with primary caregivers. More details on the method and results are reported elsewhere (Lu et al., 2024).
Environmental data
Within the selected households, a standardized approach was applied by a Pure Earth field team to measure lead levels in environmental parameters (soil and water) and consumer products (cookware, spices, paint, ceramics, toys, and cosmetics) in order to evaluate potential sources of lead in the child ‘s home environment (for more details, see Brown et al., 2022). The field crew comprised two teams of six investigators, each with backgrounds in environmental health and social work; these investigators administered the survey, took readings using a portable X-ray fluorescence analyzer (XRF), collected samples, and recorded data.
Where possible, one or more samples were collected for each sample type from a household. Except for drinking water, all aspects of the assessments were carried out using a portable XRF (Thermofisher Niton XL3t 700 s), providing real-time readings in the field. Where multiple readings were taken for any given sample type, the highest reading was used in the analysis. The limit of detection (LOD) of the XRF can vary depending on the sample medium being analyzed and selected instrument settings (Thermo Fisher Scientific, 2013). For soil, spices, cosmetics and toys, an LOD of 3 ppm was used in this analysis; for metal foodware, 20 ppm; for ceramics, 10 ppm; and for paint, 0.18 µg/cm^2^. In total, 970 samples were assessed via XRF. Lead levels in drinking water were analyzed in a commercial laboratory, using inductively coupled plasma-mass spectrometry (ICP-MS) with a LOD of 5 parts per billion (ppb) (Envirochem Research & Test Labs, Lucknow, India).
Reference levels
To provide context to the lead content found in the various environmental and consumer product samples, a “reference level” for each sample type was selected (Table 1). Existing Indian standards were used where possible. Where such national standards do not exist, standards from the USA were applied. For ceramic and metal foodware, existing standards typically apply to the amount of lead that leaches from the items, as opposed to the lead content in the item itself. Field testing of leachable lead in foodware was not possible. Based on ongoing work of Pure Earth on leaching of lead from foodware, a reference level of 100 ppm for all types of foodware was applied for this assessment. Reference levels for all sample types are listed in Table 1. Table 1. Reference levels for each sample typeSample typeReference levelSourceCeramic foodware100 ppm^a^Cosmetics20 ppmCentral Drugs Standard Control Organization et al., (2020)Metal foodware100 ppm^a^Paint surfaces1000 µg/cm^2 b^United States Department of Housing and Urban Development/United States Environmental Protection Agency (2012)Soil200 ppmUnited States Environmental Protection Agency (2024)Spices10 ppmFood Safety and Standards Authority of India et al., (2011)Toys100 ppmUnited States Consumer Product Safety Commission (2023)^a^A reference level of 100 ppm was applied for ceramic and metal foodware based on ongoing leachability research, performed by Pure Earth. As of the writing of this article, the Bureau of Indian Standards has started to apply a certification process for aluminum cookware, requiring that it contain less than 500 ppm^b^India has a standard of 90 ppm for lead content in paint (Ministry of Environment, Forest and Climate Change, Regulation of Lead Contents in Household and Decorative Paints Rules, (Ministry 2016)). For lead that has already been applied to a surface, such as a wall, the XRF best captures results using a mass/area unit, rather than ppm
Ethical clearance, data management, and data protection
The study was conducted after obtaining approval by the BRANY (Biomedical Research Alliance of New York) Institutional review board located in the US (Protocol Number: 22–176-522) and the ethics committee of the Indian Council of Medical Research — Rajendra Memorial Research Institute of Medical Sciences located in Patna, Bihar (approval letter no. RMRI/EC/54/2022, dated 21/09/2022). The study was carried out in accordance with the Code of Ethics of the Declaration of Helsinki for experiments involving human subjects. Written informed consent was obtained from parents of participating children by researchers who were native Hindi speakers. A copy of the consent form was given to the parents of the participants.
For testing the BLL of a child, the parents or legal guardians provided informed consent to complete the interview and carry out blood sampling. A separate form was used for seeking consent for the HBA and an assigned team member explained the purpose of the study to the head of household/guardian including the risks and benefits of the study before seeking consent.
Any data collected on paper was stored in a locked file cabinet in a locked office. The questionnaire data entered and saved in the tablet were exported to the computer and linked with the BLL data using a unique ID and saved in a password-protected dataset and kept safeguarded. Participants and households in this linked dataset were identified and referred to by the unique ID only to protect confidentiality. A central list containing unique ID and name/address/contact information was kept separate from the linked dataset. The name, address, and contact information collected during blood testing were provided to Pure Earth to refer the participant for an HBA, if selected. All data sets and reports were stripped of personal identifying information. All field personnel, including local staff, were trained on proper interviewing techniques and on human subject research ethics.
Variables
Our model uses a dependent binary variable for elevated BLL with a threshold of 10 µg/dL. A BLL of 20 µg/dL was used to automatically trigger the HBA in order to ensure the most severe cases were included in the sample population and to ensure an adequate comparison group. For the statistical analysis, however, a BLL of 10 µg/dL was used; while this is higher than the WHO’s current level for intervention of 5 µg/dL, background levels in Bihar are currently too high to make this WHO recommendation a useful threshold for analysis. Independent variables included in the model are lead levels measured in different environmental samples analyzed in or within the immediate vicinity of each participating child’s home. Among the eight types of environmental samples tested, we selected four types with considerable sample size (more than half of included households), more uniform materials (for example, we excluded readings of furniture), and without a large percentage of samples below detection limits. These four variables are metal foodware, paint on large surfaces, spices, and soil. If multiple items of the same type (e.g., two pieces of metal foodware) were tested in one household, the maximum value is used for the household. Lead content in environmental samples was log transformed using a base of 2 before inclusion in the model due to a skewed distribution and for ease of interpretation.
Statistical methods
Data were analyzed using Excel, SPSS 27, and R. Both geometric and arithmetic means were reported due to the skewed distribution of lead in blood and the environmental samples, and due to the common use of arithmetic means in producing pooled estimates in systematic reviews. Samples reporting lead levels below the LOD were assigned the value of LOD/√2. Generalized logistic regression analyses were used to calculate odds ratios (ORs) and 95% confidence intervals (CIs) for associations between lead in each environmental sample and elevated blood lead levels (BLL ≥ 10 µg/dL). The final model for each environmental sample adjusted for important confounders identified from literature including children’s age in months (continuous), sex (male/female), primary caregivers’ education by category (illiterate, school education, and higher education), socioeconomic status (having a below-poverty-line (BPL) certificate or not as a binary variable), and urbanicity (urban/rural).
Results and discussion
In total, 150 children were assessed for both BLLs and lead in their home environment. Characteristics of sampled children and households are presented in Table 2, grouping the children with BLLs below and above 10 µg/dL. Table 2. Characteristics of participants by BLL (below and greater than or equal to 10 µg/dL)CharacteristicsBLL < 10 µg/dL (n = 97)BLL ≥ 10 µg/dL (n = 53)Average age in months (range)38 (25–52)52 (30–59)Gender Male46 (47%)31 (58%) Female51 (53%)22 (42%)Caregiver’s education Illiterate15 (16%)7 (13%) School education68 (71%)41 (77%) Higher education13 (14%)5 (9.4%) Unknown10 Has below-poverty-line certificate60 (62%)21 (40%)Area type Rural82 (85%)27 (51%) Urban15 (15%)26 (49%)
Results of the environmental and consumer product samples
For each sample type included in the model, we determined how many households had a reading above the reference level; we also calculated the percentage of households with a reading exceeding the reference level among households with at least one reading in that sample type (Table 3). Table 3. Number of households with environmental samples above reference level and percentages of households exceeding this level among households with at least one reading in that categorySample type# Above reference level (%)Metal foodware132 (95%)Spice69 (54%)Soil1 (1%)Paint on large surfaces1 (1%)
Cookware made of metal, especially low-cost, locally manufactured items, has been identified as containing lead that may leach into the food during cooking (Brown et al., 2022; Fellows et al., 2022; Weidenhamer et al., 2017, 2023). Predicting the amount of lead leaching from a specific pot is challenging without dedicated testing (Ali Sultan et al., 2023). There are currently no established international standards for the total lead content in metal foodware. In 95% of the examined households, metal foodware was found to contain lead above the reference level of 100 ppm, indicating the potential for lead to leach at a concerning concentration. It should be noted that this category included some items beyond pots or pans, such as plates and utensils, which may not be heated or may have shorter contact time with food, thus potentially posing a lower human health risk.
Spices in South Asia have been discovered to be adulterated with lead chromate to enhance their color (Baig et al., 2019; Brown et al., 2022; Forsyth et al., 2023, 2024; Gleason et al., 2014; Nordin & Selamat, 2013; Senanayake et al., 2013). This issue was previously identified in Patna, Bihar, but had not yet been confirmed in other parts of the state (Brown et al., 2022; Forsyth et al., 2024). In the current study, spices with lead content exceeding the India Food Safety Authority’s established limit of 10 ppm were identified in all 8 districts, with a prevalence ranging from 8% of spice samples to as high as 76% (Food Safety and Standards Authority of India, 2011). Furthermore, elevated lead levels were detected in all four spice types assessed—chili, coriander, turmeric, or mixed spices (Fig. 2). Turmeric exhibited the highest lead levels among the different spices types, with a median of 9 ppm and a maximum of 4139 ppm, surpassing the regulatory standard by more than 400 times. In 54% of the households surveyed, at least one spice was found to exceed the reference level of 10 ppm.Fig. 2. Distribution of lead in spice samples (n = 292) by spice type, compared to threshold level of 10 ppm (red line). Y-axis is log-scale
Readings of soil were obtained from an area directly outside the residence (1 to 4 readings). Out of 79 households tested, only one had soil levels above 200 ppm, the recently revised United States Environmental Protection Agency’s screening level for residential soil (United States Environmental Protection Agency, 2024). This sample had an exceptionally high value of 1990 ppm. The median soil lead level of households of children with elevated BLLs is 22 ppm, while the median level of households of children with lower BLLs is 17 ppm, indicative of background levels (Table 4). Table 4. Lead levels in household environmental samples by BLL among children (N = number, LOD = limit of detection (20 ppm for metal foodware, 3 ppm for spice and soil, and 0.18 µg/cm^2^ for paint), GM = geometric mean, AM = arithmetic mean, and SD = standard deviation)Environmental sample% Below LOD**BLL < 10 µg/dLBLL ≥ 10 µg/dLNMedian (min and max)GM (SD)AM (SD)% Above reference levelNMedian (min and max)GM (SD)AM (SD)% Above reference levelMetal foodware (ppm)4%891710(< LOD, 12,100)1545 (3.4)2452 (2251)96%501735 (< LOD, 17,400)1378 (4.6)2732 (3175)94%Paint on large surfaces (µg/cm^2^)20%644.3 (< LOD, 1033)4.2 (18.4)71.2 (162.5)2%3432.9 (< LOD, 550)11.1 (23.4)125.4 (170.2)0%Spice (ppm)27%848 (< LOD, 2378)13 (7.2)1292 (371.9)38%44436 (< LOD, 4139)175 (11.1)841 (1021)84%Soil (ppm)0%5917 (7, 52)17 (1.4)18 (7.4)0%1722 (14, 1990)31 (3.2)142 (476.5)6%
Only one household had a reading of lead in paint on a large surface that exceeded the reference level of 1000 µg/cm^2^. This US standard was originally established in 1992 and may not be most reflective of our current understanding of lead risk exposure. The New York City Department of Housing Preservation and Development adopted a new standard of 500 µg/cm^2^ to be implemented in 2025 (NYC Housing Preservation & Development, 2024). Applying this standard, 4 households (4% of households with paint readings) exceeded the threshold. However, it should be noted that nearly 80% of households with paint readings had at least one reading with some amount of detectable lead. Furthermore, the units of µg/cm^2^ and ppm are not interchangeable, so these results may not be representative of the prevalence of paints above India’s regulatory standard of 90 ppm available for purchase or in use in the state.
Toys were assessed in 61 households; 25% of these households had toys that exceeded the 100 ppm threshold, with a maximum reading of more than 4300 ppm. In 61% of the households, the maximum toy lead levels were below the LOD. For this reason, toys were excluded from further statistical analysis.
Nine out of a total of 17 tested ceramic samples exceeded 100 ppm. Similar to metal foodware, there are no recommended limits for total lead in ceramics (only leaching tests), so the 100 ppm threshold is based on current research. However, the small sample size and the fact that ceramic cookware items were not commonly identified in the households potentially limit the representativeness of the results.
Out of 4 cosmetic samples identified, all were below 20 ppm, the Bureau of Indian Standard’s limit for lead in cosmetics. Nevertheless, caution is warranted in interpreting these results due to the very small sample size.
Lead content in drinking water was evaluated from a representative subset of homes at which HBAs were conducted, encompassing various sources such as hand pumps, government supply, and borewells. Out of 25 samples, only one exceeded India’s drinking water standard for lead of 10 ppb with a concentration of 17 ppb, and half of all samples fell below the LOD of 5 ppb.
Elevated lead content in metal foodware and spices were common among the sampled houses. The characteristics of the lead levels in these household environmental samples according to the BLL of the children (greater than or equal to 10 µg/dL versus below 10 µg/dL) are presented in Table 4.
Association between environmental sources and elevated BLL
Table 5 presents the association between lead in different environmental samples and the odds of a child having a BLL ≥ 10 µg/dL. In the crude analysis, the odds of elevated BLL are significantly associated with lead content in spices (crude OR = 1.40, 95% CI 1.24, 1.61) and in soil (crude OR = 4.17, 95% CI 1.58, 14.11). After adjusting for the child’s age, sex, and demographic factors, the odds of elevated BLL are significantly associated only with lead content in spices (aOR = 1.35, 95% CI 1.17, 1.58). This means when the lead content in spice doubles, the odds of a child having elevated a BLL will be 1.4 times higher. Our finding is similar to findings from an earlier study in Patna, Bihar, by Brown et al. (2022), which also observed significant associations between elevated BLLs and high levels of lead in turmeric and soil collected from outside households among children living in communities distant from lead-related industries. Table 5. Associations between environmental sources and elevated BLLs (OR = odds ratio, Pb = lead)VariableUnadjusted OR (95% CI)p-valueAdjusted OR (95% CI)p-valuePb in metal foodware0.96 (0.80–1.15)0.631.09 (0.88–1.36)0.44Pb in paint on large surface1.08 (0.98–1.19)0.131.03 (0.91–1.16)0.66Pb in spice1.40 (1.24–1.61) < 0.011.35 (1.17–1.58) < 0.01Pb in soil4.17 (1.58–14.11)0.012.21 (1.09–9.91)0.14
Lead levels in rural versus urban homes
In Table 6, we compare lead levels in environmental samples collected from homes located in urban and rural areas. Applying a Wilcoxon rank sum test shows that lead levels in metal foodware used in rural households were significantly higher than those used in urban households (69% higher median level), potentially reflecting a greater dependence on informally produced cookware. In contrast, urban households reported significantly higher lead levels in paint (21 times higher), spices (36 times higher), and soil (59% higher) than rural households (Fig. 3). These urban disadvantages may reflect greater use and availability of commercial paints, differences in the supply chain for spices, and the historic deposition of lead particles in soil from decades of combustion of leaded gasoline in areas with dense traffic. Table 6. Lead levels in environmental samples by household urbanicityEnvironmental sampleRuralUrbanp-valueMedian (IQR)Median (IQR)Metal foodware (ppm)1875 (1240, 3640)1110 (260, 2020) < 0.001Paint on large surface (µg/cm^2^)1.4 (0.1, 65)30 (0.8, 227)0.016Spice (ppm)8 (2.1, 47)288 (27, 1072) < 0.001Soil (ppm)17 (14, 20)27 (22, 34) < 0.001^^Wilcoxon rank sum testFig. 3Lead content in environmental samples by urbanicity. * Lead content is expressed in µg/cm^2^ for paint and in ppm for metal foodware, soil, and spices. Note: lead in soil content above 1500 ppm (N = 1) not shown
Impact
In summary, our assessments identified a high prevalence of elevated lead levels in metal foodware and spices among households tested in the state of Bihar. We found a positive and statistically significant association between lead levels in spices collected in homes and elevated BLLs among Bihari children. The concern regarding lead in spices has been previously highlighted in the city of Patna and in other regions in South Asia (Brown et al., 2022; Forsyth et al., 2024). While a small amount of lead can naturally occur in spices due to varying lead content in soil, the levels observed in this study suggest intentional adulteration. Research from Bangladesh indicates that this practice aims to enhance color for greater appeal in the market (Forsyth et al., 2019). The issue of lead in metal foodware emerges as a significant concern from our data, reflecting a growing body of literature from other low- and middle-income countries (Mathee & Street, 2020; Weidenhamer et al., 2017). Lead may be found in cookware that is manufactured from recycled and waste metals (Mathee & Street, 2020; Weidenhamer et al., 2023). Predicting the extent of lead transfer from a specific pot to food is challenging, and there are currently no international standards for total lead content in metal foodware. However, simulated cooking scenarios in laboratory settings have found that pots with comparable lead content can leach quantities of lead exceeding recommended intake values (Fellows et al., 2025; Street et al., 2020; Weidenhamer et al., 2017). While less widespread, elevated lead levels were also identified in specific toys and ceramic items and in paint in one household, which could pose a risk to individual children.
Strengths and limitations
This study assessed lead levels in a wide range of environmental samples and consumer products in households in Bihar, India and paired this data with biological samples. Households of children with high BLLs (above 20 µg/dL) and a random subset of households with low to moderate BLLs were evaluated. The random selection of households for the original blood lead testing study from which we drew a subset for this study provided good representation of the state population, not only of communities with known environmental lead contamination.
Limitations should be acknowledged. Although high BLLs and lead levels exceeding standards in several sample categories were observed, the overall sample size is fairly small and may have limited the study’s power to detect small or moderate effect sizes. The limited sample size in certain categories, such as cosmetics and ceramics, precludes definitive conclusions. For some environmental samples such as lead in paint on large surfaces, the percentage of samples with levels under detection limits was also high and limited the variation in exposure level among samples. For this analysis, we used the maximum reading for each item category when there were multiple readings for a single household; therefore, any heterogeneity in that category within a single household was not well captured.
Moreover, contribution of lead exposure from the home environment to blood lead levels is likely modified by the child’s behavior (e.g., handwashing, frequency of spice intake, and time spent indoors), home condition (e.g., chipping paint and frequency of mopping the floor), and children’s exposure outside of home (e.g., playing outside or in school or daycare). BLLs in children are indicative of relatively recent exposures, while actual exposure to household lead sources may not be temporally correlated.
Conclusions
The results of home-based lead exposure assessments reveal the prevalence of high lead levels in common household items, particularly cooking spices and metal foodware, across the state of Bihar, India, adding to existing research on exposure sources identified in the capital of Patna and expanding our understanding for the wider region. These findings highlight the strong need for timely interventions to protect residents, especially children, from avoidable lead exposure. In the case of spices, we identified a positive and statistically significant association between increasing lead concentrations and children’s BLLs. Therefore, enhanced monitoring and enforcement of existing spice safety rules is critical. The implementation of policies on lead content in metal cookware and an associated monitoring and enforcement approach would represent a proactive step in mitigating this potential source of exposure while research continues to characterize the extent of leaching and the contribution of dietary lead. These actions, combined with health education to raise awareness about lead hazards and promote protective measures, are imperative to mitigate lead exposures and ultimately reduce childhood BLLs.
The reference list from the paper itself. Each links out to its DOI / PubMed record.
- 1Bose-O’Reilly, S., & Landrigan, P. J. (2022). Chapter 30 - Metal toxicology in low-income and lower-middle-income countries. In G. F. Nordberg & M. Costa (Eds.), Handbook on the Toxicology of Metals (5th ed., pp. 705-729). Academic Press. 10.1016/B 978-0-12-823292-7.00018-8
- 2Central Drugs Standard Control Organization, Ministry of Health and Family Welfare, Directorate General of Health Services, Government of India. (2020). Cosmetics Rules. https://cdsco.gov.in/opencms/opencms/en/Acts-and-rules/Cosmetics-Rules/
- 3Food Safety and Standards Authority of India, Ministry of Health and Family Welfare, Government of India. (2011). Food safety and standards (Contaminants, toxins and residues) regulations. https://www.fssai.gov.in/upload/uploadfiles/files/Contaminants_Regulations.pdf
- 4Kumar, R., Kumar, S., Kapley, A., & Gupta, A. (2022). Assessment of lead impact on human and India's response. Council of Scientific and Industrial Research (SIR) and NITI Aayog. https://www.pureearth.org/wp-content/uploads/2022/06/Lead-Report-India-CSIR-NITI-Ayog-June-2022.pdf
- 5Ministry of Environment, Forest and Climate Change, Government of India. (2016). Regulation of lead contents in household and decorative paints rules. https://moef.gov.in/environment-protection
- 6NITI Aayog. (2023). India national multidimensional poverty index: A progress review. Government of India. https://www.niti.gov.in/sites/default/files/2023-08/India-National-Multidimentional-Poverty-Index-2023.pdf
- 7NYC Housing Preservation & Development, 2024. Lead-based paint. https://www.nyc.gov/site/hpd/services-and-information/lead-based-paint.page. Accessed 16 Apr 2025
- 8Thermo Fisher Scientific. (2013). Thermo Scientific Niton XL 3T GOLDD Series XRF Analyzers for consumer goods: Elemental limits of detection for consumer goods screening. https://tools.thermofisher.com/content/sfs/brochures/Niton-XL 3t-GOLDD-Consumer-Goods-LO Ds-2013 Feb 05.pdf. Accessed 16 Apr 2025