Exploratory study of the effect of DHA supplementation on blood fatty acids and inflammatory markers in children with MIS-C
Elvira Verduci, Patrizia Risè, Giulia Fiore, Sara Vizzuso, Alice Bonomi, Dario Dilillo, Laura Fiori, Elisabetta Di Profio, Valeria Calcaterra, Savina Mannarino, Elena Zoia, Enza D’Auria, Angelo Sala, Gianvincenzo Zuccotti

TL;DR
This study explores how DHA supplementation affects blood fatty acids and inflammation in children recovering from MIS-C, a severe complication of SARS-CoV-2.
Contribution
This is the first study to investigate DHA supplementation in children with MIS-C, showing persistent improvements in fatty acid profiles.
Findings
DHA supplementation significantly increased DHA and EPA levels in children with MIS-C.
Improvements in fatty acid profiles persisted beyond the supplementation period.
DHA supplementation showed a trend toward normalizing inflammatory markers like ESR and IL-6.
Abstract
Children infected with SARS-CoV-2 may develop multisystem inflammatory syndrome (MIS-C) 4–6 weeks after exposure. MIS-C is characterized by elevated markers of inflammation and low blood values of linoleic acid (LA), arachidonic acid (AA) and docosahexaenoic acid (DHA) during acute phase. The aim of this pilot exploratory study was to assess the short-term beneficial impact on the blood fatty acid profile following DHA supplementation in children who have suffered from MIS-C. Fifty-two children aged 2–18 years with diagnosed MIS-C, were enrolled between December ‘20 and March ‘22. Blood samples were collected at hospital discharge (T0), and at 3 (T1) and 6 months (T2) post-discharge using dried blood spots for fatty acid analysis by gas chromatography. Inflammatory and metabolic blood markers were assessed at T0 and T2. All participants received healthy dietary advice throughout the…
Genes, proteins, chemicals, diseases, species, mutations and cell lines named across the full text — each resolved to its canonical identifier and authoritative record.
Click any figure to enlarge with its caption.
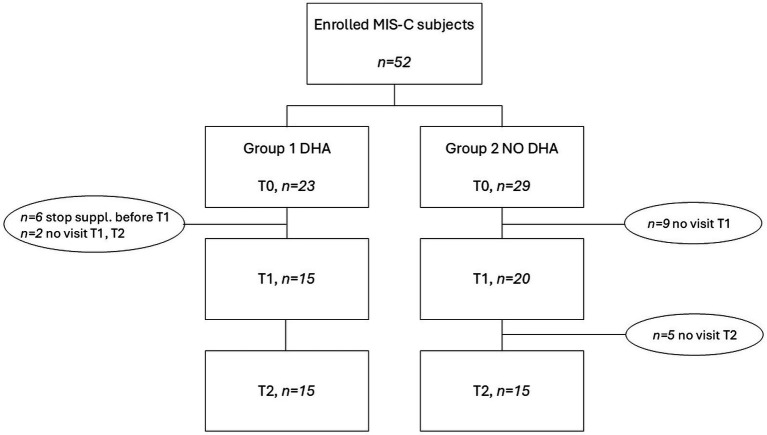 Figure 1
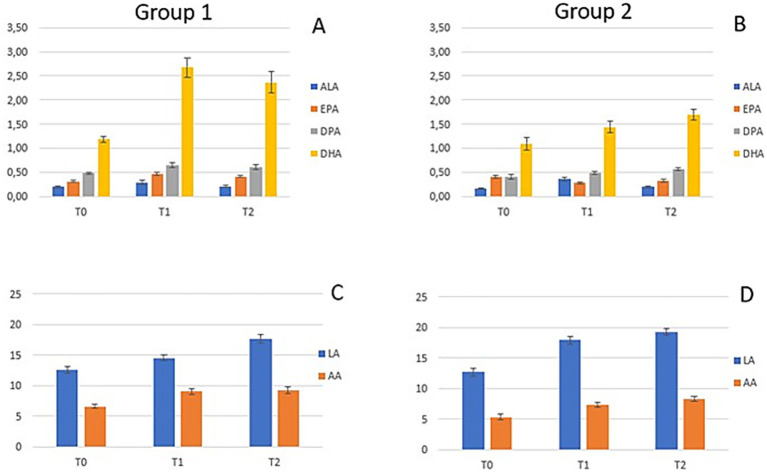 Figure 2
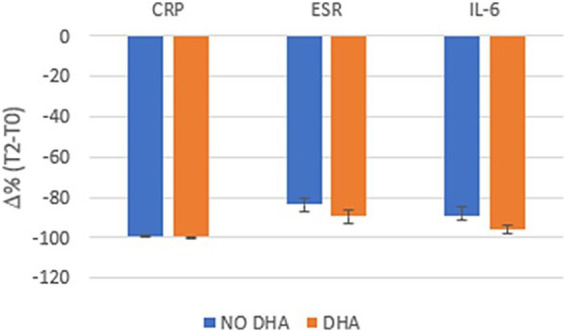 Figure 3
| Variables | Group 1 T0 (DHA) | Group 2 T0 (NO DHA) | |
|---|---|---|---|
| Total ( | 15 | 15 | |
| Male | 13 (87%) | 8 (53%) |
|
| Age (y) | 8.313 (3.96) | 9.227 (3.56) | 0.52 |
| Length of hospitalization | 13 (5.0) | 15 (4.0) | 0.15 |
| PICU admission§ | 10 (67%) | 6 (40%) | 0.14 |
| Height | 1.299 (0.25) | 1.361 (0.24) | 0.49 |
| Weight | 32.83 (15.77) | 33.75 (13.61) | 0.86 |
| BMI z score CDC | 0.5153 (0.89) | 0.2493 (1.11) | 0.80 |
|
| |||
| CRP (mg/L) | 199.8 (105.6) | 175.5 (88.3) | 0.50 |
| Ferritin (μg/L) | 1537.1 (1,881) | 593.7 (504.2) | 0.11 |
| ESR (mm/h) | 51 (27.2) | 59.9 (32.6) | 0.46 |
| IL-6 (ng/L) | 31.88 (65.6) | 17.94 (17.2) | 0.66 |
| Albumin (g/dL) | 2.6 (0.4) | 2.8 (0.5) | 0.28 |
| D-Dimer (μg/L) | 3,7635 (3,536) | 5736.7 (6,062) | 0.30 |
| Fibrinogen (g/L) | 6.5 (0.8) | 5.6 (1.5) | 0.49 |
| Glucose (mg/dL) | 111.53 (37.11) | 118.36 (30.81) | 0.59 |
| Cholesterol total (mg/dL) | 129.3 (46.94) | 145.1 (43.15) | 0.35 |
| HDL (mg/dL) | 15.13 (10.60) | 23.07 (15.11) | 0.11 |
| LDL (mg/dL) | 70.25 (31.81) | 86.91 (27.87) | 0.19 |
| Triglycerides (mg/dL) | 227 (96.42) | 207.29 (103.47) | 0.64 |
| TyG index | 9.30 (0.52) | 9.28 (0.47) | 0.92 |
| FA | Common name | % w/w(SD) at T0 in Group 1 | % w/w(SD) at T1 in Group 1 | % w/w(SD) at T2 in Group 1 | |
|---|---|---|---|---|---|
| 16:0 | Palmitic acid | 27.92 (1.66)a | 26.53 (2.08)b | 25.29 (1.70)b | 0.0004 |
| 18:0 | Stearic acid | 10.15 (1.09)a | 14.07 (1.16)b | 12.46 (1.34)c | <0.0001 |
| 20:0 | Arachidic acid | 0.41 (0.10)a | 0.57 (0.08)b | 0.44 (0.11)a | 0.0001 |
| 22:0 | Behenic acid | 1.04 (0.22)a | 1.86 (0.30)b | 1.59 (0.24)c | <0.0001 |
| 24:0 | Lignoceric acid | 1.72 (0.55)a | 3.21 (0.70)b | 2.64 (0.59)b | <0.0001 |
| 16:1 | Palmitoleic acid | 3.14 (0.83)a | 1.28 (0.37)b | 1.20 (0.54)b | <0.0001 |
| 18:1 n-9 | Oleic acid | 27.07 (3.39)a | 16.13 (2.15)b | 18.58 (3.20)b | <0.0001 |
| 18:1 n-7 | 7-Octadecenoic acid | 1.65 (0.28)a | 1.66 (0.37)a,b | 1.39 (0.32)b | 0.048 |
| 20:1 | Eicosenoic acid | 0.20 (0.13) | 0.16 (0.04) | 0.18 (0.04) | 0.28 |
| 22:1 | Eruric acid | 0.08 (0.03)a,b | 0.13 (0.08)a | 0.04 (0.06)b | 0.015 |
| 24:1 | Nervonic acid | 2.11 (0.58)a | 2.97 (0.60)b | 2.56 (0.47)b | 0.0003 |
| 20:3 n-9 | Eicosatrienoic acid | 0.17 (0.10) | 0.14 (0.04) | 0.13 (0.03) | 0.67 |
| 18:2 n-6 | Linoleic acid (LA) | 12.57 (2.22)a | 14.56 (1.58)b | 17.71 (2.82)c | <0.0001 |
| 18:3 n-6 | Gamma linolenic acid | 0.68 (0.41)a | 0.25 (0.18)a,b | 0.19 (0.08)b | 0.001 |
| 20:3 n-6 | Dihomogammalinolenic acid | 1.13 (0.30)a | 1.43 (0.38)a,b | 1.34 (0.20)b | 0.018 |
| 20:4 n-6 | Arachidonic acid (AA) | 6.60 (1.21)a | 9.05 (1.79)b | 9.29 (2.20)b | <0.0001 |
| 22:4 n-6 | Adrenic acid | 0.84 (0.26)a | 1.13 (0.42)b | 1.06 (0.32)a,b | 0.017 |
| 22:5 n-6 | Docosapentaenoic acid (DPA) n-6 | 0.36 (0.08)a | 0.79 (0.32)b | 0.33 (0.09)a | <0.0001 |
| 18:3 n-3 | Alpha linolenic acid (ALA) | 0.20 (0.09) | 0.29 (0.16)a | 0.21 (0.08) | 0.074 |
| 20:5 n-3 | Eicosapentaenoic acid (EPA) | 0.32 (0.09)a | 0.46 (0.10)b | 0.41 (0.08)b | 0.0002 |
| 22:5 n-3 | Docosapentaenoic acid (DPA) | 0.48 (0.10)a | 0.65 (0.16)b | 0.60 (0.20)a.b | 0.037 |
| 22:6 n-3 | Docosahexaenoic acid (DHA) | 1.19 (0.25)a | 2.67 (0.78)b | 2.37 (0.87)b | <0.0001 |
| SAT | 41.23 (2.42)a | 46.23 (3.13)b | 42.42 (2.36)a | <0.0001 | |
| MONO | 34.24 (3.61)a | 22.33 (2.05)b | 23.94 (3.38)b | <0.0001 | |
| POLY | 24.52 (2.75)a | 31.43 (3.09)b | 33.64 (2.33)b | <0.0001 | |
| U.I. | 108.56 (6.99)a | 124.07 (10.84)b | 127.31 (9.08)b | <0.0001 | |
| n-6 | 22.17 (2.71)a | 27.21 (2.76)b | 29.93 (2.10)c | <0.0001 | |
| n-3 | 2.18 (0.35)a | 4.08 (0.80)b | 3.59 (1.13)b | <0.0001 | |
| n-6/n-3 | 10.42 (2.05)a | 6.88 (1.31)b | 9.12 (2.79)a | <0.0001 | |
| DHA/AA | 0.18 (0.3)a | 0.31 (0.10)b | 0.25 (0.06)c | <0.0001 | |
| EPA/AA | 0.05 (0.02) | 0.05 (0.01) | 0.05 (0.01) | 0.08 | |
| O3I | 2.30 (0.30)a | 4.10 (0.88)b | 3.70 (1.02)b | <0.0001 |
| FA | Common name | % w/w(SD) at T0 in Group 2 | % w/w(SD) at T1 in Group 2 | % w/w(SD) at T2 in Group 2 | |
|---|---|---|---|---|---|
| 16:0 | Palmitic acid | 29.43 (2.45)a | 24.56 (2.12)b | 24.39 (0.9)b | 0.0002 |
| 18:0 | Stearic acid | 10.62 (1.57)a | 12.74 (1.34)b | 11.84 (0.65)b | <0.0001 |
| 20:0 | Arachidic acid | 0.39 (0.12)a | 0.54 (0.09)b | 0.46 (0.05)a,b | 0.0023 |
| 22:0 | Behenic acid | 1.06 (0.21)a | 1.62 (0.20)b | 1.52 (0.19)b | <0.0001 |
| 24:0 | Lignoceric acid | 1.67 (0.44)a | 2.74 (0.47)b | 2.66 (0.37)b | <0.0001 |
| 16:1 | Palmitoleic acid | 2.77 (1.21)a | 1.09 (0.25)b | 1.26 (0.42)b | <0.0001 |
| 18:1 n-9 | Oleic acid | 27.67 (4.27)a | 21.64 (3.97)b | 20.15 (1.81)b | <0.0001 |
| 18:1 n-7 | 7-Octadecenoic acid | 1.63 (0.32)a | 1.44 (0.24)a | 1.31 (0.21)b | 0.0023 |
| 20:1 | Eicosenoic acid | 0.19 (0.08) | 0.18 (0.08) | 0.16 (0.04) | 0.22 |
| 22:1 | Eruric acid | 0.07 (0.05) | 0.11 (0.15) | 0.11 (0.15) | 0.14 |
| 24:1 | Nervonic acid | 2.00 (0.44)a | 2.75 (0.45)b | 2.74 (0.33)b | <0.0001 |
| 20:3 n-9 | Eicosatrienoic acid | 0.15 (0.09) | 0.12 (0.04) | 0.16 (0.06) | 0.14 |
| 18:2 n-6 | Linoleic acid (LA) | 12.70 (2.27)a | 17.92 (2.66)b | 19.29 (1.94)b | <0.0001 |
| 18:3 n-6 | Gamma-linolenic acid | 0.33 (0.31) | 0.29 (0.14) | 0.24 (0.09) | 0.074 |
| 20:3 n-6 | Dihomogammalinolenic acid | 0.94 (0.32)a | 1.09 (0.18)a | 1.30 (0.24)b | 0.0034 |
| 20:4 n-6 | Arachidonic acid (AA) | 5.31 (1.84)a | 7.35 (1.38)b | 8.30 (1.55)b | 0.0001 |
| 22:4 n-6 | Adrenic acid | 0.65 (0.29)a | 0.91 (0.26)b | 1.04 (0.26)b | 0.0003 |
| 22:5 n-6 | Docosapentaenoic acid (DPA) n-6 | 0.33 (0.16) | 0.34 (0.16) | 0.31 (0.08) | 0.98 |
| 18:3 n-3 | Alfa-linolenic acid (ALA) | 0.17 (0.06)a | 0.36 (0.16)b | 0.20 (0.06)a | 0.0003 |
| 20:5 n-3 | Eicosapentaenoic acid (EPA) | 0.41 (0.11)a | 0.28 (0.10)b | 0.33 (0.09)a,b | 0.0088 |
| 22:5 n-3 | Docosapentaenoic acid (DPA) | 0.41 (0.22) | 0.48 (0.10) | 0.57 (0.13) | 0.082 |
| 22:6 n-3 | Docosahexaenoic acid (DHA) | 1.09 (0.51)a | 1.44 (0.47)a,b | 1.70 (0.43)b | 0.003 |
| SAT | 43.17 (3.34)a | 42.20 (3.22)a,b | 40.88 (1.46)b | 0.038 | |
| MONO | 34.35 (4.64)a | 27.20 (3.71)b | 25.68 (2.16)b | <0.0001 | |
| POLY | 22.48 (4.60)a | 30.60 (4.03)b | 33.44 (2.24)c | <0.0001 | |
| U.I. | 100.61 (12.45)a | 115.86 (10.40)b | 123.57 (6.84)b | <0.0001 | |
| n-6 | 20.26 (4.12)a | 27.91 (3.74)b | 30.48 (2.19)c | <0.0001 | |
| n-3 | 2.07 (0.75)a | 2.57 (0.57)a,b | 2.80 (0.56)b | 0.022 | |
| n-6/n-3 | 10.42 (2.72) | 11.24 (2.11) | 11.27 (2.27) | 0.34 | |
| DHA/AA | 0.20 (0.05) | 0.19 (0.05) | 0.21 (0.04) | 0.49 | |
| EPA/AA | 0.09 (0.05)a | 0.04 (0.01)b | 0.04 (0.01)b | <0.0001 | |
| O3I | 2.30 (0.59) | 2.54 (0.58) | 2.88 (0.53) | 0.074 |
| FA | ΔT1-T0 Group 1 | ΔT1-T0 Group 2 | ΔT2-T0 Group 1 | ΔT2-T0 Group 2 | ΔT2-T1 Group 1 | ΔT2-T1 Group 2 | ||||||
|---|---|---|---|---|---|---|---|---|---|---|---|---|
| % w/w(SD) | % w/w(SD) | % w/w(SD) | % w/w(SD) | % w/w(SD) | % w/w(SD) | |||||||
| 16:0 | −1.39 (1.7) | −4.87 (3.8) |
| 0.089 | −2.63 (2.2) | −5.04 (2.9) |
| 0.32 | −1.24 (2.3) | −0.17 (2.2) | 0.20 | 0.24 |
| 18:0 | 3.92 (1.6) | 2.11 (1.6) |
| 0.23 | 2.31 (1.7) | 1.22 (1.3) |
| 0.69 | −1.61 (1.2) | −0.89 (1.3) | 0.14 | 0.33 |
| 20:0 | 0.16 (0.2) | 0.15 (0.1) | 0.51§ | 0.41 | 0.03 (0.2) | 0.07 (0.1) | 0.83 | 0.47 | −0.13 (0.1) | −0.08 (0.1) | 0.13§ | 0.98 |
| 22:0 | 0.82 (0.4) | 0.56 (0.3) |
| 0.43 | 0.55 (0.3) | 0.46 (0.3) | 0.44 | 0.67 | −0.27 (0.3) | −0.10 (0.2) | 0.11 | 0.62 |
| 24:0 | 1.49 (0.8) | 1.07 (0.5) | 0.10§ | 0.45 | 0.92 (0.8) | 1.00 (0.5) | 0.74 | 0.83 | −0.57 (0.8) | −0.08 (0.5) |
| 0.32 |
| 16:1 | −1.86 (0.9) | −1.69 (1.2) | 0.37§ | 0.71 | −1.94 (1.0) | −1.51 (1.0) | 0.24 | 0.39 | −0.09 (0.5) | 0.18 (0.4) | 0.13 | 0.31 |
| 18:1 n-9 | −10.94 (4.3) | −6.04 (5.3) |
| 0.17 | −8.49 (4.5) | −7.52 (4.0) | 0.25 | 0.92 | 2.44 (3.6) | −1.49 (3.6) |
| 0.09 |
| 18:1 n-7 | 0.02 (0.5) | −0.19 (0.3) | 0.18 | 0.82 | −0.26 (0.4) | −0.31 (0.3) | 0.67 | 0.12 | −0.27 (0.5) | −0.13 (0.2) | 0.26 | 0.18 |
| 20:1 | −0.04 (0.1) | −0.02 (0.1) | 0.99§ | 0.64 | −0.02 (0.1) | −0.03 (0.1) | 0.06 | 0.93 | 0.02 (0.1) | −0.02 (0.1) | 0.24 | 0.57 |
| 22:1 | 0.05 (0.1) | 0.03 (0.1) | 0.37§ | 0.66 | −0.04 (0.1) | −0.03 (0.1) | 0.58 | 0.58 | −0.09 (0.1) | −0.06 (0.2) | 0.37§ | 0.99 |
| 24:1 | 0.86 (0.8) | 0.75 (0.6) | 0.65 | 0.93 | 0.45 (0.7) | 0.74 (0.5) | 0.30 | 0.24 | −0.40 (0.6) | 0.01 (0.6) | 0.08 | 0.27 |
| 20:3 n-9 | −0.03 (0.1) | −0.03 (0.1) | 0.80§ | 0.67 | −0.04 (0.1) | 0.01 (0.1) | 0.07 | 0.55 | −0.02 (0.1) | 0.04 (0.1) |
| 0.85 |
| 18:2 n-6 | 1.99 (2.8) | 5.23 (3.6) |
| 0.19 | 5.14 (3.5) | 6.59 (2.5) | 0.20 | 0.56 | 3.15 (3.5) | 1.36 (2.2) | 0.10 | 0.37 |
| 18:3 n-6 | −0.42 (0.4) | −0.04 (0.3) |
|
| −0.49 (0.4) | −0.10 (0.3) |
|
| −0.07 (0.2) | −0.06 (0.1) | 0.84 | 0.62 |
| 20:3 n-6 | 0.30 (0.5) | 0.15 (0.4) | 0.31 | 0.31 | 0.22 (0.3) | 0.36 (0.4) | 0.26 | 0.94 | −0.09 (0.3) | 0.21 (0.2) |
| 0.16 |
| 20:4 n-6 | 2.46 (1.9) | 2.05 (2.4) | 0.60 | 0.55 | 2.69 (1.9) | 3.00 (2.4) | 0.69 | 0.84 | 0.23 (2.4) | 0.95 (1.5) | 0.34 | 0.68 |
| 22:4 n-6 | 0.29 (0.4) | 0.26 (0.3) | 0.85 | 0.52 | 0.22 (0.3) | 0.39 (0.3) | 0.11 | 0.77 | −0.06 (0.3) | 0.13 (0.2) | 0.08 | 0.26 |
| 22:5 n-6 | 0.42 (0.3) | 0.01 (0.2) |
|
| −0.03 (0.1) | −0.02 (0.2) | 0.28 | 0.66 | −0.45 (0.3) | −0.03 (0.2) |
|
|
| 18:3 n-3 | 0.10 (0.2) | 0.20 (0.2) | 0.089§ | 0.74 | 0.01 (0.1) | 0.04 (0.1) | 0.53 | 0.44 | −0.08 (0.2) | −0.16 (0.2) |
| 0.89 |
| 20:5 n-3 | 0.15 (0.1) | −0.13 (0.1) |
|
| 0.09 (0.1) | −0.08 (0.1) |
|
| −0.05 (0.1) | 0.05 (0.1) |
| 0.65 |
| 22:5 n-3 | 0.17 (0.2) | 0.07 (0.2) | 0.22 | 0.12 | 0.12 (0.2) | 0.16 (0.2) | 0.54 | 0.74 | −0.05 (0.3) | 0.09 (0.2) | 0.13 | 0.30 |
| 22:6 n-3 | 1.49 (0.8) | 0.35 (0.6) |
|
| 1.18 (0.8) | 0.61 (0.7) |
| 0.24 | −0.31 (0.8) | 0.26 (0.5) |
| 0.18 |
| SAT | 5.00 (3.4) | −0.97 (4.8) |
| 0.07 | 1.18 (3.6) | −2.30 (3.8) |
| 0.41 | −3.82 (3.7) | −1.32 (3.6) |
| 0.20 |
| MONO | −11.91 (4.2) | −7.15 (5.1) |
| 0.13 | −10.30 (4.8) | −8.67 (4.2) | 0.32 | 0.73 | 1.61 (3.4) | −1.52 (3.1) |
| 0.09 |
| POLY | 6.91 (3.5) | 8.12 (6.6) | 0.53 | 0.91 | 9.12 (3.1) | 10.96 (5.3) | 0.25 | 0.74 | 2.21 (3.9) | 2.84 (3.7) | 0.65 | 0.81 |
| U.I. | 15.51 (11.2) | 15.25 (17.3) | 0.96 | 0.72 | 18.74 (9.4) | 22.96 (15.7) | 0.38 | 0.98 | 3.24 (13.0) | 7.71 (11.1) | 0.32 | 0.64 |
| n-6 | 5.04 (2.9) | 7.66 (6.1) | 0.15 | 0.54 | 7.75 (2.9) | 10.22 (4.6) | 0.09 | 0.49 | 2.71 (3.3) | 2.57 (3.3) | 0.90 | 0.91 |
| n-3 | 1.90 (0.9) | 0.49 (0.8) |
|
| 1.41 (1.0) | 0.73 (0.9) | 0.06 | 0.21 | −0.49 (1.3) | 0.23 (0.7) | 0.06 | 0.22 |
| n-6/n-3 | −3.54 (2.0) | 0.82 (2.6) |
|
| −1.30 (2.1) | 0.86 (2.6) |
| 0.12 | 2.25 (2.6) | 0.03 (2.4) |
|
|
| DHA/AA | 0.12 (0.1) | −0.01 (0.05) |
|
| 0.07 (0.1) | 0.002 (0.1) |
| 0.12 | −0.05 (0.1) | 0.01 (0.05) |
|
|
| EPA/AA | 0.003 (0.02) | −0.05 (0.1) |
| 0.092 | 0.004 (0.0) | −0.05 (0.0) |
| 0.07 | −0.01 (0.01) | 0.002 (0.02) | 0.051 | 0.72 |
| O3I | 1.80 (0.9) | 0.24 (0.9) |
|
| 1.40 (0.9) | 0.59 (0.9) |
| 0.11 | −039 (1.0) | 0.34 (0.8) |
| 0.22 |
| Biochemistry | Group 1 at T0 | Group 1 at T2 | Group 2 at T0 | Group 2 at T2 | Reference values | Δ between groups (G2-G1) | Effect size (95% CI) | |
|---|---|---|---|---|---|---|---|---|
| CRP (mg/L) | 199.8 (105.6) | 0.8 (1.1) | 175.5 (88.3) | 0.9 (0.5) | ≤10 mg/L | 0.5 | 24.20 (−48.43, 96.83) | 0.25 |
| Ferritin (μg/L)§ | 1537.1 (1,881) | 30.7 (12.7) | 593.7 (504.2) | 25.5 (14.4) | <30 μg/L [0–5 yo] | 0.14 | 290 (−53, 1,340) | 0.27 |
| ESR (mm/h) | 51 (27.2) | 5.6 (5.4) | 59.9 (32.6) | 9.1 (6.4) | ≤20 mm/h | 0.68 | −4.81 (−28.6, 19.3) | −0.16 |
| IL-6 (ng/L) § | 31.88 (65.6) | 0.37 (0.01) | 17.94 (17.2) | 0.37 (0.01) | 7 (ng/L) | 0.63 | 1.25 (−8.9, 31.6) | 0.07 |
| Albumin (g/dL) § | 2.6 (0.4) | 4.5 (0.3) | 2.8 (0.5) | 7.1 (10.5) | 35–50 g/L | 0.11 | −0.40 (−0.8, 0.1) | 0.29 |
| D-Dimer (μg/L) § | 3763.5 (3535.7) | 439.8 (294.9) | 5736.7 (6062.4) | 425.5 (402.6) | <500 μg/L | 0.5 | −758 (−3,366, 1,010) | 0.12 |
| Fibrinogen (g/L) § | 6.5 (0.8) | 4.1 (0.7) | 5.6 (1.5) | 3.9 (0.6) | 2–4 g/L | 0.12 | −0.46 (−1.26, 0.30) | 0.28 |
| Glucose (mg/dL) | 111.53 (37.11) | 87.47 (7.93) | 118.36 (30.81) | 86.53 (5.13) | <100 mg/dL | 0.57 | −7.22 (−33.63, 19.19) | −0.21 |
| Cholesterol total (mg/dL) | 129.27 (46.9) | 152.60 (29.5) | 145.1 (43.1) | 151.2 (24.9) | <170 mg/dL | 0.31 | −17.76 (−53.6, 18.09) | −0.38 |
| HDL (mg/dL) | 15.13 (10.6) | 48.53 (10.3) | 23.1 (15.1) | 49.8 (7.1) | >45 mg/dL | 0.25 | −6.97 (−19.30, 5.35) | −0.43 |
| LDL (mg/dL) | 70.25 (31.8) | 86.84 (26.4) | 86.9 (27.9) | 86.4 (23.5) | <110 mg/dL | 0.37 | −19.16 (−48.17, 9.84) | −0.56 |
| Triglycerides (mg/dL) | 227 (96.42) | 89.93 (51.68) | 207.29 (103.47) | 74.67 (24.09) | <75 mg/dL [0–9 yo] | 0.82 | 9.21 (−73.47, 91.90) | 0.09 |
| TyG Index | 9.30 (0.52) | 8.16 (0.51) | 9.28 (0.47) | 8.03 (0.32) | <7.88 | 0.72 | −0.082 (−0.55, 0.38) | −0.14 |
Peer Reviews
No public reviews on file for this paper yet. If you reviewed it on a platform where reviews are public (OpenReview, ICLR, NeurIPS, ICML), you can paste yours below so the community can read it here.
Videos
No videos yet. Explain this paper in a talk, walkthrough, or lecture? Add one.
Taxonomy
TopicsKawasaki Disease and Coronary Complications · Fatty Acid Research and Health · Peroxisome Proliferator-Activated Receptors
Introduction
1
Children infected with SARS-CoV-2 may develop multisystem inflammatory syndrome (MIS-C) 4–6 weeks after exposure (1). MIS-C occurs with an incidence of approximately 1 out of 3,000 to 4,000 children and adolescents with documented COVID-19 infection (2–4), and the demographic characteristics of the patients showed a male predominance and an age range between 7 and 10 years (5, 6). Multiple organ failure is a consequence of the disease, manifested by gastrointestinal, cardiovascular, hematological, mucocutaneous, neurological, and respiratory symptoms (7). Intensive care unit (ICU) care is required for patients with more severe disease (8), and according to several studies, it may occur in 50–80% of children with MIS–C (9). A primary role of a cytokine storm and the impact of adaptive immunity following SARS-CoV-2 infection are described in the most widely accepted explanation of the disease mechanism of MIS-C (10, 11). The pathophysiology of MIS-C involves complex inflammatory cascades similar to those observed in severe COVID-19, characterized by dysregulated immune responses and altered lipid metabolism (12, 13). Recent studies have identified unique neutrophil gene signatures associated with COVID-19 severity progression (14), suggesting that inflammatory biomarkers may serve as prognostic indicators for post-COVID-19 syndromes including MIS-C. Additionally, some intrinsic susceptibility factors have been described, and evidence of molecular mimicry for MIS-C pathogenesis has also been provided (15). During the acute phase of MIS-C, altered glucose metabolism (elevated HOmeostasis Model Assessment for Insulin Resistance (HOMA-IR) and Triglyceride Index values) and a reduction in body mass index (BMI) z-score have been reported in children (16, 17).
COVID-19 and its sequelae, including MIS-C, are characterized by profound alterations in lipid metabolism and inflammatory mediator production. Studies have demonstrated that SARS-CoV-2 infection leads to disturbances in fatty acid (FA) biosynthesis pathways and increased plasma arachidonic acid (AA) levels (18), while also affecting sphingolipid metabolism, particularly sphingomyelin levels, which correlate with disease severity (13). Additionally, the inflammatory response involves matrix metalloproteinase activation and lipid peroxidation processes that contribute to tissue damage (19). Previously we reported lower levels of omega-6 (ω6) linoleic acid (LA) and AA in MIS-C children, probably as result of massive release from phospholipid stores followed by metabolic conversion into pro-inflammatory lipid mediators (20). In particular, during the acute phase of MIS-C in children, blood levels of LA and AA were lower by an average of 38 and 35%, respectively (20), when compared to previously reported values for the pediatric population (21–25). Omega-3 fatty acids have also been strongly investigated in relation to immune status and inflammatory processes, particularly the anti-inflammatory and pro-resolving properties of metabolites derived from omega-3 polyunsaturated fatty acids (ω3 PUFA). In fact, metabolites synthesized from docosahexaenoic acid (DHA) and eicosapentaenoic acid (EPA) by means of lipoxygenases’ activity, have been collectively defined as specialized pro-resolving mediators (SPMs) (26). Hence, it is not surprisingly that we previously observed lower plasma levels of DHA in children with acute MIS-C compared to controls (20). SPMs are compounds involved in tissue regeneration and includes resolvins, protectins, maresins, and maresins conjugate (27). By activating macrophages with an anti-inflammatory phenotype (M2) and promoting phagocytosis in a non-phlogistic manner, SPMs produced by the metabolism of ω3 PUFA have been shown to reduce pro-inflammatory mediators’ synthesis and neutrophil recruitment (20).
In adult patients higher circulating ω3 PUFA, have been associated with a better prognosis for COVID-19 (28). Harris et al. investigated the levels of blood DHA in a large, prospective, population-based cohort of 110,584 individuals to compare the risk of COVID-19 outcomes including testing positive for SARS-CoV-2, hospitalization, and death, in relation to the baseline plasma DHA levels. The findings indicate that individuals in the highest quintile of plasma levels of DHA, experience a 26% reduced risk of hospitalization, positive test outcomes, and mortality, compared to those in the lowest (29). A limited number of studies also aimed at assessing the omega-3 Index (O3I), a measure of the EPA and DHA content (as %) of red blood cells, usually expressed as a proportion of the total weight of fatty acids in red blood cell membranes (30). Zapata et al. (31) in their cross-sectional study confirmed previous findings, revealing that patients with severe COVID-19 had a reduced O3I, consistent with insufficient fish and ω3 supplement consumption, and markedly lower than the healthy control subjects. On the other hand, the higher the O3I and the lower was the risk of requiring mechanical ventilation and mortality (32). Overall, the identification of reliable biomarkers for COVID-19-related inflammatory syndromes has become crucial for patient management. Sphingomyelin species have emerged as potential prognostic biomarkers, with elevated levels correlating with age, hospitalization duration, and inflammatory markers such as interleukin-6 (IL-6) and interleukin-8 (13). Furthermore, specific neutrophil gene signatures have been associated with the turning point from non-severe to severe COVID-19 forms (14).
Given the central role of lipid mediators in COVID-19 pathophysiology, nutritional interventions targeting these pathways represent promising therapeutic approaches. The interplay between glucocorticoid therapy and lipid mediator pathways influences inflammatory responses in COVID-19 (12). Specifically, regarding ω3 supplements, a systematic review in adult patients, estimated them to be 12 to 21% effective in reducing the risk of Covid-19 (33). Additionally, a scoping review of adult patients highlights their potential role in treatment (34). Specifically, one randomized controlled trial (RCT) examined the effects of enteral ω3 supplementation (1,000 mg daily containing 400 mg EPA and 200 mg DHA) for 14 days in critically ill COVID-19 patients. The treated group showed higher one-month survival rate, renal and respiratory function, compared to controls (35). The latter is supported also by several studies reporting that ω3 FA can reduce mortality rates in critically ill patients (36, 37).
To date there are no studies that have evaluated the effects of supplementation with ω3 FA in children affected by SARS-CoV-2.
The present study aims for the first time to assess the short-term beneficial impact on the blood fatty acid profile following DHA supplementation in children who have suffered from MIS-C.
Materials and methods
2
Subjects
2.1
In this exploratory pilot study, 52 children and adolescents aged 2–18 years with MIS-C, defined according to the Centers for Disease Control and Prevention (CDC) classification (2), were recruited between 1 December 2020 and the end of March 2022 at the Pediatric Department of Children’s Hospital Vittore Buzzi in Milan, Italy.
Multidisciplinary management in the acute phase was previously described (15). For each children pediatric intensive care unit (PICU) admission and the overall number of days of hospitalization were recorded during the progression of the diseases, as previously described (38). During hospital stay, standard drug therapy was administered to all patients (intravenous immunoglobulin, corticosteroids, and antiplatelet therapy).
Patients were enrolled after 5–7 days from admission in Pediatric Unit during the stable phase of the disease. Upon admission, for all patients, a clinical and biochemical evaluation was conducted, and anthropometric measurements were taken at admission and before hospital discharge. During hospital stay (T0) a blood droplet was collected from each patient over a special adsorbent paper embedded with the antioxidant butylated hydroxytoluene (BHT) and stored in a refrigerator until analysis, as described below. Additionally, the drug therapy of the children was recorded at this time. After discharge, the following timepoints of the study were scheduled: T1 90 days after T0, and T2 180 days after T0.
Dietary advice on healthy diet, in accordance with the principles of the Mediterranean diet, was provided to every participant from T0 up until the end of the study period (T2). From T0 to T1, enrolled patients were assigned to one group of study intervention. At discharge (T0), 23 consecutive patients received instructions for DHA supplementation (1 mL/day equals to 250 mg of DHA; see Supplementary Table 1) for 3 consecutive months (Group 1). Meanwhile, 29 children with MIS-C, at T0 did not receive any DHA supplementation (see Figure 1) but only usual care with dietary advice (Group 2). Both groups of intervention were asked not to take any additional supplement during the entire study period. A monthly telephone call was carried out to check adherence to supplementation and dietary advice. At T1 and T2, other samples on BHT absorbent paper were taken and stored in accordance with the previously mentioned procedure. Moreover, at T2, the patients underwent further multidisciplinary examinations, clinical and biochemical analysis were performed.
Flow chart of enrolled patients.
The study complies with the Declaration of Helsinki guidelines and was approved by the hospital’s Institutional Review Board (protocol number 2021/ST/004). After being informed about the study, each caregivers provided written consent for inclusion in the study.
Study product
2.2
At discharge children in Group 1 were instructed to take 1 mL/day of DHA oil supplement, equals to 250 mg of DHA from algae origin. The rationale for DHA supplementation was based on evidence demonstrating the role of lipid mediators in COVID-19 pathophysiology, including platelet-activating factor and endocannabinoid pathways (12), and the potential for omega-3 fatty acids to counteract oxidative stress and matrix metalloproteinase-mediated tissue damage (19). Details on nutritional composition of the study product are reported in Supplementary Table 1. The rationale for using 250 md/day was derived from previous literature, as we considered both the established condition of insulin resistance observed in our cohort of pediatric patients with MIS-C (16) and the minimum observed effect of dosage of DHA reported in the literature among pediatric age groups (39).
Anthropometry and blood parameters
2.3
At T0, physical examination was performed and anthropometric measurements of weight and height were taken, and the BMI was calculated for each patient. A mechanical column scale with altimeter (Seca 711 and Seca 220) was used to measure weight and height, while a tape measure (Seca 201) was used to measure arm and waist circumferences. Tricipital skinfolds were also measured using a caliper (Holtain 610). BMI (kg/m^2^) and BMI z-score were calculated according to CDC growth chart reference values (40, 41). The diagnosis of MIS-C was confirmed by performing a complete blood count and measuring levels of C-reactive protein (CRP), erythrocyte sedimentation rate (ESR), procalcitonin, ferritin, cardiac troponin T (cTnT), N-terminal pro-brain natriuretic peptide (NT-proBNP), coagulative parameters, creatine kinase, electrolytes, and IL-6. The selection of inflammatory markers (IL-6, CRP, ESR) was based on their established correlation with COVID-19 severity and lipid metabolism alterations. These markers correlate with sphingolipid disturbances (13) and neutrophil activation signatures (14) in COVID-19 patients.
Furthermore, a fasting blood sample was collected between 8:30 and 9:00 a.m. during hospitalization to evaluate the metabolic profile. The following parameters were evaluated: total cholesterol, HDL cholesterol, LDL cholesterol, fasting plasma glucose, and triglycerides (TG). The triglyceride–glucose (TyG) index, a surrogate for insulin resistance, was calculated as [ln(fasting triglycerides (mg/dL) fasting plasma glucose (mg/dL)/2)] (42).
All blood testing were repeated after 6 months at T2, excluding parameters closely linked to MIS-C diagnosis.
Fatty acid analysis
2.4
The FA profile was assessed using a blood droplet gathered on a special adsorbent paper embedded with the antioxidant BHT. FA methyl esters were examined by gas chromatography, following direct transmethylation, utilizing a GC-2100 (Shimadzu Italia S.r.l., Milano, Italy) equipped with a 15 m capillary column (DBB Agilent), PTV injector and FID detection (43).
Relative percentages were used to report 23 different FAs; total saturated FA (SFA), monounsaturated FA (MUFA) and PUFA were also reported. In addition, O3I was calculated according to the method outlined by Stark et al. (44). The unsaturation index (U.I.) was calculated as the sum of the percentage levels of each FA x its number of double bonds.
Statistical analysis
2.5
Continuous and categorical data are expressed as mean [Standard Deviation (SD)] and number (percentage %), respectively. All variables were tested for normality distribution according to Shapiro Wilk test. Baseline comparisons of anthropometric data, clinical features, and fatty acids profile were tested according to independent t-test for unpaired data or Mann Whitney U Test for normally and not normally distributed variables, respectively. Chi square test was performed for categorical variables at baseline. To account for potential baseline differences between the DHA-supplemented and control groups due to non-randomized, consecutive patient allocation, a propensity score was calculated for each subject using logistic regression. Variables included in the model were sex, PICU admission, baseline inflammatory markers (ferritin, D-dimer, fibrinogen), and relevant FAs (ALA, EPA, Gamma-linolenic acid, and AA). Fatty acids comparisons over time within the same group were performed with ANOVA for repeated measure and Friedman test with Bonferroni correction for normally and not normally distributed variables, respectively. Significant changes over time for each fatty acid within each group were expressed as ΔT1-T0, ΔT2-T0, and ΔT2-T1, and after were compared between Group 1 (suppl DHA) vs. Group 2 (no DHA). In the first model, raw data of delta fatty acids profile between groups were compared with independent t-test for unpaired data or Mann Whitney U Test for normally and not normally distributed variables, respectively. In the second model, propensity scores were used as covariates in adjusted comparisons of outcomes between groups. For clinical biomarkers, changes between T2 and T0 were described as Δ and compared between the two groups. Delta of the difference between groups (ΔG2-G1), was expressed as the difference in means with 95% confidence intervals based on the unpaired t-test for normally distributed variables, or as the Hodges–Lehmann estimate of the median difference with 95% confidence intervals based on the Mann–Whitney test for non-normally distributed variable. Effect sizes were estimated according to Cohen’s d or non-parametric r where appropriate. A two-sided p-value less than 0.05 was required for statistical significance. The IBM SPSS Statistics 28.01v software and GraphPad Prism 9.0 were used to conduct the statistical analysis.
Results
3
Figure 1 shows the flow chart of enrollment according to groups. Overall, 52 subjects (children and adolescents) with MIS-C were enrolled at T0. In the supplemented group (Group 1), 6 children took DHA for less than 3 months and 2 children did not attend the visits at T1 and T2; thus, they were excluded from final analysis. No adverse events were reported during the study and all participants tolerated the DHA supplement well, and no safety concerns were raised by caregivers or investigators. In Group 2, 9 children did not attend the visit at T1, and 5 children were excluded from the final analysis as they did not attend the visit at T2. At 6 months after the acute event (T2) the two groups consisted of 15 subjects each.
Table 1 shows general characteristics, clinical manifestation and anthropometric indices of the study groups at baseline. Apart from a significant difference in sex at baseline, no differences were observed for anthropometric, clinical and biochemical parameters at baseline among groups. Specifically, the length of hospitalization was 13(5.0) and 15(4.0) days in Group 1 and 2, respectively (p = 0.15). Rate of PICU admission was not significantly different among groups (67% vs. 40%, respectively, p = 0.14). Regarding fatty acid profile at baseline (see Supplementary Table 2), both groups were comparable except for a significantly higher value of gamma-linolenic acid (p = 0.014) and AA (p = 0.031), and a lower value of EPA (p = 0.031) in Group 1 compared to Group 2. There were no significant differences in dietary intakes among the two groups (data not shown). The mean propensity scores were 0.83 ± 0.23 in Group 1 and 0.19 ± 0.27 in Group 2. These scores were included as covariates in all between-group comparisons to adjust for potential confounding.
Table 2 shows the FA profile in Group 1 at different timepoints. Compared to baseline, at T1 there was a significant increase of DHA levels (1.19 ± 0.25 at T0 vs. 2.67 ± 0,78 at T1), and also of docosapentaenoic acid (DPA) (0.48 ± 0.10 at T0 vs. 0.65 ± 0.16 at T1) and EPA (0.32 ± 0.09 at T0 vs. 0.46 ± 0.10 at T1). At the same time, LA and AA significantly increased, whereas oleic acid was drastically decreased (p < 0.0001 for all trends). Total ω6 and ω3 FAs significantly increased after intervention compared to baseline (p < 0.0001).
At T2 in Group 1, we observed only a slight reduction of EPA, DHA and DPA respect to T1, without significance. At 6 months, mean EPA and DHA values were 0.41 ± 0.08 and 2.37 ± 0.87, respectively, which remain significantly higher compared to baseline (p = 0.0002 and p < 0.0001, respectively). Regarding ω6 FA the significant trend toward an increase of mean levels persisted at T2 (22.17 ± 2.71, 27.21 ± 2.76 and 29.93 ± 2.10 at T0, T1 and T2, respectively, p < 0.0001). In fact, at T2 LA significantly increases compared to both T1 and T0, while AA was significantly higher compared to baseline. Oleic acid values at T2 significantly rose compared to T1, although they were still significantly lower than baseline. Overall, the observed changes are also reflected in the ω6/ω3 ratio, which significantly decreased from 10.42 ± 2.05 to 6.88 ± 1.31 at T1 and then significantly rose to 9.12 ± 2.79 at T2 (p < 0.0001), although remaining lower than baseline mean value.
Table 3 shows changes over time of FA profile in Group 2. As per Group 1, Group 2 experienced a significant increase of ω6 FA (20.26 ± 4.12 at T0, 27.91 ± 3.74 at T1, and 30.48 ± 2.19 at T2, p < 0.0001), with LA and AA being significant higher at T1 and T2 compared to baseline (p < 0.0001). There was a dramatic reduction of oleic acid from T0 to T1, and the trend persisted at T2 although without significance. Regarding ω3 FA, only ALA significantly increased from 0.17 ± 0.06 at baseline to 0.36 ± 0.16 at T1 (p = 0.0003), while DHA experienced a significant enrichment only at T2 compared to baseline (1.70 ± 0.43 at T2 vs1.09 ± 0.51 at T0, respectively). Interestingly, ω6/ω3 and DHA/AA ratios as well as O3I, did not significantly change over time in Group 2.
Table 4 shows the significant changes of FAs between groups, expressed as Δ values. After intervention at T1, there was a significantly greater increase of LA in Group 2 compared to Group 1 (p = 0.01), however, this difference was no longer statistically significant after adjustment (padj = 0.19). On the contrary the ΔDHA at T1 was significantly higher in Group 1 respect to Group 2 (unadjusted p = 0.0001), and this difference remained statistically significant after adjustment (padj = 0.015). Interestingly, the EPA trend at T1 is significantly different among groups as it increases in Group 1 while it decreases in Group 2 [0.15(0.1) vs. − 0.13(0.1), p < 0.0001]. This difference remained statistically significant after adjustment (padj = 0.0024). Overall, the ΔT1-T0 increase in total n-3 was significantly higher in Group 1 than Group 2 [1.90(0.9) vs. 0.49(0.8), p < 0.0001 and padj = 0.005].
In Group 1 the ΔT2-T0 for EPA remained positive and was significantly different compared to Group 2 [0.09(0.1) vs. −0.08(0.1) unadjusted p = 0.0005], and this difference remained statistically significant after adjustment (padj = 0.0028). Conversely, the ΔT2–T0 for DHA was significantly greater in Group 1 compared to Group 2 in the unadjusted analysis [1.18(0.8) vs. 0.61(0.7); p = 0.04], but this difference was no longer statistically significant after adjustment (adjusted p = 0.24). A significantly different pattern of n-6/n-3 ratio was observed between the two groups at each timepoint.
Figure 2 shows the levels of ω3 and ω6 FA measured at the different time points in the two groups. Both groups showed an increase in ω3 but in Group 1 the increase was more marked. Regarding DHA levels, at T1 Group 1 showed a +Δ124% increase vs. +Δ32% in Group 2, and at T2 + Δ 99% vs. +Δ56% increase compared to baseline, respectively (Figures 2A,B). Specifically, DHA in Group 1 (Figure 2A) showed a typical bell-shaped trend due to supplementation followed by washout, while Group 2 exhibits a constant upward trend but never matches DHA levels of Group 1.
Fatty acids levels at time points T0, T1, and T2 in Group 1 (A, C) and Group 2 (B, D). (A) Concentrations of n-3 (ALA, EPA, DPA, and DHA) in Group 1; (B) Concentrations of n-3 (ALA, EPA, DPA, and DHA) in Group 2; (C) Concentrations of n-6 (LA and AA) in Group 1; (D) Concentrations of n-6 (LA and AA) in Group 2.
FAs of the ω6 series showed a similar trend for both groups (Figures 2C,D), specifically both LA and AA increased from T0 to T2.
The FAs values at the three time points (T0, T1 and T2) in the two groups were compared with reference values found in the literature in pediatric groups without current acute inflammation (21–25) (Supplementary Table 2). We observed that LA and AA across all timepoints in both groups were lower or borderline low compared to reference values. Regarding EPA mean values in Group 1 at T1 and T2 were higher compared to reference values, apart from Crippa et al., while in Group 2 values were borderline high. DHA mean values at baseline in both groups were depleted and lower compared to reference values, except from Ryan et al. In Group 1 at T1 and T2 there was a restoring to values similar to references, while this was not observed in Group 2 whose values remained lower than references, excluding value from Ryan et al. At T2 also ALA levels were higher in both groups compared to reference values.
Table 5 summarizes the biochemical parameters measured at T0 and T2. At T0, all parameters, except for albumin, were higher than reference values due to the inflammatory status. At T2, all parameters returned to the normal range.
With respect to the change in biochemical parameters, no significant differences were observed between the groups (Table 5). Figure 3 shows the reduction, expressed as Δ % (T2-T0), in the levels of the inflammatory markers measured in the two groups. CRP decreased similarly in Group 1 and 2, while ESR and IL-6 showed a greater change Δ % and a better tendency toward normalization in Group 1. Although the effect sizes reported in Table 5 are small (CRP: 0.25; ESR: −0.16; IL-6: 0.07), indicating that the observed differences between the two groups may have limited practical impact.
Delta (Δ)% reduction (T2-T0) of inflammatory markers in Group 1 (red color) and Group 2 (blue color).
Discussion
4
Current evidence supports the use of ω3 FA supplementation in the prevention and treatment of a wide range of human diseases, including coronary artery disease, diabetes, hypertension, arthritis, and other inflammatory and autoimmune conditions (45, 46). In fact by triggering the production of SPMs, ω3 actively control the inflammatory process. These mediators reduce the severity of the inflammatory process and promote its active resolution by suppressing the overproduction of pro-inflammatory lipid-derived compounds and cytokines (47). In fact, inflammation is a process consisting of two phases: initiation and resolution. In the first phase, ω6 AA enters the cell through the phospholipid membrane and produces a series of molecules called eicosanoids which are involved in the inflammatory process (48). At the same time, the ω3 EPA, DHA and DPA also enter the cell, and act as substrates for specialized pro-resolving mediators (resolvins, protectins and maresins), modulating inflammation (26, 49). In adults, lower levels of DHA and O3I have been associated with a higher risk of adverse COVID-19 outcomes. In this study, we analyzed the FA profile and inflammation-related blood values in a cohort of children with MIS-C (29). At baseline during the acute phase, we confirmed low levels of ω6 fatty acids that could be attributed to the inflammatory process during which these fatty acids are converted to eicosanoids. After, both groups of children experienced a trend toward increase of total ω6 from baseline to 6 months. Regarding ω3 values, we observed depleted DHA stores at baseline in both groups, with mean values lower than reference values in pediatric age. This status might be explained by the body’s attempt to counterbalance ongoing inflammation.
Our objective was to evaluate whether supplementation with DHA restores normal fatty acid values and improve normalization of biochemical parameters. Our results show a significant increase in DHA and EPA blood values both at T1 and T2, after discontinuation of the supplementation, in the supplemented group compared to patients not supplemented. The DHA/AA ratio was significantly increased in Group 1 at T1 and persisted at T2, while no changes were observed in DHA/AA ratio in Group 2. Interestingly, the ω6/ω3 ratio was found to be higher in Group 2 compared to Group 1 during the follow up. At 3 months in Group 2, DHA and DPA mean values were not significantly changed compared to baseline. Only at T2 they experienced a slight restoration of DHA values, with mean values still significantly lower compared to both the supplemented group and values reported in the literature for healthy subjects. During follow-up, both groups showed a substantial decline in monounsaturated fatty acids, with oleic acid decreasing most prominently. Our findings of altered fatty acid profiles in MIS-C patients are consistent with previous observations in COVID-19, where SARS-CoV-2 infection induced perturbations in fatty acid biosynthesis pathways (18). The improvement in DHA levels may help counteract sphingolipid disturbances and inflammatory lipid mediator imbalances (12, 13).
By looking at the biochemicals parameters, both groups showed complete resolution of inflammation at T2, which can be attributed to the physiological process that naturally follows the acute phase of the disease. Interestingly, while CRP decreased similarly in both groups, ESR and IL-6 showed a greater change and a better tendency toward normalization in the ω3 FA supplemented group. The anti-inflammatory effects of DHA supplementation may be particularly relevant in post-COVID inflammatory conditions. DHA-derived specialized pro-resolving mediators could help modulate platelet-activating factor and endocannabinoid pathways (12), while counteracting oxidative stress and matrix metalloproteinase activation (19).
Given its exploratory nature, this study was designed as a pilot investigation to gather initial data on the role of DHA supplementation in systemic inflammatory conditions in pediatric age groups and guide future research. Studies in adults with severe COVID-19 showed the benefits of early use of ω3 PUFA supplementation (50–52). While nutritional interventions involving PUFAs have been studied in pediatric inflammatory conditions such as IBD (53), evidence is currently lacking in Kawasaki disease and in critically ill children. The current body of evidence is largely derived from adult studies, highlighting the need for pediatric-focused research of an early use of ω3 PUFA in the hospital setting and during follow-up in critically ill pediatric patients. One of the main limitations of this work is therefore the pilot study design. As such, the sample size was relatively small due to high drop-out rate, and the study was not powered to detect small or moderate effects with high statistical certainty. While the results are promising and provide valuable preliminary insights, they should be interpreted with caution. Also, the lack of blinding was a consequence of the emergency conditions during the COVID-19 pandemic, which required a rapid and pragmatic approach to recruitment and intervention delivery. While necessary in this context, this limitation should be considered when interpreting the findings.
Another limitation of our study was the impossibility to directly measure SPMs: while it is commonplace in the literature to report plasmatic concentrations of these bioactive metabolites, it is unlikely that their blood concentrations may reflect the actual concentrations at the inflammatory site(s), given that they undergo rapid local and systemic (possibly hepatic) biotransformation (54). Consequently, interpretations regarding SPM activity remain speculative. Moreover, circulating fatty acid levels, although useful, represent only surrogate markers and may not fully capture the complexity or activity of SPM-mediated resolution pathways. Finally, the interpretation of the results may be complicated by the fact that values of AA or DHA (and LA or EPA) at T0 are in fact the result of two separate factors: first the (higher or lower) values present before the acute phase of the disease, and second the extent of decrease resulting from the more or less significant use of these substrate for the biosynthesis of pro-inflammatory (in the case of AA and LA) or anti-inflammatory (for DHA and possibly EPA) biologically active metabolites, whose balance may ultimately affect the course of the inflammatory response. Future directions could include the implementation of targeted assays for SPMs to better characterize their dynamics and contributions to inflammatory resolution.
In conclusion, ω3 PUFA play a pivotal role in the blood fatty acid profile of children with MIS-C. The high inflammatory response associated with this condition leads to an increased endogenous utilization of these fatty acids, as evidenced by their marked decrease in circulating levels. Although the SARS-CoV-2 pandemic has ended and MIS-C cases have dramatically declined, this syndrome represents a valuable model of acute inflammatory multisystem disease. Monitoring fatty acid status in these pediatric patients may provide clinically meaningful insights into systemic inflammation both after the acute phase and during follow-up.
Our findings suggest that DHA supplementation may be associated with the resolution of inflammatory status in children with acute inflammatory multisystem disease during the stable and recovery phase. The observed improvement in fatty acid status, along with a trend toward normalization of biochemical parameters, might contribute to a more favorable recovery trajectory, potentially enhancing resilience to subsequent inflammatory challenges. These results underscore the potential role of n-3 PUFAs in pediatric acute inflammatory syndromes. Further adequately powered, controlled studies are needed to confirm these observations and to evaluate the potential role of early n-3 PUFA supplementation during the stable and recovery phases in critically ill pediatric patients.
The reference list from the paper itself. Each links out to its DOI / PubMed record.
- 1Feldstein LR Rose EB Horwitz SM Collins JP Newhams MM Son MBF. Multisystem inflammatory syndrome in U.S. children and adolescents. N Engl J Med. (2020) 383:334–46. doi: 10.1056/NEJ Moa 2021680, PMID: 32598831 PMC 7346765 · doi ↗ · pubmed ↗
- 2CDC. Multisystem inflammatory syndrome (MIS). Centers for Disease Control and Prevention (2020) Available online at: https://www.cdc.gov/mis/mis-c/hcp_cstecdc/index.html (Accessed January 15, 2024).
- 3Payne AB Gilani Z Godfred-Cato S Belay ED Feldstein LR Patel MM. Incidence of multisystem inflammatory syndrome in children among US persons infected with SARS-Co V-2. JAMA Netw Open. (2021) 4:e 2116420. doi: 10.1001/jamanetworkopen.2021.16420, PMID: 34110391 PMC 8193431 · doi ↗ · pubmed ↗
- 4Holm M Hartling UB Schmidt LS Glenthøj JP Kruse A Rytter MH. Multisystem inflammatory syndrome in children occurred in one of four thousand children with severe acute respiratory syndrome coronavirus 2. Acta Paediatr. (2021) 110:2581–3. doi: 10.1111/apa.15985, PMID: 34129731 PMC 8444758 · doi ↗ · pubmed ↗
- 5Lee PY Day-Lewis M Henderson LA Friedman KG Lo J Roberts JE. Distinct clinical and immunological features of SARS-Co V-2-induced multisystem inflammatory syndrome in children. J Clin Invest. (2020) 130:5942–50. doi: 10.1172/JCI 141113, PMID: 32701511 PMC 7598077 · doi ↗ · pubmed ↗
- 6Beckmann ND Comella PH Cheng E Lepow L Beckmann AG Tyler SR. Downregulation of exhausted cytotoxic T cells in gene expression networks of multisystem inflammatory syndrome in children. Nat Commun. (2021) 12:4854. doi: 10.1038/s 41467-021-24981-1, PMID: 34381049 PMC 8357784 · doi ↗ · pubmed ↗
- 7Whittaker E Bamford A Kenny J Kaforou M Jones CE Shah P. Clinical characteristics of 58 children with a pediatric inflammatory multisystem syndrome temporally associated with SARS-Co V-2. JAMA. (2020) 324:259–69. doi: 10.1001/jama.2020.10369, PMID: 32511692 PMC 7281356 · doi ↗ · pubmed ↗
- 8Stasiak A Perdas E Smolewska E. Risk factors of a severe course of pediatric multi-system inflammatory syndrome temporally associated with COVID-19. Eur J Pediatr. (2022) 181:3733–8. doi: 10.1007/s 00431-022-04584-8, PMID: 35948653 PMC 9364844 · doi ↗ · pubmed ↗