NLP-like deep learning aided in identification and validation of thiosulfinate tolerance clusters in diverse bacteria
Brendon K. Myers, Anuj Lamichhane, Brian H. Kvitko, Bhabesh Dutta

TL;DR
This paper uses NLP-like deep learning to find and validate allicin tolerance gene clusters in bacteria, revealing new insights into their diversity and function.
Contribution
The novel use of NLP-like techniques to identify and validate previously undetectable allicin tolerance gene clusters in diverse bacteria.
Findings
NLP-like methods identified novel alt-like clusters in multiple bacterial species.
These clusters were validated experimentally and show significant sequence diversity.
The approach simplifies identification of underrepresented gene clusters in bacterial genomes.
Abstract
Allicin tolerance (alt) clusters in phytopathogenic bacteria, which provide resistance to thiosulfinates like allicin, are challenging to find using conventional approaches due to their varied architecture and the paradox of being vertically maintained within genera despite likely being horizontally transferred. This results in significant sequential diversity that further complicates their identification. Natural language processing (NLP), like techniques such as those used in DeepBGC, offers a promising solution by treating gene clusters like a language, allowing for identifying and collecting gene clusters based on patterns and relationships within the sequences. We curated and validated alt-like clusters in Pantoea ananatis 97-1R, Burkholderia gladioli pv. gladioli FDAARGOS 389, and Pseudomonas syringae pv. tomato DC3000. Leveraging sequences from the RefSeq bacterial database, we…
Genes, proteins, chemicals, diseases, species, mutations and cell lines named across the full text — each resolved to its canonical identifier and authoritative record.
Click any figure to enlarge with its caption.
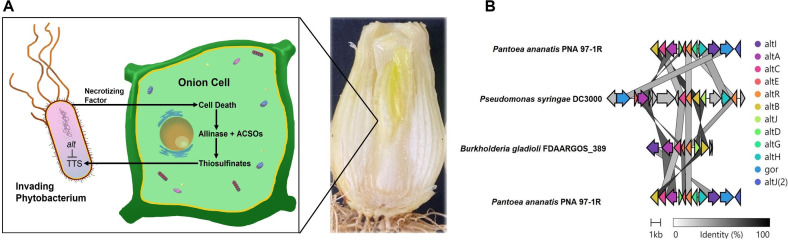 Fig 1
Fig 1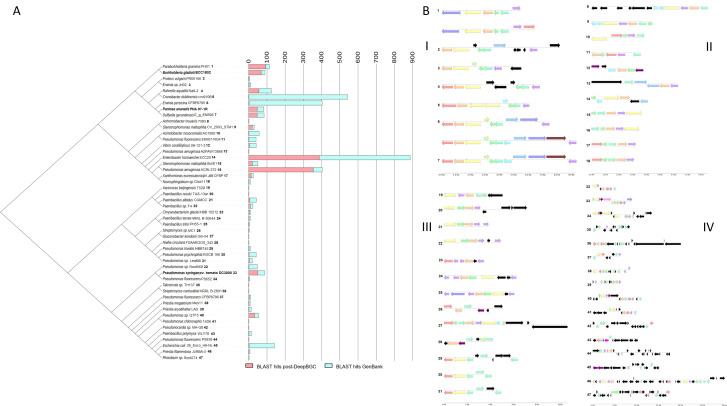 Fig 2
Fig 2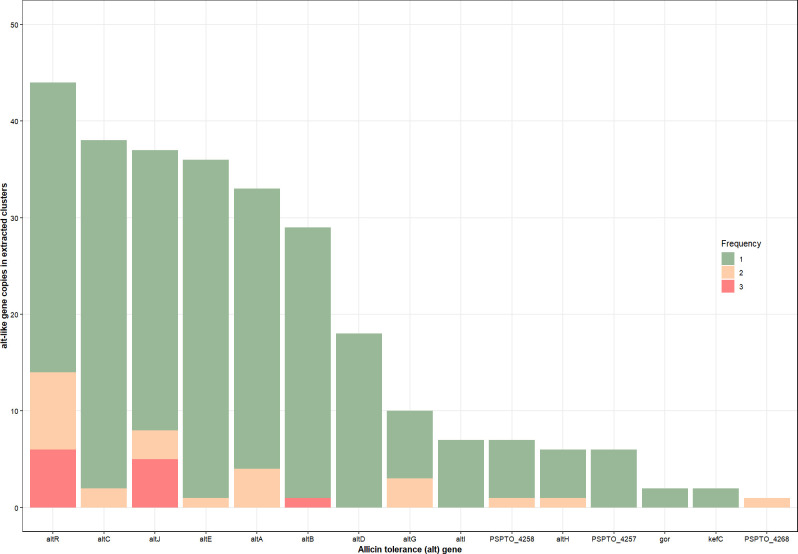 Fig 3
Fig 3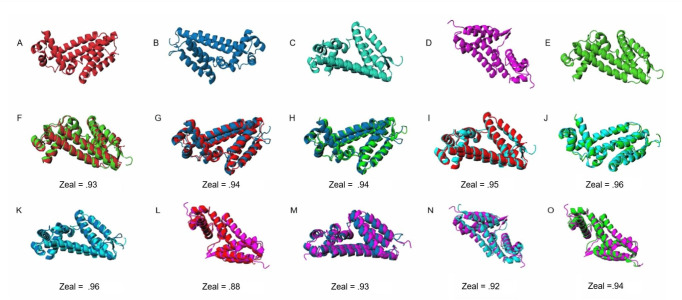 Fig 4
Fig 4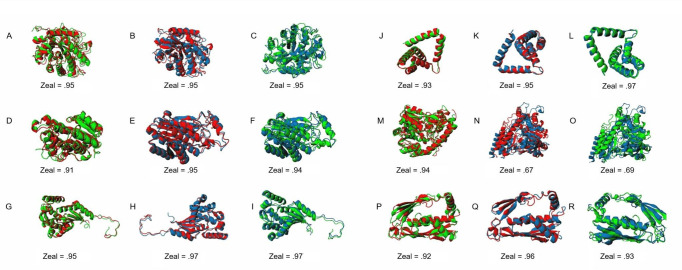 Fig 5
Fig 5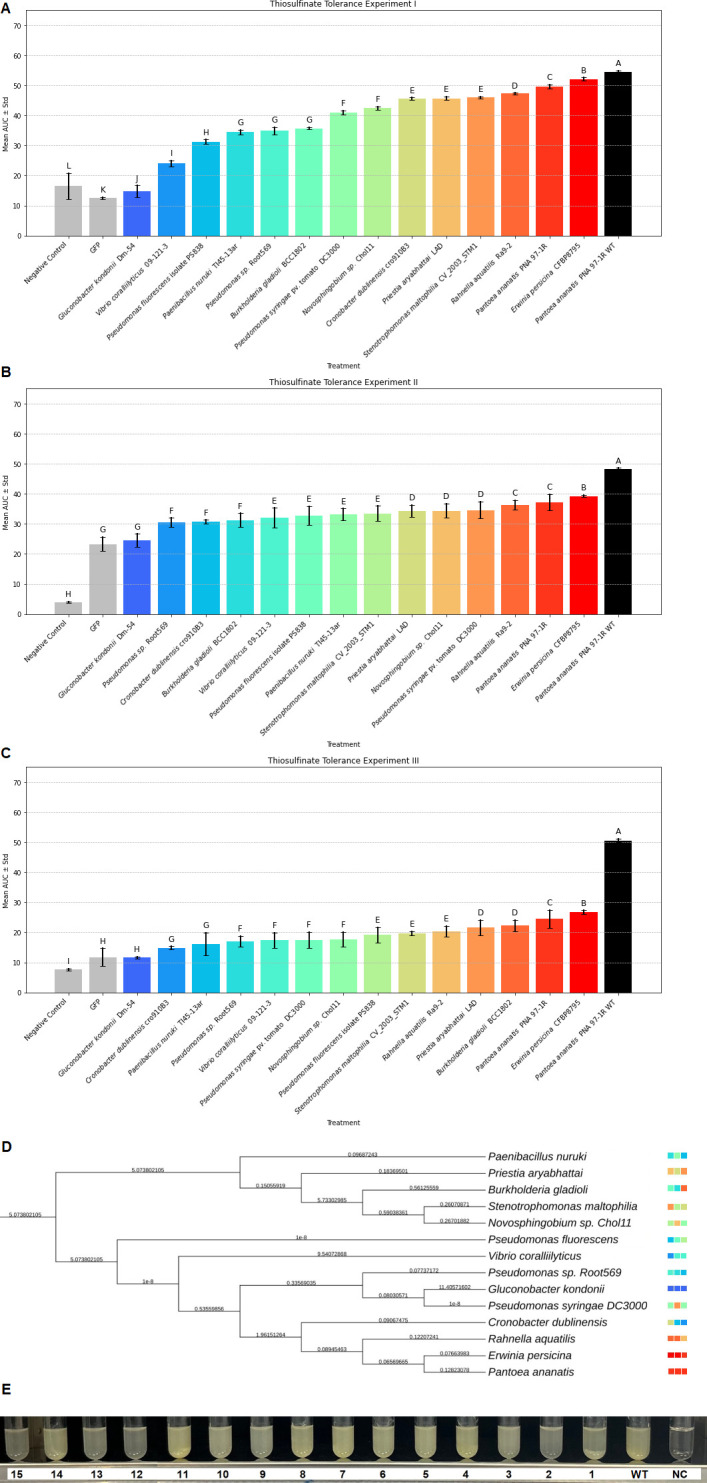 Fig 6
Fig 6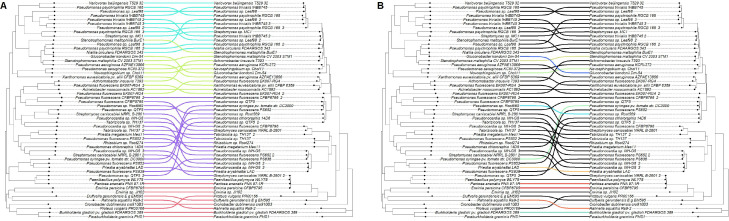 Fig 7
Fig 7|
|
|
|
|
|
|
|
|
|
|
|
| ||
|---|---|---|---|---|---|---|---|---|---|---|---|---|---|
| BG | 52.1 | 66.0 | 50.6 | 62.0 | 51.0 | 42.0 | 74.1 | PTO o | 47.5 | NA | NA | NA | NA |
| PA vs PTO | 39.1 | 66.4 | 48.8 | 62.8 | 46.5 | 45.1 | 73.9 | PTO | 51.1 | 52.4 | 21.9 | 52.3 | 46.1 |
| PTO vs BG | 40.8 | 69.9 | 47.3 | 69.4 | 51.2 | 70.5 | 74.1 | PTO | 54.5 | NA | NA | NA | NA |
| alt protein sequence similarity | altI |
| altC | altE | altR | altJ | altB | altR protein sequence comparisons | altR | gor | altJ | altH | altD |
|---|---|---|---|---|---|---|---|---|---|---|---|---|---|
| BG | 48.2 | 67.9 | 38.5 | 62.5 | 40.1 | 27.8 | 81.3 | PTO o | 36.5 | NA | NA | NA | NA |
| PA vs PTO | 22.9 | 69.6 | 39.2 | 64.6 | 35.4 | 27.2 | 82.1 | PTO | 42.9 | 44.0 | 25.6 | 45.6 | 30.6 |
| PTO vs BG | 18.1 | 74.3 | 43.8 | 71.8 | 43.9 | 76.6 | 78.5 | PTO | 47.3 | NA | NA | NA | NA |
- —U.S. Department of Agriculturehttp://dx.doi.org/10.13039/100000199
Peer Reviews
No public reviews on file for this paper yet. If you reviewed it on a platform where reviews are public (OpenReview, ICLR, NeurIPS, ICML), you can paste yours below so the community can read it here.
Videos
No videos yet. Explain this paper in a talk, walkthrough, or lecture? Add one.
Taxonomy
TopicsGarlic and Onion Studies · Mycorrhizal Fungi and Plant Interactions · Plant Disease Resistance and Genetics
INTRODUCTION
Plants deploy an impressive array of small molecules to defend themselves against herbivory and pathogen-mediated infection. Thiosulfinates such as allicin are charismatic small molecules known for their role as antifeedants and antimicrobials in Allium species (1, 2). These small molecules are reactive organosulfur compounds responsible for several Allium species’ pungent flavor and smell (3, 4). Allicin is produced when the enzyme alliinase acts on alliin, transforming it into a thiol-reactive compound. It interacts with cellular thiols, leading to allyl-mercapto modifications in proteins that deactivate enzymes and cause protein aggregation (5). Additionally, allicin reacts with reduced glutathione, converting it to S-allylmercaptoglutathione and thus depleting the cellular glutathione pool (5, 6). Thiosulfinates have been demonstrated to be inhibitory to a wide range of microorganisms both in vitro and in vivo (7–10). Recently, gene clusters associated with allicin tolerance (alt) were identified not only in the onion pathogens Pantoea ananatis (PA) and Burkholderia gladioli (BG) but also in the garlic saprophyte Pseudomonas fluorescens (10–12). These genes were named allicin tolerance genes and are enriched for genes involved in thiol redox reactions. The alt clusters increased onion virulence capacity in PA and BG strains and conferred increased allicin tolerance to Escherichia coli (12, 13). The alt gene cohort appears to function additively for managing cellular thiol stresses, with multiple genes conferring partial tolerance phenotypes (10). In their 2018 study, Stice et al. (10) data mined the National Center for Biotechnology Information (NCBI) GenBank database to identify Pantoea spp. with alt clusters, using the altG gene as an indicator. In doing so, the authors observed that several strains isolated from Allium hosts and some Brassica species carry alt clusters. In contrast, strains isolated from non-thiosulfinate-producing hosts did not. Inspired by an intuitive understanding of the characteristics defining an alt cluster, manual curation led to discovering a unique cluster within BG and other Burkholderia spp. (12), supported by multigene BlastX analysis (12).
Considering the importance of alt clusters in thiosulfinate tolerance and plant-microbe interactions, identifying diverse alt clusters and their presence in bacterial species is crucial. The alt clusters that were characterized and validated shared low sequence or gene synteny similarity. Typical gene-mining techniques, such as NCBI BLAST or multigene BLAST, do not translate well between alt clusters localized within different bacterial genera. Although the alt cluster is potentially horizontally transferred as it is localized on plasmids, it seems to be maintained vertically within individual bacterial genera. This makes identifying alt clusters within genera comparatively easier; however, their identification among distinct genera is quite challenging. Isolating thiosulfinate-tolerant bacteria from a thiosulfinate-producing host and then manually curating the annotations list for a conspicuous gene cluster has been the modus operandi for alt gene cluster discovery to date. However, it is a time-consuming process that requires in-depth training and a reliable annotation pipeline. Even in optimal conditions, individual researchers might develop personal biases toward which annotations they deem more reliable or questionable, potentially resulting in misidentification of alt clusters. To formalize an alt identification and recovery method independent of the issues caused by gene sequence and gene synteny, we used natural language processing (NLP)-like techniques for mining putative alt-like gene clusters.
The methodology employed here is similar to those used in genome mining for secondary metabolite biosynthetic gene clusters. These pipelines must overcome a challenging task that requires careful consideration of gene content. For example, bacteria tend to organize genes into localized clusters to make metabolite synthesis more efficient (14–16). While manual curation and BLAST are effective for similar biosynthetic gene clusters (BGCs) in closely related organisms, these methods fall short when sequence data alone is inadequate or manual efforts are impractical due to time or cost (17). In such cases, more rigid, “hard-coded” algorithms are used, though they require predefined gene and protein data rules, limiting their use with less-defined gene clusters (18, 19). Machine learning is the natural next step in algorithmic complexity to solve these problems, autonomously allowing for a more generalizable “learning” of input content. This approach allows for discovering more novel BGCs as the algorithm generates its own rules during training for further downstream applications. An example of this is ClusterFinder (20). ClusterFinder utilizes a hidden Markov model (HMM) approach rather than sequence alignment, allowing for greater freedom of discovery. However, HMM does not preserve position dependency effects or any potential higher-order information that may be relevant for BGC discovery (21–23).
To address the need for higher-order information in BGC discovery, a deep learning approach using recurrent neural networks (RNNs) with the addition of vector representations of protein family tags (Pfam) was designed, which improved the capacity for algorithmically detecting novel BGCs (24). DeepBGC utilizes a NLP strategy for identifying and even extracting novel BGCs from bacterial genomes via a clever use of a bidirectional long short-term memory as a recurrent nueral network RNN (25, 26) and a word2vec-like word embedding skip-gram neural network that the authors named pfam2vec (24).
In this work, we trained DeepBGC on our small collection of validated alt clusters to determine the potential for more complex artificial intelligence methods to accelerate the discovery process. Although the alt cluster does not represent a typical BGC where each gene collaboratively synthesizes a molecule, the organization and perceived additive function of these genes for the alt phenotype renders the cluster amenable to methodologies like those used in the BGC discovery. The new alt model was then utilized to data mine the entire RefSeq bacterial database for potential alt-like clusters. Representative clusters were selected and refined through manual curation and sequencing data analysis to produce representative sequences of alt-like gene clusters. The genes, proteins, and predicted binding potential for selected genes from each cluster were compared to identify potentially valuable methodologies for differentiating alt-like gene clusters. Finally, potential alt-like gene clusters were validated by heterologous expression of synthesized altC/altE gene pairs representing key phylogenetic nodes in PA strain PNA 97-1R ∆alt, which lacks the functioning alt cluster and has poor thiosulfinate tolerance.
RESULTS
alt seed cluster gene and protein sequence comparisons show low sequence similarity
Onion-associated bacteria like PA and BG possess alt clusters that impart the ability to survive and propagate in thiosulfinate-rich environments (Fig. 1A). In some cases, this may lead to bulb rot symptoms (Fig. 1A). In the genomic comparison of PA, Pseudomonas syringae pv. tomato DC3000 (PTO), and BG, the total gene counts are 11, 16, and 7, respectively. Shared genes across these strains include altA, altB, altC, altE, altR, altJ, and altI. When evaluating synteny, among PA, PTO, and BG, there appears to be little in common between the three sequences. Between PA and BG, altA and altC do localize; however, their order is inverted. Furthermore, the altR and altE are adjacent between both PA and BG. The altJ and altB are adjacent but inverted between BG and PTO. The altE and altA are also adjacent but inverted between BG and PTO (Fig. 1B).
Overview of the importance of thiosulfinate tolerance with Pantoea ananatis as a model example. (A) Pictorial representation of the chemical arms race between an invading phytobacterium and its Allium host, depicted as Allium cepa. When the phytopathogen utilizes its necrotizing factors to kill the host cells, it, in turn, becomes challenged with toxic thiosulfinate stress that is managed by the alt cohort. In addition, an example of bulb rot symptoms due to Pantoea ananatis-compatible interactions in A. cepa in onion bulbs is included. The provided example is a longitudinal section of an infected bulb displaying rotten water-soaked center scales with visible bacterial growth. (B) Gene cluster synteny comparisons of alt clusters used as the input sequences for DeepBGC training. These comparisons were generated with Clinker. The arrows represent coding sequences along with their directionality. Shaded lines reflect the degree of similarity between the gene clusters, with darker shades indicating higher similarity. Arrows are colored based on their alt annotations.
We observed high degrees of dissimilarity when comparing the total gene cluster sequence similarity among our original three validated alt clusters. Additionally, when analyzing individual genes with annotations shared across all three clusters, the similarity percentages exhibit a range between 21.9 and 74.1%. Specifically, altI sequences show similarities from 39.1 to 52.1%, altA from 66 to 69.9%, and altC from 47.3 to 50.6%. Sequences of altE vary from 62 to 69.4%, altR from 46.5 to 51.2%, and altJ from 41.1 to 70.5%. The altB gene maintains high consistency around 74% across all comparisons. A second altR gene in the PTO cluster displays 47.5 to 54.5% similarity. For genes only shared between PA and PTO, the lowest similarity is noted in altJ at 21.9%, with other genes like altD, altH, and gor displaying up to 52.4% similarity (Fig. 1; Table 1).
A broad range of dissimilarities is observed in assessing protein sequence similarity across the three validated alt clusters, with percentages ranging from 18.1% to 82.1%. Notably, altI shows significant variation, with 48.2% similarity between PA and BG, dropping to 18.1% when comparing BG vs PTO. The protein sequences in altA range from 67.9 to 74.3% across comparisons, while altC varies from 38.5 to 43.8%. The altE sequences are relatively similar, ranging from 62.5 to 71.8%. The altR protein sequences vary from 35.4 to 43.9%, and altJ from 27.2 to 76.6%. The altB exhibits high consistency, with similarities ranging from 78.5 to 82.1%. A second altR in the PTO cluster shows similarities between 36.5% and 47.3%. Similarities for proteins exclusively shared between PA and PTO are notably lower, with altJ at 25.5%, altD at 30.5%, altH at 45.5%, and gor at 43.9% (Table 2).
DeepBGC data mining of the NCBI RefSeq database and filtering for autonomous collection of alt-like gene clusters
To train the DeepBGC model, we utilized the three alt gene clusters that were validated previously by our group (10, 12). At the time, these three clusters represented the only confirmed and characterized alt clusters available in the literature. DeepBGC was trained using default configuration parameters (as specified in deepbgc.json) and retrained 15 times to assess performance variability. We emphasize that this was not a traditional train-test-validation split: the model was trained on the full data set (n = 3) without an independent test set, and repeated training was used solely to evaluate training stability and internal consistency. Accordingly, all reported metrics should be interpreted as reflections of training behavior rather than generalization performance. The 15 output reports were compared to assess model behavior across runs. The average loss across all 15 runs was minimal at 0.00, indicating steady convergence. However, a maximum loss of 0.40 suggested some instability. Accuracy was high and consistent across runs (mean = 1.00, SD = 0.00, min. = 0.98). In contrast, precision and recall were low (mean = 0.01), indicating challenges in identifying true positives given the limited training data. This variability was also reflected in the area under the curve (AUC)-receiver operating characteristics (ROC) scores, which averaged 0.82, suggesting good discriminatory ability with room for improvement. Statistical analysis confirmed significant variability in precision (F-value: 3.78, P-value: ~2 × 10^−6^), recall (F-value: 5.17, P-value: ~7.7 × 10^−10^), and AUC-ROC (F-value: 16.09, P-value: ~7.64 × 10^−43^). In contrast, differences in loss and accuracy were not statistically significant (F-values: 0.86 and 0.39, P-values: 0.60 and 0.98, respectively), indicating stable performance in these areas. The detailed statistical insights underscore the need for further refinement to enhance precision, recall, and overall model robustness. These results are expected given the small training data set, and they were verified through manual inspection of DeepBGC extractions for validity. However, we caution that these metrics should not be interpreted as evidence of high classification capability, especially given the limited small training data set (n = 3). The purpose of reporting these metrics was not to validate a broadly generalizable model, but to evaluate internal consistency and utility for heuristic gene cluster extraction. As we describe throughout the manuscript, this work is primarily a biological data mining and experimental validation effort rather than a machine learning benchmark. The DeepBGC tool was adapted here as a means to enrich for relevant sequences, not to claim definitive predictive power.
Upon completion of the DeepBGC-enabled data mining of 238,362 bacterial genomes from RefSeq, we extracted 12,280 gene clusters. These were reduced to 1,777 sequences post MMseqs2 redundancy filtering with an average GC% of 53.5% (median 55.1%, max. 76.6% and min. 25.7%), an average sequence length of 8,800 (max. 61,726, min. 1,215, and median of 6,424), and finally an average file size of 23 KB (max. 114 KB, min. 9 KB, and a median of 19 KB). After further manual curation to remove gene sequences that appeared split by the end of contigs (only four genes in total length, or gene sequences that lacked at least three unique alt-like Pfam tags), we chose 47 representative alt-like sequences. These 47 representative clusters contained an average GC% of 51.7% (max. 69.9%, min. 32.4%, and median 53.5%), an average sequence length of 7,931 (max. 30,170, min. 3,109, and median 6,316), and finally an average file size of 28 KB (max. 114 KB, min. 12 KB, and median 23 KB). When screening for clusters that are representative of our initial three alt clusters, the Pantoea alt cluster is represented by an alt-like cluster from Duffyella gerundensis (NZ_LN907829.1) with 94% sequence identity and identical values of assigned Pfam domains. The Burkholderia alt cluster is represented by a truncated alt-like gene cluster from Paraburkholderia graminis (NZ_CP024936.1) with 74% sequence similarity. The Pseudomonas alt cluster is represented by itself as PTO (NC_004578.1). For all downstream gene cluster comparisons, we used the PA and BG alt clusters for comparison as references (Fig. 2).
alt-like representative clusters post-DeepBGC extraction of the RefSeq bacterial database. (A) A comprehensive insight into the distribution of alt-like clusters within the NCBI system using the Levenshtein distance matrix of color-coded Pfam domain tags. The resulting BLAST hits of representative alt-like clusters on all extracted alt-like gene clusters from the RefSeq database are shown in pink, while the resulting BLAST hits of representative alt-like clusters from the online GenBank bacterial database are shown in blue. Each line indicates 100 sequences. This tree compares the pattern of Pfam tags in gene clusters and should not be misconstrued as a phylogenetic tree. (B) Color-coded examples of selected representative alt-like Pfam domain tags in the DeepBGC-extracted clusters; (I) represents the first terminal group between Paraburkholderia graminis (PHS1) to Duffyella gerundensis (E_g_EM595); (II) represents the terminal group between Achromobacter insuavis (7,393) to Novosphingobium sp. (Chol11); (III) represents the terminal group between Variovorax beijingensis (T529) to Pseudomonas sp. (Leaf98); (IV) represents the terminal group between Pseudomonas spp. (Root569) to Rhizobium sp. (Root274). These are unrooted neighbor-joining trees based on the Levenshtein differences between a color code conversion of Pfam tags into text strings using the Levenshtein python package. Gene clusters are numbered for ease of comparison. Gene clusters with similar Pfam annotation synteny, but different sequence content, were listed as separate clusters (see clusters 17, 18). The originally described Pantoea ananatis PNA 97-1R and Burkholderia gladioli BCC 1802 are included directly for comparison as the DeepBGC extracted sequence was not precisely the same.
To assess if the 47 retained clusters represent overly generalized gene segments, we conducted a BLASTN search of these clusters against the RefSeq representative genomes database using NCBI default parameters. We filtered hits for biological relevance, defined here as ≥70% sequence identity and ≥3,000 bp alignment length. Thirty-four of the 47 clusters (72%) had at least one such match, typically to only one to three genomes. The remaining 13 clusters produced no such hits within the representative genome set. This distribution supports the notion that most clusters extracted by the model are not widespread across RefSeq and are unlikely to be artifacts of overfitting or random matches. We interpret this as evidence that our model extracts rare, potentially lineage-specific clusters consistent with the known biology of alt systems.
Gene sequence similarity among these 47 clusters is low for alignment-based comparison methods. To minimize this, we color-coded genes based on their known relevance and converted the color code into strings for Levenshtein comparisons. These gene clusters are separated into four distinct groups (Fig. 2). The total counts for alt-like genes among these representative clusters are as follows: altR (N = 41), altC (N = 38), altJ (N = 36), altE (N = 36), altA (N = 33), altB (N = 28), altG (N = 11), altI (N = 8), altD (N = 8), PSPTO_4258 (N = 7), altH (N = 6), PSPTO_4257 (N = 6), gor (N = 2), kefC (N = 2), PSPTO_5268 (N = 1). Among these, altR has the highest count per gene cluster ([Fig. 2 and 3](#F2 F3)).
Frequency of alt-like genes in DeepBGC extracted gene clusters from the bacterial RefSeq database. Here, alt-like gene frequency was calculated from each of the representative gene clusters and added input clusters to determine the number of copies of alt-like genes present in each gene cluster. The graph is organized based on total gene count, with altR being the highest and PSPTO_5268 the lowest. Green colors indicate the alt-like gene appeared only once in the extracted gene cluster. Yellow indicates the gene appeared twice in certain gene clusters. Pink indicates the gene appeared three times in certain gene clusters. Red indicates the gene appeared four times in certain gene clusters. altC, altE, altA, altG, altH, and PSPTO_4258 appear once or twice in certain genomes. PSPTO_5268 appeared twice in one extracted genome. altI, altD, gor, and kefC all appeared only once in their extracted genomes.
BLAST of DeepBGC-mined alt-like clusters and NCBI GenBank for representative sequence-species diversity shows wide diversity of alt-like gene clusters among bacterial genera
To compare the diversity of bacterial species represented by recovered alt-like gene clusters, we employed BLAST to retrieve clusters from both the sequences obtained through DeepBGC-enabled data mining of RefSeq and NCBI GenBank. Due to the varying selection of available sequences between NCBI’s RefSeq and GenBank, cross-comparison between the two databases may offer a more comprehensive understanding of species diversity compared to solely re-screening NCBI RefSeq with BLAST. Notably, Klebsiella pneumoniae emerged as a predominant species, constituting 56% of the recovered sequences in one instance and demonstrating significant representation across multiple samples. Conversely, specific sequences lacked a single dominant species, particularly those associated with Stenotrophomonas maltophilia. Detailed analysis of biodiversity using Shannon-Wiener indices unveiled varying levels of diversity among samples. For instance, sequences attributed to S. maltophilia exhibited higher diversity, representing 63%–84% of recovered sequences. In contrast, sequences linked to Pseudomonas aeruginosa displayed lower diversity, comprising 77%–82% of sequences. Additionally, GenBank BLAST analysis yielded taxonomic insights into the retrieved sequences. While Klebsiella pneumoniae was prevalent, other species, such as Pseudomonas fluorescens and Escherichia coli, were also prominently featured. Specific genera exhibited species-specific enrichment, with Pseudomonas and Paenibacillus showing pronounced representation in the sequences. These findings underscore the wide distribution of alt-like gene clusters across bacterial species and highlight their potential ecological importance (Fig. 2). These results are summarized in the supplementary table (Table S1; https://figshare.com/articles/preprint/Large_i_alt_i_supplement_files/27016423/3?file=49178374).
3D superimposition of predicted protein models is insufficient for differentiating between alt, alt-like, and unrelated proteins
Due to the complexity inherent in classifying alt clusters by sequence and gene synteny, we investigated potential discrepancies in predicted 3D structures. Our analysis began with altR, a tetR-family regulator within alt-like gene clusters, revealing high structural similarities between BG and PA and BG and PTO, with Zeal scores of 0.93 and 0.94, respectively. Further examination of secondary altR variants from PTO showed similar congruence, with scores ranging from 0.95 to 0.96. Extending our analysis to other genes such as altA, altB, altC, altE, and altI, we consistently observed high Zeal scores (0.91 to 0.97) indicative of substantial structural similarity across different organisms. However, altI presented some structural discordance, with lower Zeal scores down to 0.67, suggesting potential functional diversity. We expanded our study to include multiple sequence alignments of the five most frequently identified alt-like genes post-DeepBGC detection, followed by I-TASSER-based 3D structural predictions. These comparisons involved a broad set of sequences, with resulting Zeal scores ranging from 0.40 to 1.00, reflecting a wide diversity in structural similarity among the altC variants. Although the structural comparisons generally supported the structural resemblance across these genes, they did not provide a clear distinction between the datamined gene clusters. ([Fig. 4 and 5](#F4 F5); Fig. S1 and S2; Files S1 and S2 [https://figshare.com/articles/preprint/Large_i_alt_i_supplement_files/27016423/3?file=49178374]).
Comparative 3D superimposition of I-TASSER predicted altR repressors between Burkholderia gladioli pv. gladioli FDAARGOS_389, Pantoea ananatis PNA 97-1R, Pseudomonas syringae pv. tomato DC3000, and an unrelated repressor from Escherichia coli, nemR (ECN). The initial row (A–E) represents all predicted protein structures used for downstream comparisons. The predicted model proteins are displayed as BG altR (A), PTO altR (B), PTO out altR (C), ECN (D), and PA altR (E). The 3D superimposition comparisons are shown in panels F–O. Values below each comparison refer to the Zeal score as predicted by the Zeal GUI (https://andrelab.lu.se/) and are an indication of shape similarity. For example, a Zeal score of “1” indicates the same 3D protein shape. The “F” compares the predicted altR protein from BG vs PA, while panels G and H represent the comparison of altR between BG vs PTO and PA vs PTO, respectively. The panels I, J, and K compare altR between BG, PA, and PTO vs the PTO out_altR as indicated in Fig. 1, respectively. The panels L, M, N, and O compare BG altR, PTO altR, PTO out_altR, and PA altR against ECN, respectively.
Comparative 3D superimposition of I-TASSER predicted alt proteins between Burkholderia gladioli pv. gladioli FDAARGOS_389, Pantoea ananatis PNA 97-1R, and Pseudomonas syringae pv. tomato DC3000. BG proteins are colored red, PA proteins are colored green, and PTO proteins are colored blue for ease of visualization. Values below each comparison refer to the Zeal score as predicted by the Zeal GUI (https://andrelab.lu.se/) and are an indication of shape similarity. For example, a Zeal score of "1" indicates the same shape. Each alt protein prediction is organized into three groups. Panels A, B, and C are comparisons of altA between BG vs PA, BG vs PTO, and PA vs PTO, respectively. Panels D, E, and F are comparisons of altB between BG vs PA, BG vs PTO, and PA vs PTO, respectively. Panels G, H, and I are comparisons of altC between BG vs PA, BG vs PTO, and PA vs PTO, respectively. Panels J, K, and L are comparisons of altE between BG vs PA, BG vs PTO, and PA vs PTO, respectively. Panels M, N, and O are comparisons of altI BG vs PA, BG vs PTO, and PA vs PTO, respectively. Panels P, Q, and R are comparisons of altJ BG vs PA, BG vs PTO, and PA vs PTO, respectively.
Crosstree comparisons between protein sequence similarity and gene synteny indicate vertical transmission and divergence of alt and alt-like genes
To determine if there is any grouping of alt-like genes based on protein sequence similarity, we utilized RAxML to generate phylogenetic trees based on sequence similarity. Furthermore, we used phytools to compare trees for pattern similarity. We utilized further R scripts to label the connecting lines with colors representing the terminal group these sequences belong to and their validation results. Bootstrap values for the trees appear low on several edges, indicating difficulty organizing groups effectively based on sequence. However, the comparison of the two trees together shows that the “core” alt proteins are primarily concordant with each other. While there are some potential notable exceptions, such as the altC from NZ_JACXQ010000006.1, the Rahnella aqualitis representative alt-like cluster, this appears to be due to the rotation of the tree as opposed to a biological reality. This opinion is further supported by both overlaying the validation data on these tree comparisons, where proteins with similar alt tolerance appear to be grouping together, and other comparison trees place the sequence much closer to the other gene synteny groups. These trees suggest that these collections of alt-like proteins appear to have independent evolutionary histories as vertically maintained genes despite being horizontally transferred. Furthermore, the concordance of the validation data and these proteins seems to suggest specialization is occurring with the more robust alt phenotypes consistently grouping (supplementary folder 1; https://figshare.com/articles/preprint/Large_i_alt_i_supplement_files/27016423/3?file=49178374).
Phenotypic testing with synthesized altC/altE pairs provides evidence for thiosulfinate tolerance functionality in predicted alt-like gene clusters
To evaluate if predicted alt-like clusters were legitimate and capable of conferring increased thiosulfinate tolerance phenotypes, we heterologously expressed synthesized altC/altE gene pairs representing key phylogenetic nodes in PA strain PNA 97-1R ∆alt, which lacks the functioning alt cluster and has poor thiosulfinate tolerance. Strains were grown in 50:50 Luria-Bertani (LB) onion extract as in Stice et al., and the mean area under the growth curve was determined. Growth was compared against a thiosulfinate-sensitized PNA 97-1R ∆alt green fluorescent protein (GFP) expressing strain (control) and a thiosulfinate-tolerant strain of PA (PNA 97-1R; wild-type [WT]). Across all experiments, expression of GFP in PA PNA 97-1R ∆alt consistently showed the lowest growth in the inoculated onion juice (OJ), indicating poor thiosulfinate tolerance.
In contrast, a positive control, PA PNA 97-1R WT, showed robust growth. Irrespective of altC/altE pairs from different bacteria, heterologous expression in PA PNA 97-1R ∆alt resulted in increased tolerance to thiosulfinate in this bio-assay assay. The altC/altE pairs for bacteria that were closer to PA phylogenetically (Erwinia persicina CFBP8795, Rahnella aquatillis Ra9-2) tended to result in improved restoration of thiosulfinate tolerance to PNA 97-1R ∆alt compared with those that were phylogenetically distant (Paenibacillus nuruki TI45-13ar, Burkholderia gladioli BCC1802, and Novosphingobium sp. Chol11). However, an exception in this trend was observed with Gluconobacter kondonii (Dm-54). Despite its relative closedness with PA phylogenetically, the altC/altE heterologous expression in PA PNA 97-1R ∆alt did not result in consistent growth in our OJ bio-assay, indicating comparatively lower tolerance to thiosulfinates (Fig. 6A through C and E). In addition, Cronobacter dubliensis (cro910B3) showed weaker tolerance but more robust tolerance than that of G. kondonii (Dm-54) despite its relative closedness with PA phylogenetically. Overall, while all altC/altE pairs conferred increased thiosulfinate tolerance, the quantitative performance of individual altC/altE pairs was not easily predicted based solely on their phylogenetic similarity (Fig. 6D).
Thiosulfinate tolerance was enhanced in Pantoea ananatis when transformed with altC/altE pairs from diverse bacterial genera and their phylogenetic relationship among each other. Thiosulfinate tolerance of Pantoea ananatis PNA97-1 ∆alt was enhanced when transformed with altC/altE pairs representative of different bacterial genera and species conducted across three experiments, as well as their phylogenetic relationships. The top 3 bar charts in Fig. 6A through C represent three independent experiments, I, II, and III, respectively, with mean and standard error bars. The x-axis represents P. ananatis PNA 97-1R ∆alt transformed with altC/altE pairs from representatives of different bacterial genera and species and controls (empty vector and water), while the y-axis shows the mean AUC values. Statistical groupings are denoted by letters above the bars, with “A” representing the group with the highest tolerance. Subsequent letters (B, C, D, E…) indicate progressively lower tolerance, based on Tukey’s honestly signifcant difference (HSD) test results, with differences considered statistically significant at P < 0.05. The negative control and GFP consistently show the lowest tolerance and are colored grey, whereas P. ananatis PNA 97-1R WT and its variants exhibit the highest tolerance. Figure 6D depicts the phylogenetic relationships among the tested altC/altE pairs in transformed P. ananatis from diverse bacterial genera and species, with branch lengths representing gene sequence distances. The color coding of the transformed P. ananatis strains with different altC/altE pairs matches the bars in the bar charts displayed above, providing a visual correlation between genetic similarity and thiosulfinate tolerance. Strain names were truncated for ease of visualization. For an alternative analysis of growth curve patterns across all experiments, please refer to the Euclidean distance tree in Fig. S3. Figure 6E shows a visual comparison of bacterial growth (in terms of turbidity) of P. ananatis PNA 97-1R ∆alt transformed with altC/altE pairs from the following bacterial strains: 1: Priestia aryabhattai LAD; 2: Novosphingobium sp. Chol11; 3: GFP; 4: Pseudomonas spp. Root569; 5: Stenotrophomonas maltophilia CV_2003_STM1; 6: Burkholderia gladioli BCC1802; 7: Pseudomonas fluorescens PS838; 8: Rahnella aquatilis Ra9-2; 9: Vibrio coralliilyticus 09-121-3; 10: P. ananatis PNA 97-1 (WT, non-transformed); 11: Pseudomonas syringae DC3000; 12: Paenibacillus nuruki T145-13ar; 13: Gluconobacter kondonii Dm-54; 14: Erwinia persicina CFBP8795; 15: Cronobacter dublinensis cro91083, and NC: negative control.
A hierarchical clustering analysis was conducted based on the Euclidean distance of the growth curves from the experiments to provide a comprehensive view of the growth response patterns across different bacterial strains. This analysis categorized the bacterial strains into clusters based on their growth response to thiosulfinate exposure. The hierarchical clustering dendrogram revealed distinct clusters, with each branch representing a similarity in growth responses among the strains. A distinct cluster formed by G. kondonii (Dm-54), C. dublinensis (cro910B3), and P. nuruki (TI45-13ar) indicated unique growth response profiles, which was supported by the unexpectedly poor performance of G. kondonii (Dm-54) and variability in responses from both C. dublinensis (cro910B3) and P. nuruki (TI45-13ar). A second significant cluster included E. persicina (CFBP8795) and PA PNA97-1R WT, which showed similar growth curves when compared to the remaining strains. These results were supported by the consistent high performance of the E. persicina (CFBP8795) altC/altE pair. The next group consists of similarly performing strains with altC/altE pairs from Pseudomonas sp. (Root569), Rahnella aquatilis (Ra9-2), Novosphingobium spp. (Chol11), Priestia aryabhattai (LAD), and S. maltophilia (CV_2003_STM1) with P. ananatis (PNA 97-1R) placed in an intermediate rating with the previous group. These results are supported by the consistently high, but not as high, performance of P. ananatis (PNA 97-1R) when compared to E. persicina (CFBP8795), but not as variable as the remaining members of the group. Vibrio coralliilyticus (09-121-3), B. gladioli (BCC1802), P. syringae pv. tomato (DC3000), and P. fluorescens (PS838) are the final group. As expected, the GFP strain is positioned near the negative control, reinforcing its minimal growth and low tolerance to thiosulfinates because it lacked alt genes. The hierarchical clustering analysis provides a comprehensive view of the growth response patterns across different bacterial strains. It aligns with the tolerance experiments and phylogenetic analysis findings, demonstrating their similar growth profiles and tolerance mechanisms independently of protein sequence content or lineage.
Binding affinity prediction with AI-Bind of altR demonstrates NLP-like techniques are effective for predicting and classifying alt and alt-like proteins
To determine if NLP-like techniques for binding affinity prediction could be used to help differentiate between functional alt clusters and possible pseudo clusters, we utilized AI-Bind to screen our altR protein sequences against a library of small molecules collected from PubChem focusing on sulfur compounds (File S2 at https://figshare.com/articles/preprint/Large_i_alt_i_supplement_files/27016423/3?file=49178374). Due to the likelihood of noise among most of these binding predictions, rows within 0.001 similarity were extracted for individual assessment. Among the values extracted, several similarities among the columns can be seen, and these 28,481 predictions may be the primary drivers for the separations seen with the Levenshtein distance matrix. When the distance matrix is overlaid with the gene synteny plot and compared to the altR RAxML tree, it appears that the results generated from AI-Bind are capable of sorting altR proteins into their appropriate gene synteny groups. In addition, when integrating the findings with those from the experimental validation experiments, there is a pronounced division between alt clusters with robust phenotypes and those exhibiting weaker phenotypes. These results indicate that the results from AI-Bind could also sort altR proteins into groups that reflect the thiosulfinate tolerance of their respective altC/altE pair. As such, the binding predictions that AI-Bind produced may be helpful in further methodologies to automate the detection and distinction of alt, alt-like, and pseudo-alt proteins. This pattern further supports the notion that most, if not all, of the DeepBGC-identified representative alt-like clusters in this study are capable of functioning similarly to alt, a conclusion reinforced by the experimental validation results (Fig. 7).
Comparison between gene synteny, protein similarity, and binding affinity prediction. Here are two schematic representations (A and B) that map the relationship between gene synteny alongside protein sequence similarity (A) and between protein binding affinity predictions with corresponding protein sequences (B). In panel A, the branching lines are color-coded to distinguish between different gene synteny groups, which are identified as follows: pink for group I, green for group II, blue for group III, and purple for group IV, as previously defined in Fig. 2. Panel B contrasts the predicted binding affinities, as calculated by AI-Bind, of altR proteins against the similarity of the altR sequence. The coloration corresponds to the phenotypic data obtained from follow-up experimental validation, as described in Fig. 6, with the applied color serving as the “average” RGB value of the three colors. The originally described Pantoea ananatis PNA 97-1R and Burkholderia gladioli BCC 1802 are included directly for comparison as the DeepBGC extracted sequence was not precisely the same.
DISCUSSION
Identifying alt and alt-like clusters poses challenges concerning variable gene synteny and divergent sequence similarities across bacterial genera. Specifically, “alt clusters” refer to gene clusters experimentally validated to exhibit the thiosulfinate tolerance phenotype. Meanwhile, “alt-like clusters” resemble these gene clusters in genetic composition but lack experimental validation for the associated phenotype. “Pseudo alt clusters,” on the other hand, have been experimentally shown to not possess the phenotype despite their similarity in appearance to alt clusters. The three gene clusters utilized in our training set show little gene and protein sequence similarity and do not share overall gene synteny. Our analysis found a limited set of seven genes shared among our lab-validated gene clusters, with notable variations in gene and protein sequence similarities—highlighting the altB reductase in the SDR family oxidoreductase family as the most conserved element across these clusters. The observed sequence similarities range significantly, suggesting a nuanced spectrum of conservation and divergence within these gene clusters. Interestingly, despite the diversity in sequence similarity, the predicted protein structures demonstrated a surprising level of uniformity according to I-TASSER system evaluations. This uniformity, especially in the context of different pathogens from onion, underscores a potentially ancient divergence and pseudo-vertical transmissibility for this horizontally transferred region.
Current alt clusters have been identified experimentally or predicted intuitively based on gene co-localization and annotation. However, this approach is difficult to rigorously codify and could lead to significant discrepancies between investigators. Furthermore, we do not have a collection of pseudo*-alt* clusters to provide a comparison, exacerbating the difficulty in describing an actual alt cluster. Computational strategies, such as artificial intelligence methodologies like machine learning or deep learning, offer more sophisticated ways to “digitize” intuition for dissemination. In this work, we utilized an NLP-like method to generate a model capable of data mining these complex gene clusters with an unconventional training set of only three divergent validated gene clusters and, by extension, make a transition from bespoke manual curation of alt clusters into a streamlined process.
NLP in biology is becoming a valuable tool in studying gene function. There is a significant volume of genes that have an unknown function. By extension, we cannot access these genes’ full potential for biotechnology, agriculture, and medicine. In prokaryotes, for example, genes with a complementary function tend to group into biosynthetic gene clusters (14–16, 27). Relevant biosynthetic gene clusters can be detected and datamined by focusing on higher-order information and gene proximity. In this work, we used DeepBGC to train a model of our three previously validated alt clusters to overcome the limitations with more traditional sequence-only methods for data mining gene clusters, as well as explore the utilization of these techniques for identifying patterns that can be useful for identifying these clusters more robustly. DeepBGC utilizes Pfam information rather than the amino acid sequence to classify BGCs, with the additional caveat of understanding the importance of gene localization in gene clusters (24).
Utilizing vectorized Pfam domains and gene localization elegantly simulates our intuitive process to curate gene clusters and produces a tangible model that is more appropriate for rigorous scientific evaluation. Sequence-based methods, such as BLAST, had been insufficient for data mining these clusters across multiple genera due to low sequence similarity. However, the methodology utilized by DeepBGC produced a model that can successfully detect alt clusters reproducibly from diverse genera of bacteria. In an ideal scenario, a bioinformatician would have access to thousands of examples for their training set. In this study, we only had access to three validated examples of alt clusters from PA, BG, and PTO. Despite this, we were able to successfully detect, retrieve, and validate several alt clusters that were previously undetectable. This methodology also alleviates the immense effort required to screen this expansive list of bacterial genomes. Utilizing NLP technologies in a biological context is a powerful tool for “standardizing” the intuitive extraction process.
We acknowledge that using the model provided in the supplementary materials, with a training set of only three clusters, is too broad to filter out background noise effectively. For example, our analysis incorrectly identified several gene clusters simply due to the presence of several tandem thioredoxin-related genes. Additionally, other clusters were mistakenly detected due to the presence of multiple copies of tetR-family repressor genes, leading to false classifications. Furthermore, some datamined alt clusters would lose genes on the terminal ends of their gene cluster, but the same cluster from another genome would contain the entire expected sequence. This issue is resolved by running the model multiple times and determining the “average” cluster sequence. However, these types of errors are commented upon in the DeepBGC manuscript and are to be expected (24). As always, manual curation should be employed to ensure that AI models behave appropriately. While not implemented in this study, future iterations may benefit from model explainability tools such as attention maps or Pfam importance scoring to enhance interpretability and guide manual curation. In addition, unsupervised clustering or dimensionality reduction may also prove useful in identifying conserved functional domains or novel subclasses of tolerance clusters. Despite the occasional error in incredibly diverse genomes, when the model is run on the genome of an onion pathogen with a known alt cluster, DeepBGC always performed the expected extraction. Additionally, applying this workflow to randomized genome subsets in future studies may help further quantify the baseline rarity of alt-like clusters and clarify the practical utility of NLP-based screening approaches.
We utilized another text-comparison technique to compare gene synteny. The complexity of the alt clusters often overwhelmed traditional DNA sequence-based methods, frequently leading to system failures in organizing the information. However, by converting from one language to another and calculating the Levenshtein distance matrix, we successfully organized gene clusters into gene synteny groups quickly and reliably. The Levenshtein distance matrix is the “edit distance” between two strings. These are insertions, deletions, and substitutions (28, 29). We cut down the computational time and simplified the visualization process by converting our gene clusters into a color code and then a string representing these color codes. The application of language processing techniques is not limited to complex AI modeling or requires expensive computational equipment to be helpful. By applying the Levenshtein distance matrix, we can initiate the classification of alt clusters based on higher-order information, such as guilt-by-association syntax, in a comprehensive manner. Although the alt cluster exhibits many characteristics typical of horizontally transferred gene clusters, it appears to be maintained vertically within several bacterial genera. Despite this, gene synteny is not unique across bacterial genera, as specific gene patterns recur across multiple genera even if their sequence content is different.
When comparing the gene synteny to the experimental validation of altC/altE pairs, it appears that the altC/altE pairs from the first terminal group have more robust thiosulfinate tolerance restoration phenotypes than altC/altE pairs from other terminal groups. These alt clusters are also represented among many members of the enterobacteria; however, alt-like clusters from Erwinia/Pantoea displayed the strongest phenotype. A notable caveat with this methodology is that the strongest phenotype is observed when these clusters are expressed in Pantoea, potentially due to interactions and dependencies with other endogenous host factors. Based on the current information, gene cluster synteny alone is insufficient for comprehensively categorizing alt-like clusters. These results are unsurprising, as genes with distinct evolutionary histories can independently form gene clusters with similar synteny. However, repeating motifs among several gene clusters is a strong indication of collaboration for a phenotype, and we would argue that the guilt-by-association of these shared genes is still a substantial factor in identifying alt-like clusters, even if their motifs are not perfect indicators of alt-like phenotype performance in OJ.
In drug discovery, the conformation and 3D structure of molecules are critical, as small molecules must fit into a binding pocket of a target protein with a favorable reaction. Similarly, proteins that yield similar phenotypic functions are expected to have comparable shapes, regardless of their sequence similarity (30). This work explored the potential for predicted protein conformation to indicate the alt phenotype. The results of the altC/altE pair validation suggest that the 3D superimposition of our putative alt-like proteins to the alt-verified proteins may indicate qualitative but not quantitative phenotype. Perhaps a proteomic profile to compare proper alt and pseudo-alt proteins is necessary, as our validation experiment showed all selected altC/altE pairs provided thiosulfinate tolerance, with some exception to the pair derived from Gluconobacter kondii (Dm-54).
For example, when interpreting our phenotypic validation results in the context of our 3D superimposition, it is essential to note that the altC/altE pair from Priestia aryabhattai LAD (NZ_CP072478.1) exhibited a more robust thiosulfinate tolerance restoration phenotype compared to Pseudomonas sp. Root569 (NZ_LMGQ01000029.1), despite the latter with higher Zeal scores. This observation suggests that while structural similarities generally correlate with functional outcomes, exceptions highlight the complexity of phenotype-genotype relationships. Furthermore, altC variants with Zeal scores greater than 0.98 consistently supported more robust bacterial growth in our thiosulfinate tolerance growth assay, implying a potential threshold effect where high structural fidelity may enhance certain functional capabilities. Conversely, altE adds another layer of complexity; Priestia aryabhattai LAD (NZ_CP072478.1), with a lower Zeal score of only 0.69, showed a slightly stronger thiosulfinate tolerance restoration phenotype than Novosphingobium sp. Chol11 (NZ_OBMU01000004.1), which had a higher Zeal score of 0.94.
Additionally, our comparison of the E. coli nemR repressor with the four altR sequences in the genomes used for our training data set revealed high similarity in their 3D protein structures. The nemR repressor in E. coli shows ranges from 0.88 to 0.94 similarity. In contrast, the other four exhibit similarities ranging from 0.92 to 0.98. This level of resemblance is expected, given that they all are annotated as tetR repressors. The nemR repressor in E. coli is assumed to be responsive to reactive chlorine (bleach) and nitrogen species (31). As such, we find the protein shape to be helpful in providing a secondary opinion for the protein predictions, as apparent outliers can be screened independent of annotations but alone cannot be used to separate functional alt proteins from possible pseudo-alt proteins. These findings underscore the limitations of relying solely on structural predictions to infer functional characteristics, highlighting the need for more complex integrated approaches to classify alt and pseudo-alt proteins. This opinion is reinforced by the results of the AI-Bind screen, where we assessed if screening potential binding affinity of proteins to a set of organo-sulfur molecules could differentiate alt-like clusters.
We utilized AI-Bind to evaluate the predicted binding affinity of altR sequences against a library of 381,350 small molecules. We then calculated the string differences from a concatenation of the resulting scores to determine if the output could be informative for classification. Initially, the matrix generated from the AI-Bind average scores seemed discordant compared to the trees derived from protein sequence similarity. However, overlaying the AI-Bind prediction matrix with the data from the gene synteny matrix, as well as the result of the experimental validation, shows that binding affinity predictions from AI-Bind are capable of sorting altR proteins into groups that are reflective of our other screening methods, independently. These findings suggest that using average binding predictions may be an effective tool for further classifying alt clusters and separating alt and pseudo-alt proteins. It is important to note that AI-Bind, however, is not in and of itself utilized for the classification of proteins in this way and is only NLP-like in that it could classify based on sequence data rather than utilizing more traditional NLP-like systems.
Conclusions
NLP-like technologies are powerful tools to assist in the discovery and classification of gene clusters. Here, we generated a model capable of detecting and extracting alt clusters, validating the phenotype in transformed bacteria that previously lacked it. Despite its limited training set, the NLP-like algorithm used here demonstrated its capacity to identify several biologically relevant gene clusters. A model that quickly and accurately discovers and extracts alt clusters proves beneficial for diagnostic plant pathology and environmental bacteriology, particularly as the alt cluster is crucial for effectively colonizing Allium species or other thiosulfinate-producing hosts. The distribution of alt clusters beyond plant pathogens aligns with these secondary metabolites, shaping their microbial communities, as observed with the benzoxazinoid tolerance of maize root colonizers. Employing sophisticated NLP-like tools may revolutionize our understanding of critical gene clusters that facilitate complex host-microbe interactions, potentially leading to breakthroughs in several multidisciplinary fields. In developing a more robust alt cluster detection system, integrating models that encompass Pfam domains, gene localization, and predicted binding affinity might be sufficient to distinguish between alt clusters—those experimentally validated to function—and pseudo alt clusters, which appear similar but are experimentally validated not to possess the phenotype.
MATERIALS AND METHODS
alt gene cluster seed sequences
For this work, we used three validated alt clusters for DeepBGC training. Each cluster is distinct in both gene sequence and gene synteny. The 11-gene Pantoea alt cluster was used from Pantoea ananatis strain PNA 97-1R plasmid unamed2 (NCBI accession: PRJNA384061). The seven-gene Burkholderia alt cluster was used from Burkholderia gladioli pv. gladioli strain FDAARGOS_389, plasmid unnamed (NCBI accession: PRJNA231221). The Pseudomonas alt cluster was used from Pseudomonas syringae pv. tomato str. DC3000, complete genome (NCBI accession: PRJNA57967) (supplementary folder 2; https://figshare.com/articles/preprint/Large_i_alt_i_supplement_files/27016423/3?file=49178374).
Gene/protein sequence comparisons for validated alt clusters
To understand sequence similarity between validated alt genes, we performed multiple sequence alignments of protein and nucleic acid sequences at default settings using the Clustal Omega online server (32).
DeepBGC training and RefSeq screening
To determine if AI trained on higher-order information can assist in efficiently datamining alt-like clusters from a collection of genomes, we trained the DeepBGC model on our small sample size of three validated alt clusters. The alt detection model was trained using the author’s supplied negative data set “GeneSwap_Negatives.pfam.tsv” and ran with the default provided “deepbgc.json” with DeepBGC version 0.1.27. DeepBGC training on the initial three alt sequences was repeated 15 times, and the reports were compared to assess model performance. DeepBGC options on the database data mining included a minimum protein count of 4 and a minimum score of 0.9. RefSeq genomes were separated into 48 sub-directories of 5,000 genomes, and DeepBGC jobs were submitted to the UGA GACRC via an array element on the batch partition. We scanned 238,362 genomes using this model from the NCBI bacterial refseq database. The genomes were downloaded via the NCBI FTP service, and the assembly list is provided (File S3 and S4 at https://figshare.com/articles/preprint/Large_i_alt_i_supplement_files/27016423/3?file=49178374) (24).
Filtering gene cluster representation via MMseqs2
To compress the DeepBGC extractions into a smaller representation for analysis, we used MMseqs2 release 13-45111 to generate representative sequences. The options used were a query coverage of 90%, sequence homology of 75%, and connected component clustering. These options allow for a “core” representative sequence with leniency for small changes in gene presence or absence (33).
BLAST of NCBI GenBank for representative sequence diversity
The final selection of 47 representative alt-like clusters was utilized as the query sequence for both the collection of putative alt-like gene clusters from DeepBGC and NCBI GenBank, following similar rules to the MMseqs2 redundancy filtering. Recovered species were then counted and organized into a list for the calculation of the Shannon-Wiener index via our own Python script.
Gene synteny comparisons
During our manual curations of alt-like clusters, we noticed a pattern where gene synteny was conserved among bacterial genera. For those clusters, we generated cluster comparisons with sequence data, as the method for data mining was determinate upon them. However, post-DeepBGC screening of RefSeq, we found many alt-like clusters that share low enough sequence similarity between genes of similar annotation that several methods for cluster comparison would fail. To overcome this barrier, we assigned a color code to alt-like genes that received Pfam tags like our test run of the original test sequences. To optimize the human capacity to read the information and remove unintended bias between colors, we assigned several shades of green to alt-like genes and gray color to genes that are not relevant. We then used an Excel script to convert these colors into color codes. These codes were then concatenated into strings and underwent a Levenshtein distance matrix calculation using the Levenshtein and Dendropy Python packages (34, 35). After initial tree construction, further manual curation was applied to finalize alt-like representatives by selecting gene clusters with at least three unique alt-like Pfam tags that match those applied to the seed clusters and the removal of clusters that were split into separate contigs.
Generating 3D protein models and Zeal score comparisons
While the previous methods make gene comparisons primarily on sequence or trained guilt-by-association with higher-order information, we wanted to compare alt-like proteins for potential structure diversity or abnormalities directly. Models for select alt-like proteins were generated using I-TASSER 5.2 with the -LBS option set to true. Predicted protein 3D models were then compared using the Zeal GUI with global alignment (36, 37).
Protein-ligand binding prediction
The alt and alt-like mechanisms of action are currently unknown. However, it is reasonable to suspect that the binding interactions between chemicals and proteins would be essential in defining alt, alt-like, and pseudo-alt gene cluster classes. Due to the computationally expensive nature of drug-target binding predictions, we turned to using AI-Bind, a deep-neural network designed for a more generalizable prediction of binding between proteins and small molecules. A comprehensive list of small molecule SMILES and InChiKeys was downloaded from the PubChem database with the following search terms: “allyl, cysteine sulfoxide, disulfide, polysulfide, S-Nitrosothiol, sulfenic acid, sulfenic, Sulfimide, sulfinic acid, silfinic, sulfone, Sulfonic acid, Sulfonic, Sulfonium, sulfoxide, sulfoximide, Sulfurane, thiolaldehyde, thioamide, thiocarbonyl, thiocarboxylic acid, thioester, thio, thiosulfinate, 316263-glutamylcysteine, and s-Allylmercaptoglutathione.” The results were concatenated, and duplicate entries were removed for a final list size of 381,349 small molecules. In our final representative data set, these were then screened against the 53 altR-like proteins that received Pfam tags from DeepBGC. Binding results from the altR-like proteins were converted into strings and compared via the calculation of the Levenshtein distance matrix above to produce a neighbor-joining tree for ease of comparison (38).
altC/altE validation
To validate the representative alt-like clusters produced by DeepBGC, we conducted an OJ growth assay. Previous research has demonstrated that the presence of altC alone is sufficient to determine an alt phenotype. As such, we selected 14 altC genes (Table S2; https://figshare.com/articles/preprint/Large_i_alt_i_supplement_files/27016423/3?file=49178374) for validation, along with their potential altE partner if present. These 14 gene pairs (altC/altE) were inserted into Twist Bioscience’s pENTR plasmid and inserted into P. ananatis PNA 97-1^R^ Δalt by the following method (10).
Electroporation and confirmation
The recipient strain’s electrocompetent cells (P. ananatis PNA 97-1R WT and Δalt) were prepared using standard methods. Plasmid constructs were electroporated into the recipient cells at 1.8 kV. Transformed cells were mixed in 1 mL LB and left for incubation at 28°C for an hour. Post-incubation, cells were pelleted, resuspended in LB, and plated onto LB+Km plates. Individual transformed recipient cell colonies were grown overnight in LB+Km broth. Plasmids were extracted and sequenced to confirm the insertion of the pENTR plasmid constructs into recipient cells.
The plasmid pENTR::GFP served as an empty vector and was inserted into both PNA 97-1^R^ WT and Δalt strains, which acted as positive and negative controls for the onion juice growth assay. The remaining 14 plasmid inserts were transformed into PNA 97-1^R^ Δalt strains.
Preparation of onion juice extract
Onion juice was extracted using the juicer method (10). One yellow onion bulb (400 g–500 g) was processed through an industrial strength juicer, resulting in 300 mL–400 mL of crude onion extract. The extract was then centrifuged at 10,000 g for 1.5 hours at 4°C. After centrifugation, the supernatant was carefully removed and filtered through a Nalgene disposable vacuum filter sterilization unit. The onion juice was then stored at −20°C for future use.
Liquid growth assay
The growth assay used 100-well honeycomb plates with the BioScreen C system (Lab Systems Helsinki, Finland). Seven-day-old OJ was utilized for the assay. Sixteen bacterial strains culture was started on LB+Km plates, and overnight cultures were prepared the following day in LB+Km broth from single colonies. On the third day, the growth assay was conducted for 48 hours with low agitation at 28°C. The growth media consisted of LB supplemented with an equal volume of onion juice. The experiment included 16 test strains (Fig. 6), including PNA 97-1 WT pENTR::GFP and Δalt pENTR::GFP strains, and a negative control (LB+OJ). Each well contained 400 µL of a mixture comprising 360 µL of growth media (LB+OJ) and 40 µL of a bacterial suspension with an OD600 of 0.5 in sterile dH_2_O, with a minimum of five well replicates. Absorbance values were measured every 30 minutes for 48 hours. Then, the growth data were used to calculate the AUC. The assay was repeated three times, with each replicate as an independent biological replicate.
Euclidean distance comparison of treatment groups
CSV files generated from three growth phases from our experiment, the lag, log, and stationary phases, were used to compare Euclidean distances between the growth curves of each treatment group via a Python script. For each phase, mean trendlines were calculated by averaging the sample data for each treatment group. If trendlines varied in length, shorter sequences were padded with NaN values to match the most extended sequence in each phase. Euclidean distance matrices were generated using the pdist function from the scipy.spatial.distance module, with NaN values imputed using the SimpleImputer with a mean strategy. For each phase, pairwise distances were calculated between all samples, and the resulting distance matrices were saved as CSV files. The average distances within and between treatment groups were computed to create symmetric group-level distance matrices that represented the average pairwise Euclidean distances for each treatment group in each phase. Hierarchical clustering was performed on these group-level matrices using the linkage method with “average” linkage, and dendrograms were generated to visualize the clustering relationships between treatment groups. Dendrogram branches were color-coded according to predefined treatment groups to reflect their clustering pattern. The aggregated group average distances across all phases were calculated to compare the treatment groups’ growth patterns. A neighbor-joining tree for the combined data set was generated and saved for visualizing the clustering results (Fig. S3; https://figshare.com/articles/preprint/Large_i_alt_i_supplement_files/27016423/3?file=49178374).
Tree comparisons
Maximum-likelihood trees were compared against each other using the phytools R package (39). For Fig. 7, edges between the nodes were organized based on their color code.
The reference list from the paper itself. Each links out to its DOI / PubMed record.
- 1Lancaster JE, Collin HA. 1981. Presence of alliinase in isolated vacuoles and of alkyl cysteine sulphoxides in the cytoplasm of bulbs of onion (Allium cepa). Plant Sci Lett 22:169–176. doi:10.1016/0304-4211(81)90139-5 · doi ↗
- 2Rose P, Whiteman M, Moore PK, Zhu YZ. 2005. Bioactive S-alk(en)yl cysteine sulfoxide metabolites in the genus Allium: the chemistry of potential therapeutic agents. Nat Prod Rep 22:351–368. doi:10.1039/b 417639 c 16010345 · doi ↗ · pubmed ↗
- 3Eady CC, Kamoi T, Kato M, Porter NG, Davis S, Shaw M, Kamoi A, Imai S. 2008. Silencing onion lachrymatory factor synthase causes a significant change in the sulfur secondary metabolite profile. Plant Physiol 147:2096–2106. doi:10.1104/pp.108.12327318583530 PMC 2492635 · doi ↗ · pubmed ↗
- 4Leontiev R, Hohaus N, Jacob C, Gruhlke MCH, Slusarenko AJ. 2018. A comparison of the antibacterial and antifungal activities of thiosulfinate analogues of allicin. Sci Rep 8:6763. doi:10.1038/s 41598-018-25154-929712980 PMC 5928221 · doi ↗ · pubmed ↗
- 5Müller A, Eller J, Albrecht F, Prochnow P, Kuhlmann K, Bandow JE, Slusarenko AJ, Leichert LIO. 2016. Allicin induces thiol stress in bacteria through S-allylmercapto modification of protein cysteines. J Biol Chem 291:11477–11490. doi:10.1074/jbc.M 115.70230827008862 PMC 4882420 · doi ↗ · pubmed ↗
- 6Borlinghaus J, Albrecht F, Gruhlke MCH, Nwachukwu ID, Slusarenko AJ. 2014. Allicin: chemistry and biological properties. Molecules 19:12591–12618. doi:10.3390/molecules 19081259125153873 PMC 6271412 · doi ↗ · pubmed ↗
- 7Jones MG, Hughes J, Tregova A, Milne J, Tomsett AB, Collin HA. 2004. Biosynthesis of the flavour precursors of onion and garlic. J Exp Bot 55:1903–1918. doi:10.1093/jxb/erh 13815234988 · doi ↗ · pubmed ↗
- 8Curtis H, Noll U, Störmann J, Slusarenko AJ. 2004. Broad-spectrum activity of the volatile phytoanticipin allicin in extracts of garlic (Allium sativum L.) against plant pathogenic bacteria, fungi and Oomycetes. Physiol Mol Plant Pathol 65:79–89. doi:10.1016/j.pmpp.2004.11.006 · doi ↗