Oral and parenteral treatment with a third-generation cephalosporin promotes the proliferation of diverse ESBL-producing Escherichia coli in the chicken intestinal tract
Lázaro López, Melany Jumbo, Pamela Mosquera, Gustavo Donoso, Jay Graham, Gabriel Trueba

TL;DR
Using third-generation cephalosporins in chickens increases the spread and diversity of antibiotic-resistant E. coli in their intestines.
Contribution
The study reveals how 3GC treatment promotes proliferation and genetic diversity of ESBL-producing E. coli in chickens.
Findings
3GC treatment significantly increased resistant coliforms in chicken intestines.
Multiple distinct E. coli clones emerged, with high genetic diversity observed.
blaCTX-M-55 was the most abundant ESBL gene and showed evidence of horizontal transfer.
Abstract
The global rise of antimicrobial resistance is a major public health threat, with Escherichia coli facilitating the spread of extended-spectrum beta-lactamase (ESBL) genes like blaCTX-M, which confer resistance to third-generation cephalosporins (3GCs). This study examines the impact of 3GC treatment on resistant E. coli clones and horizontal gene transfer (HGT) of ESBL genes in broiler chickens in Quito, Ecuador. Fifteen-day-old Ross broilers were divided into three groups: oral ceftriaxone (100 mg/kg), parenteral ceftriaxone (100 mg/kg intramuscular), and control (no treatment). The study included three phases: baseline, antimicrobial administration (5 days), and recovery (15 days). Fecal cultures on McConkey agar, with and without ceftriaxone (2 µg/mL), measured the ratio of 3GC-resistant lactose fermenters. Regardless of the administration route, ceftriaxone significantly increased…
Genes, proteins, chemicals, diseases, species, mutations and cell lines named across the full text — each resolved to its canonical identifier and authoritative record.
Click any figure to enlarge with its caption.
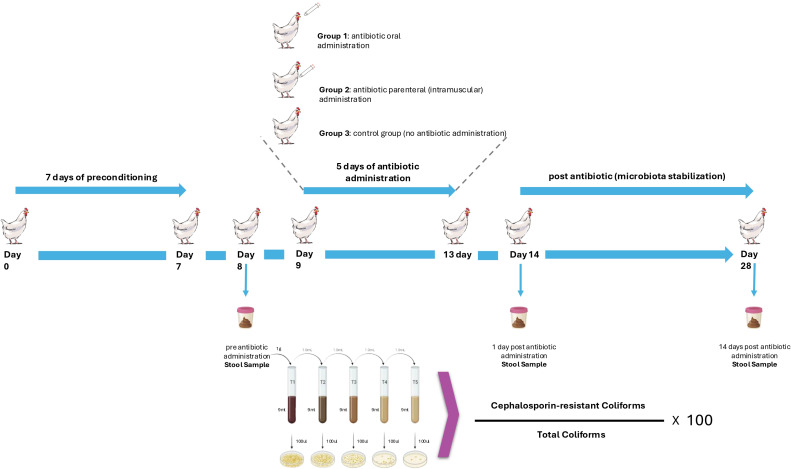 Fig 1
Fig 1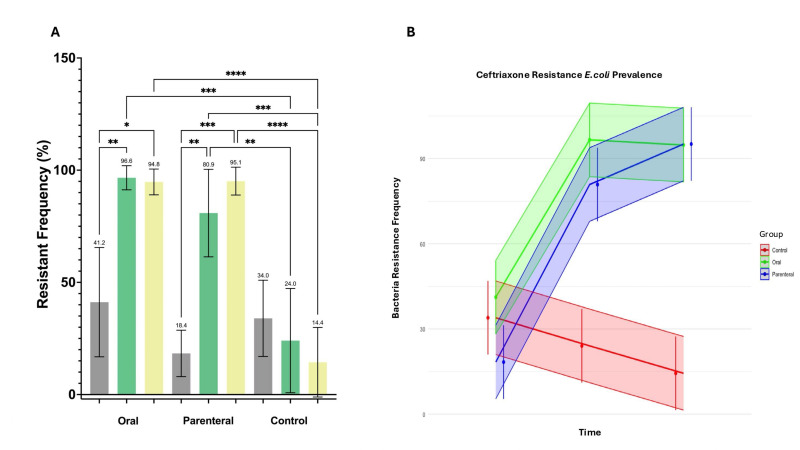 Fig 2
Fig 2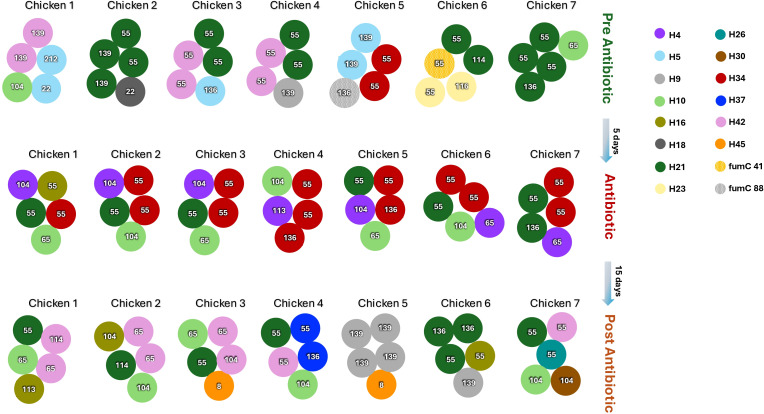 Fig 3
Fig 3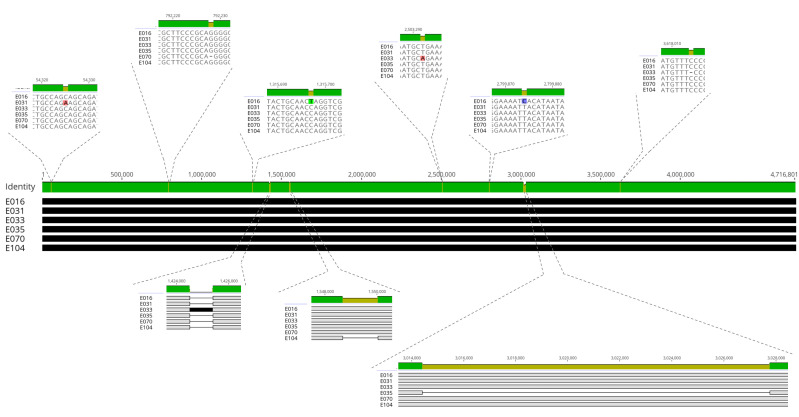 Fig 4
Fig 4| Sample_name | cgST | ST | Genome length (bp) | SNPs | Indels | Complex | ||
|---|---|---|---|---|---|---|---|---|
| E016 | 39,108 | 2,505 | H21 | 4,715,929 | Refseq | Refseq | Refseq | |
| E031 | 39,108 | 2,505 | H21 | 4,715,929 | 3 | – | – | |
| E033 | 39,108 | 2,505 | H21 | 4,716,800 | 3 | 1 | 1 | 872 bp insertion |
| E035 | 39,108 | 2,505 | H21 | 4,702,598 | 2 | – | 1 | 13,331 bp deletion |
| E070 | 39,108 | 2,505 | H21 | 4,715,928 | 2 | 1 | – | – |
| E104 | 39,108 | 2,505 | H21 | 4,714,593 | 2 | – | 1 | 1,336 bp deletion |
| E102 | 119,558 | 648 | H42 | 5,172,204 | 47,994 | 53 | N/A | N/A |
Peer Reviews
No public reviews on file for this paper yet. If you reviewed it on a platform where reviews are public (OpenReview, ICLR, NeurIPS, ICML), you can paste yours below so the community can read it here.
Videos
No videos yet. Explain this paper in a talk, walkthrough, or lecture? Add one.
Taxonomy
TopicsAntibiotic Resistance in Bacteria · Antimicrobial Resistance in Staphylococcus · Pharmaceutical and Antibiotic Environmental Impacts
INTRODUCTION
The global rise in antimicrobial resistance (AMR) represents a critical challenge for both human and veterinary medicine. AMR is a pressing public health threat that claimed an estimated 1.27 million lives worldwide and was associated with nearly 5 million deaths in 2019 (1).
Antimicrobial resistance genes are constantly transmitted in the intestine via horizontal gene transfer (HGT) (2); moreover, conjugation of some plasmids, carrying extended-spectrum beta-lactamase (ESBL) genes, increases under antimicrobial pressure (3). Among the organisms of concern, Escherichia coli is the most common facultative anaerobe in the intestine of warm-blooded animals (4). This bacterium is primarily a commensal that is frequently implicated in the transmission of resistance genes to pathogenic bacteria (5).
One of the most concerning AMR genes that are being transferred by E. coli is the ESBL gene, such as the blaCTX-M family, which confers resistance to third-generation cephalosporins (3GCs). These genes have been increasingly disseminated since the 1990s to today and are the most dominant 3GC resistance genes (6–9).
It has been observed that humans and domestic animals carry different clones of E. coli in the intestine at any time (10–12), and some of these clones may have 3GC resistance genes. Additionally, E. coli clones in the intestine often have a high rate of turnover (12–14). This study set out to understand how treatment with 3GCs alters the frequency of naturally occurring 3GC-resistant E. coli clones in the intestine and whether the treatment route (oral vs parenteral) has differential impacts on levels of resistance in the intestines. In this study, we used commercially sold chickens in Quito-Ecuador, which are known to naturally carry 3GC-resistant E. coli (15), to study the effect of 3GC administration over the population of 3GC-resistant E. coli in the chicken intestinal tract. We used plasmid sequencing to investigate the HGT of some of these resistance genes within the chicken intestinal tract.
MATERIALS AND METHODS
Experimental design and animal groups
The study was conducted using Ross broiler chickens (15 days old) that were housed in a controlled environment. Twenty-one chickens were divided into three groups (seven in each group): (i) oral ceftriaxone group: received ceftriaxone orally at 100 mg/kg dose (16); (ii) parenteral ceftriaxone group: administered ceftriaxone intramuscularly at same dose; and (iii) control group: received no antimicrobial treatment. The experiment spanned three phases: pre-administration (baseline), antimicrobial administration (5 days), and post-administration recovery (15 days; Fig. 1). Chickens were placed in spacious cages according to the poultry handling methodology proposed by the European Union (17). Each cage had a minimum height of 35 cm and an area of 750 cm^2^ per chicken, with bars spaced no more than 2 cm by 15 cm to prevent leg injuries. The cages were designed to allow droppings to fall through to a plastic tray, avoiding accumulation on the bars or the chickens’ legs. Feed and water were provided ad libitum using standardized feeders and drinkers. The chickens were fed ground corn free of antimicrobials and growth promoters. Each group was housed in a 1 m^2^ cage, with seven chickens together.
Diagram of the experimental design, highlighting sampling time points: (i) before ceftriaxone administration, (ii) 1 day after completing a 5-day ceftriaxone treatment, and (iii) 15 days after treatment.
Isolation and single-gene typing of E. coli isolates
Fecal samples were collected at each time point and processed to isolate coliform bacteria using MacConkey Lactose Agar (MKL) supplemented with 2 µg/mL of ceftriaxone, a 3GC, following standard protocols for selective isolation (18).
To assess the ratio of third-generation cephalosporin-resistant coliform bacteria in the intestinal microbiota, fecal samples were serially diluted in 0.9% sterile saline and spread-plated onto both MKL without antimicrobials and MKL supplemented with ceftriaxone (2 µg/mL). The initial dilution was prepared by weighing 1 g of feces and diluting it in 9 mL of sterile saline, resulting in a 10^−1^ dilution, followed by subsequent serial dilutions. Each dilution was plated in triplicate on both antimicrobial-free and antimicrobial-supplemented MKL. Plates were incubated at 37°C for 24 hours, and the ratio was calculated by determining the number of resistant bacterial colonies (CFU/mL) grown on antimicrobial-supplemented medium over the total bacterial colony count (CFU/mL) grown on antimicrobial-free multiplied.
The numerically dominant E. coli was identified by randomly selecting five E. coli colonies per sample (19). These lactose-fermenting colonies were then re-streaked on Chromocult Coliform Agar (Merck, Germany) to confirm a typical E. coli phenotype based on β-glucuronidase activity (4-methylumbelliferyl-β-D-glucuronide [MUG]-positive). We also amplified and sequenced the E. coli fliC gene (see below) from all these isolates. From each sample, five 3GC-resistant colonies with the characteristic E. coli phenotype were selected for additional analysis.
A total of 105 3GC-resistant E. coli isolates were screened for clonality using the fliC gene (encoding the E. coli flagellin protein) (14). This gene was amplified as previously described (20), and PCR products were purified and sequenced by Macrogen (Seoul, South Korea) using Sanger sequencing technology. Using SerotypeFinder 2.0, we determined the H alleles of each E. coli strain.
We used a PCR protocol to amplify 3GC resistance genes (blaCTX-M, blaTEM, blaSHV, and blaOXA) (21) and found that the blaCTX-M gene family was responsible for the resistance in all of the isolates. The PCR products were sequenced by Macrogen (Seoul, South Korea) as described above, and the resulting sequences were analyzed using ResFinder 4.1 (22) and the NCBI Bacterial Antimicrobial Resistance Reference Gene Database (23) for subtype identification.
Extraction of genomic and plasmid DNA
Some suspected E. coli clones and isolates sharing the same blaCTX-M gene in the same chicken were whole genome sequenced to investigate horizontal gene transfer. Total DNA was extracted from bacterial isolates using the DNeasy Blood and Tissue Kit (Qiagen, Hilden, Germany) following the manufacturer’s standard protocol for bacterial isolates. This method consistently yields high-quality genomic DNA suitable for molecular analyses. Plasmid DNA was isolated using the ZymoPURE II Plasmid Midiprep Kit (Zymo Research, Irvine, CA, USA) according to the manufacturer’s instructions. DNA concentration and purity were measured with a NanoDrop spectrophotometer (Thermo Fisher Scientific, Waltham, MA, USA) and a Qubit 4 Fluorometer (Thermo Fisher Scientific, Waltham, MA, USA), allowing for precise quantification of both total genomic and plasmid DNA.
Whole-genome sequencing and comparative analysis
Whole-genome sequencing (WGS) was performed on seven isolates that shared the same fliC gene to confirm clonality (E016, E031, E033, E035, E070, E102, and E104). Libraries were prepared using the Ligation sequencing gDNA - Native Barcoding Kit 24 V14 SQK-NBD114.24 (Oxford Nanopore Technologies, Oxford, UK) and sequenced on the Oxford Nanopore GridION platform, flow cell (R10.4.1), following the manufacturer’s protocols.
We performed de novo assembly of the raw reads, which were first quality checked using NanoPlot, filtered using Filtlong, and subsequently assembled using Trycycler (v0.5.5), which integrates assemblies generated with Flye (v2.9), Minimap2 (v2.26), and Raven (v1.8.1) to produce high-quality consensus assemblies (24). Genome annotation was performed using Prokka (v1.14.6) and Bakta (v1.7), ensuring accurate identification of coding sequences, functional genes, and genomic features (25, 26). Genome alignments were conducted using Minimap2 and analyzed in Geneious Prime (Biomatters, Auckland, New Zealand) to assess structural variations and conserved regions (27). Summary statistics of the sequencing data, including read length, coverage, and quality metrics, are presented in Table SII.
Single nucleotide polymorphisms (SNPs) were identified using Snippy (v4.6.0), with isolate E016 as the reference genome for comparative analysis. To further classify the bacterial genomes, multilocus sequence typing and core multilocus sequence typing were performed to determine sequence types (STs) and core sequence types (cSTs), respectively, providing insights into the genetic relationships and evolutionary patterns of the isolates (28).
Plasmid characterization and comparative analysis
Plasmid sequences were annotated to identify replicon types, resistance genes, and insertion sequences using PlasmidFinder (v2.1), ResFinder (v4.1), and ISFinder databases, respectively (29–31). Plasmid multilocus sequence typing was performed to classify plasmid sequence types, providing insights into their diversity and evolutionary history (29). Comparative sequence alignments of plasmids were performed using MAFFT (v7.475) and Geneious Prime (Biomatters, Auckland, New Zealand), enabling the detection of structural variations, resistance cassettes, and other genomic features associated with antimicrobial resistance (32).
Statistical analysis
Data were analyzed using one-way analysis of variance followed by post-hoc Tukey’s test for multiple comparisons to assess significant differences in bacterial resistance frequencies between the treatment groups (oral, parenteral, and control). For the analysis of changes over time, a linear mixed-effects model was fitted using restricted maximum likelihood. A significance level of P < 0.05 was considered statistically significant. All statistical analyses and data visualizations were performed using GraphPad Prism (version 10), and the linear mixed model was implemented using the lme4 and lmerTest packages in R.
RESULTS
Ceftriaxone administration route effect
The routes of ceftriaxone administration (oral and parenteral) led to an increase of ceftriaxone-resistant E. coli in chickens’ intestines (Fig. 2). Interestingly, the 3GC-resistant E. coli ratio was high even before the treatment, with a total mean of 31.16% ± 4.59%, with some chickens showing up to 60% of coliform 3GC resistance. Five days of ceftriaxone administration caused an increase in resistance to 96.61% ± 2.19% of the intestinal coliforms in the oral route and 80.88% ± 7.97% in the intramuscular route. The resistance rate remained elevated, 94.77% ± 2.35% and 95.13% + 2.54%, in the animals receiving orally or intramuscularly, 15 days after the ceftriaxone administration was ended. This indicates that the majority of E. coli in the intestinal tract of chickens continue to be resistant following antimicrobial administration, irrespective of the route of delivery. The comparison between administration routes oral or parenteral did not show any statistically significant results (P value of 0.459 and 0.924, respectively). In control animals with no antimicrobial administration, the resistance rate decreased to 24.04% ± 9.49%, suggesting that the effects found in the groups receiving antimicrobials were a result of this and not some other uncontrolled factor.
E. coli ceftriaxone resistance ratio: (A) represents the E. coli resistance frequency by treatment group and time, and bars represent the mean and 95% confidence intervals. Above each bar, the exact value of the mean frequency of each one is numbered. Lines represent Kruskal-Wallis tests with an uncorrected Dunn’s multiple comparisons post hoc test and a 95% confidence interval. Asterisks indicate differences between bars showing statistical significance (P ≤ 0.05). The number of asterisks represents different P values: <0.05 (), <0.005 (), <0.0005 (), and <0.0001(**). (B) represents the mixed effect model of the data where the thick lines represent the trend in frequencies of E. coli resistant to ceftriaxone and the shaded lines the 95% confidence interval of the data.
Population dynamics of ceftriaxone-resistant intestinal E. coli in the oral administration group
Single gene typing revealed significant clonal diversity in ceftriaxone-resistant E. coli isolates, with an average of three different clones out of five isolates obtained per animal fecal sample (mean = 3.43 ± 0.19) and ranging from two to five different clones in different animals. The diversity of clones was similar during treatment with an average of 3 (mean = 3.86 ± 0.26) ranging from 3/5 to 5/5 and a post-treatment average of 3 (mean = 3.71 ± 0.36) ranging from 2/5 to 5/5 (Fig. 3). Surprisingly, we did not observe any proliferation of a 3GC-resistant clone detected prior to the treatment. A distinct lineage (H34 = red) was observed exclusively during the antimicrobial administration period. After ceftriaxone treatment, new isolates emerged: H45, H26, H37 (Fig. 3).
Diagram illustrating the dynamics of ceftriaxone-resistant intestinal E. coli populations in the oral antimicrobial administration group. Each circle represents an E. coli isolate, with the color of the circle indicating the fliC gene allele, and the numbers inside the circle correspond to the blaCTX-M gene variant.
Diversity of blaCTX-M gene
All ceftriaxone-resistant isolates harbored blaCTX-M genes. Screening for blaTEM, blaSHV, and blaOXA genes was also performed; these genes were not detected except in a few cases where blaTEM was found alongside blaCTX-M. We found a total of 11 blaCTX-M gene variants in all the animals. blaCTX-M-55 was the most abundant blaCTX-M variant (47/105), followed by blaCTX-M-104 (14/105), and blaCTX-M-65 and blaCTX-M-139 (11/105, both). Upon analyzing the diversity and abundance of blaCTX-M variants over time, we observed a total of nine allelic variants (ranging from 2 to 5 in the five isolates obtained per animal fecal sample) before treatment, and a total of five allelic variants during treatment ranging from 3/5 to 4/5 per animal fecal sample (Fig. 3). Despite these fluctuations, blaCTX-M-55 remained the most abundant variant throughout the study; initially, it accounted for more than 50% of the population, maintaining this proportion during antimicrobial treatment, before dropping to nearly 30% by the end of the study. Of the total 35 isolates (five per chicken from seven chickens at each time point), variants blaCTX-M 65 and blaCTX-M 104 accounted for only 1% of the isolates before treatment. Their frequency increased to 20% during treatment and stabilized at 17% by the end of the study.
Features of plasmids carrying the blaCTX-M-55 variant gene
To determine horizontal gene transfer, we sequenced the plasmids of seemingly different clones (single gene typing) with the same blaCTX-M allele in the intestine of one animal at one time point (isolates E031, E033, E035, E070, E102, and E104 in animal 7; isolates E016 and E018 in animal 4; and isolates E022, E023, E056, and E057 in animal 5). Comparative analysis of plasmids showed that most of the plasmids were different; however, plasmids carrying blaCTX-M-55 were identical in two genetically different isolates, E070 and E102. Both isolates were obtained from the same host (chicken), with E070 isolated 15 days before E102, which suggests a possible horizontal plasmid transfer (Fig. S2A); however, we were not able to demonstrate conjugative capabilities in these plasmids because they lack some of the tra genes (data not shown).
Most of the plasmids belonged to the IncFII incompatibility group (pHN7A8); however, we identified plasmids with IncX1 and IncN replicons and some combinations of IncFII and IncX1 (Table 1; Fig. S2). Three distinct genetic environments (brackets) associated with blaCTX-M-55 were identified, with brackets 1 and 2 being the most prevalent (Fig. S1). In E. coli strain E067, two 3GC-resistant plasmids were detected: one carrying bracket 3 and another containing a duplicated bracket 2 flanking bracket 3 (Fig. S1D). This last strain exhibited a complex plasmid structure with duplication of bracket 2 and a single copy of bracket 3, resulting in an increased number of blaCTX-M-55 copies.
Whole-genome sequences of E. coli isolates H21 lineage harboring IncFII(pHN7A8) plasmids carrying blaCTX-M-55
Six isolates with identical fliC gene sequence were selected for whole-genome sequencing: E016, E031, E033, E035, E070, E104, and E102. We also sequenced isolate E102, which belongs to a different lineage but harbors the same plasmid identified in isolate E070 (Table 1). The isolates carried the same fliC H21 allele and shared similar genome lengths, ranging from 4,704,929 bp to 4,716,800 bp. Comparative WGS analysis of isolates E070 and E102 confirmed that they were distinct E. coli clones, as they displayed different cSTs and STs. This finding indicates a potential horizontal transfer event between isolates E070 and E102, probably within the intestine of this chicken (both isolates were obtained from the same host chicken), with isolate E070 being isolated 15 days prior to isolate E102. Additionally, genomic analysis of the six other isolates (E016, E031, E033, E035, E070, and E104) confirmed that they represent variants of the same E. coli clone (2–3 SNPs). Despite E016 originating in a different chicken than the others, all six isolates shared the same core ST and ST, and their alignment (Fig. 4) showed high genetic similarity. To further investigate, SNIPPY was employed using isolate E016 as the reference genome. The results revealed that these isolates differed by only 2–3 SNPs. However, isolates E033, E035, and E104 also exhibited insertions and deletions (indels). Two single base-pair (1 bp) deletions were identified in isolates E033 and E104, respectively. Additionally, three complex indel events were observed in these three isolates. Complex indels were defined as insertions or deletions greater than 100 bp (Table 1). In contrast, isolate E102, which belonged to a different lineage (H42), had a significantly larger genome (5,172,204 bp) and exhibited 47,994 SNPs and 53 indels.
Whole-genome alignment of six E. coli isolates carrying the fliC H21 allele.
We also annotated the whole genomes of the six E. coli isolates of the H21 lineage using Prokka. Comparing the regions with SNPs and both simple and complex indels, we observed that isolate E016, originating from chicken 4, differed from the other five isolates, which were derived from chicken 7, by only two SNPs.
DISCUSSION
As expected, the administration of ceftriaxone to the 14 chickens, both orally (7) and intramuscularly (7), resulted in a significant increase in the 3GC-resistant E. coli ratio in the intestines of treated chickens. During the treatment, the resistance levels reached 96.61% in the oral group and 80.88% in the intramuscular group, suggesting that antimicrobial exposure facilitates the survival and proliferation of resistant clones. Before treatment, the baseline 3GC-resistant E. coli ratio averaged 31.16% across the 21 chickens, with a range from 7.25% to 86.56%, indicating that substantial resistance was present in the intestinal microbiota even before the antimicrobial intervention.
Genotypic and phenotypic analyses of E. coli isolates revealed substantial diversity, including 16 distinct lineages and 11 variants of the blaCTX-M gene, further corroborating the clonal and gene variability associated with antimicrobial resistance. We expected that some 3GC-resistant E. coli, already present in high numbers in the intestine before treatment, would survive and proliferate during the treatment. Instead, we found that in each chicken, new E. coli clones seemed to outnumber the previous ones during treatment; for example, E. coli clones H21 (14/35) and H42 (6/35) were more prevalent before treatment in chickens 2 and 7. However, E. coli clones H34 (14/35) and H4 and H21 (both 7/35) were more prevalent during treatment in chickens 2, 3, 4, 5, and 6, and H21 and H42 (both 8/35) after treatment in chickens 1, 2, 3, and 6. This observation indicates that some 3GC-resistant E. coli clones are more likely to dominate during antimicrobial treatment, whereas other 3GC-resistant E. coli clones dominate in the absence of an antimicrobial (Fig. 3). These results may indicate that some E. coli clones may better tolerate (have better fitness) a plasmid without antimicrobial pressure (plasmid as a molecular parasite), whereas other clones do better under antimicrobial pressure, which is consistent with previous observations (33–37). The expansion and subsequent disappearance of the H34 clone, during and after ceftriaxone treatment, may indicate that some bacterial clones display different fitness costs with different plasmids; some plasmids carrying blaCTX-M genes improve the bacterial fitness in the absence of ceftriaxone (33), whereas other plasmids may provide better fitness (to certain bacterial clones) in the presence of ceftriaxone (38, 39).
The evidence presented here suggests that the proliferation of diverse 3GC-resistant clones may be a more important mechanism for promoting 3GC resistance during and after antimicrobial treatment. However, we detected a potential HGT in one case during antimicrobial treatment: the same plasmid was present in two distinct E. coli lineages in the same animal, as seen with plasmid pE070 in E070 (cST 39108) and E102 (cST 119558). Previous reports suggest that antimicrobial treatment increases the horizontal transmission of ESBL genes (3, 40–46).
The predominance of blaCTX-M-55 in the isolates highlights the role of plasmid-mediated resistance, especially associated with IncFII (pHN7A8) plasmids. Such plasmids are known to facilitate horizontal gene transfer between bacterial isolates, thereby enhancing the spread of resistance genes across bacterial populations (47, 48). Interestingly, the genetic environment of blaCTX-M-55 (bracket 2) had been previously reported in Ecuador in 2018 in commensal E. coli isolated from children, dogs, and chickens, as well as in a uropathogenic E. coli strain in 2014 (49, 50). Although the bracket identified in our study shares the same structural organization, it exhibits eight SNPs: one base substitution and seven single-base insertions (Fig. S1). This suggests a close evolutionary relationship and a likely descent from a bracket previously identified in Ecuador. Furthermore, the observed variability in the Ecuadorian brackets indicates an ongoing diversification process, potentially driven by selective pressure from the use of ceftriaxone or other antimicrobials in poultry production. The presence of a complex plasmid structure in strain E067, consisting of a duplicated bracket 2 and a single copy of bracket 3, indicates a genomic rearrangement that increases the number of blaCTX-M-55 copies. This arrangement suggests that under antimicrobial pressure, the transposable element IS26 may have promoted the duplication of the blaCTX-M-55, which is something that has been increasingly reported in recent years (51–54). This IS26-mediated amplification likely leads to higher expression of the ESBL, enhancing bacterial survival under high ceftriaxone concentrations (55).
Interestingly, the resistance rate remained at the same level after 15 days post-treatment, reinforcing the idea that antimicrobial exposure has long-term effects on the intestinal resistome. This observation aligns with previous studies that have documented the persistence of E. coli resistant to 3GCs long after the cessation of antimicrobial treatment (56). For example, the persistence of resistance in poultry after ceftiofur treatment has been well documented in previous studies by Liao et al. (57).
The results of this study also provide valuable insights into the dynamics of antimicrobial resistance in poultry production. The prolonged persistence of resistance after ceftriaxone treatment, along with the role of mobile genetic elements in spreading resistance genes, highlights the risks associated with the use of antimicrobials.
The lack of significant differences between the oral and intramuscular routes of ceftriaxone administration suggests that the route of administration does not influence the development of resistance as much as the presence of the antimicrobial resistance itself. These results are consistent with the findings of Seo et al. (56) and others who have observed similar resistance dynamics irrespective of the route of administration (56–58).
In the control group, which did not receive antimicrobials, resistance levels remained significantly lower, reinforcing the notion that ceftriaxone administration was the primary factor driving the increase in E. coli resistance. This highlights the importance of responsible antimicrobial use in agricultural settings, as unnecessary or improper use of antimicrobials can contribute to the selection of resistant bacteria in the gut microbiota, ultimately leading to the spread of resistance genes (59). Such findings also provide a crucial understanding of the risks associated with antimicrobial use in poultry farming, as resistant isolates could be transmitted to humans through the food chain or via environmental contamination (60, 61).
This study showed an unexpected genetic complexity of antimicrobial resistance in the intestine during and after 3GC treatment, involving resistant clone proliferation, HGT, and possibly AMR gene duplications. Studies like this offer a unique insight into the complex and dynamic interactions between 3GC resistance genes, plasmids, transposons, and E. coli clones during antimicrobial treatment.
The reference list from the paper itself. Each links out to its DOI / PubMed record.
- 1Murray CJL, Ikuta KS, Sharara F, Swetschinski L, Robles Aguilar G, Gray A, Han C, Bisignano C, Rao P, Wool E, et al.. 2022. Global burden of bacterial antimicrobial resistance in 2019: a systematic analysis. The Lancet 399:629–655. doi:10.1016/S 0140-6736(21)02724-0PMC 884163735065702 · doi ↗ · pubmed ↗
- 2Zhu S, Hong J, Wang T. 2024. Horizontal gene transfer is predicted to overcome the diversity limit of competing microbial species. Nat Commun 15:1–9. doi:10.1038/s 41467-024-45154-w 38280843 PMC 10821886 · doi ↗ · pubmed ↗
- 3Liu G, Bogaj K, Bortolaia V, Olsen JE, Thomsen L-I. 2019. Antibiotic-induced, increased conjugative transfer is common to diverse naturally occurring ESBL plasmids in Escherichia coli. Front Microbiol 10:2119. doi:10.3389/fmicb.2019.0211931552012 PMC 6747055 · doi ↗ · pubmed ↗
- 4Foster-Nyarko E, Pallen MJ. 2022. The microbial ecology of Escherichia coli in the vertebrate gut. FEMS Microbiol Rev 46:fuac 008. doi:10.1093/femsre/fuac 00835134909 PMC 9075585 · doi ↗ · pubmed ↗
- 5Kostyanev T, Can F. 2017. The global crisis of antimicrobial resistance, p 3–12. In Antimicrobial stewardship. doi:10.1016/B 978-0-12-810477-4.00001-5. · doi ↗
- 6Bevan ER, Jones AM, Hawkey PM. 2017. Global epidemiology of CTX-M β-lactamases: temporal and geographical shifts in genotype. J Antimicrob Chemother 72:2145–2155. doi:10.1093/jac/dkx 14628541467 · doi ↗ · pubmed ↗
- 7Husna A, Rahman MM, Badruzzaman ATM, Sikder MH, Islam MR, Rahman MT, Alam J, Ashour HM. 2023. Extended-spectrum β-lactamases (ESBL): challenges and opportunities. Biomedicines 11:2937. doi:10.3390/biomedicines 1111293738001938 PMC 10669213 · doi ↗ · pubmed ↗
- 8Islam S, Selvarangan R, Kanwar N, Mc Henry R, Chappell JD, Halasa N, Wikswo ME, Payne DC, Azimi PH, Mc Donald LC, Gomez-Duarte OG. 2018. Intestinal carriage of third-generation cephalosporin-resistant and extended-spectrum β-lactamase-producing Enterobacteriaceae in healthy US children. J Pediatric Infect Dis Soc 7:234–240. doi:10.1093/jpids/pix 04528992133 PMC 5820225 · doi ↗ · pubmed ↗