Analysis of retrospective natural history data collected from patients with SYNGAP1-related disorders: a preliminary examination of the Citizen database
Matthew R. Scott, Albert Misko, Yang Liu, Oleksandr Sverdlov

TL;DR
This study analyzes data from 65 patients with SYNGAP1-related disorder to understand its natural history and clinical features.
Contribution
The study provides preliminary insights into SRD using the Citizen database, highlighting developmental delays and seizure types.
Findings
Growth parameters in SRD children were normal, but developmental delays and language reversion were observed.
Seizures, particularly absence, atonic, and myoclonic types, were the main cause of hospitalizations.
No dominant SYNGAP1 allele change was found, suggesting genetic heterogeneity in the patient population.
Abstract
SYNGAP1-related disorder (SRD) is a rare neurodevelopmental disorder caused by genetic variants. A major challenge is the characterization of SRD, which requires assessment of several outcomes. We considered natural history data from the Citizen database on 65 patients with SRD in eight data domains: demographics, genetics, growth parameters, standardized clinical scales, developmental skills, neurological examinations, hospitalizations, and seizures. Exploratory analysis tools such as visualizations, summary statistics, and non-parametric statistical modeling were utilized. Age at SRD diagnosis (median [IQR] = 3 [2, 5] years; [min, max] = [1, 17] years) was similar by sex. No evidence of a high frequency allele change in SYNGAP1 was found, indicating no dominant variant in this patient population. Growth parameters of SRD children appeared normal in terms of height, weight, and head…
Genes, proteins, chemicals, diseases, species, mutations and cell lines named across the full text — each resolved to its canonical identifier and authoritative record.
Click any figure to enlarge with its caption.
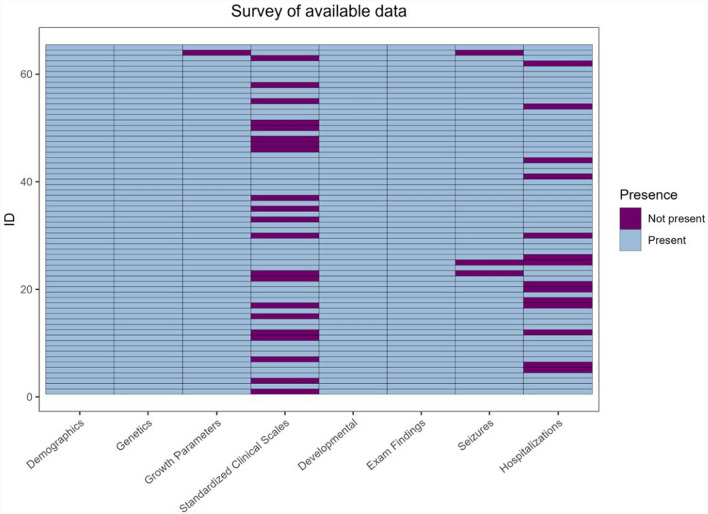 Figure 1
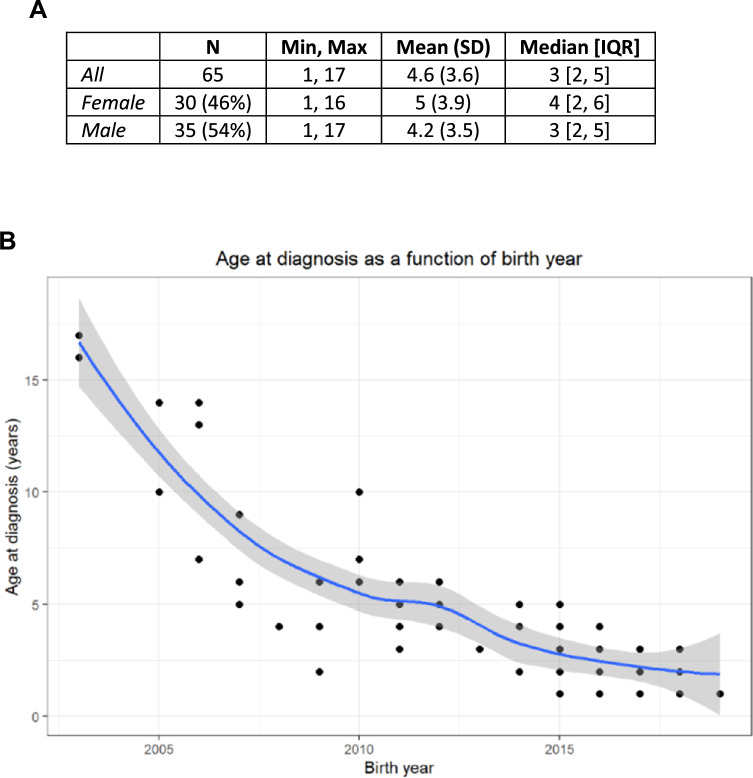 Figure 2
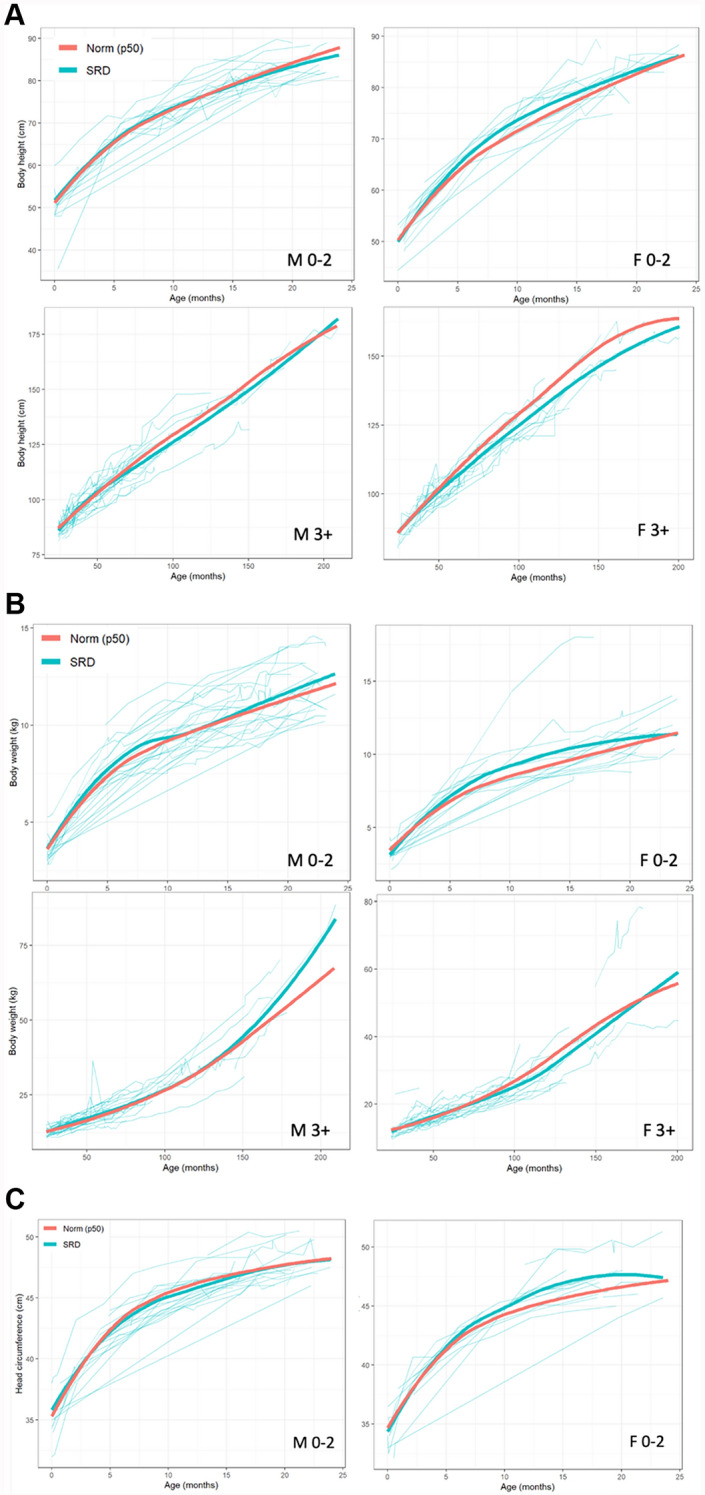 Figure 3
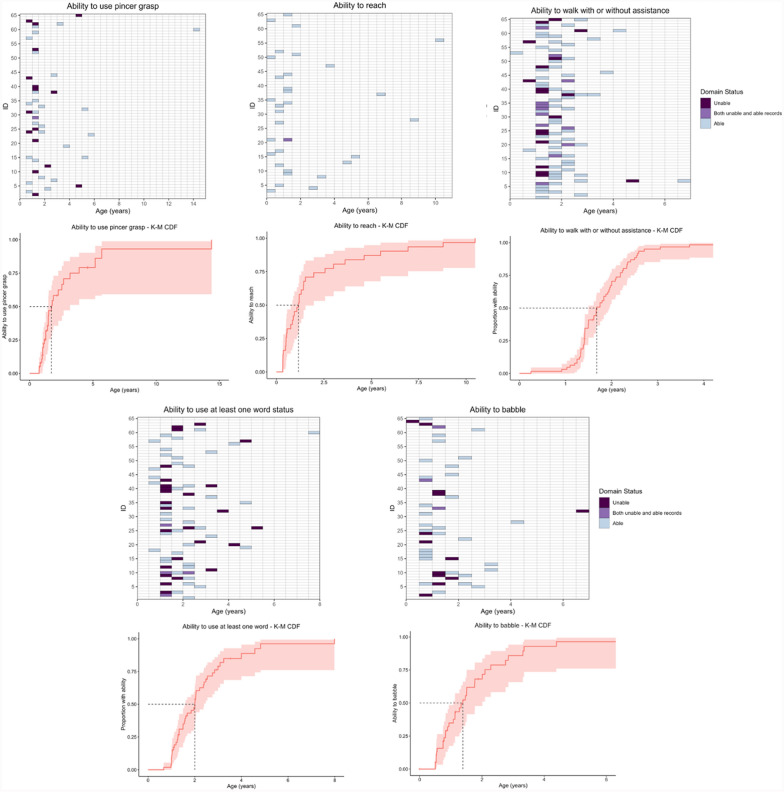 Figure 4
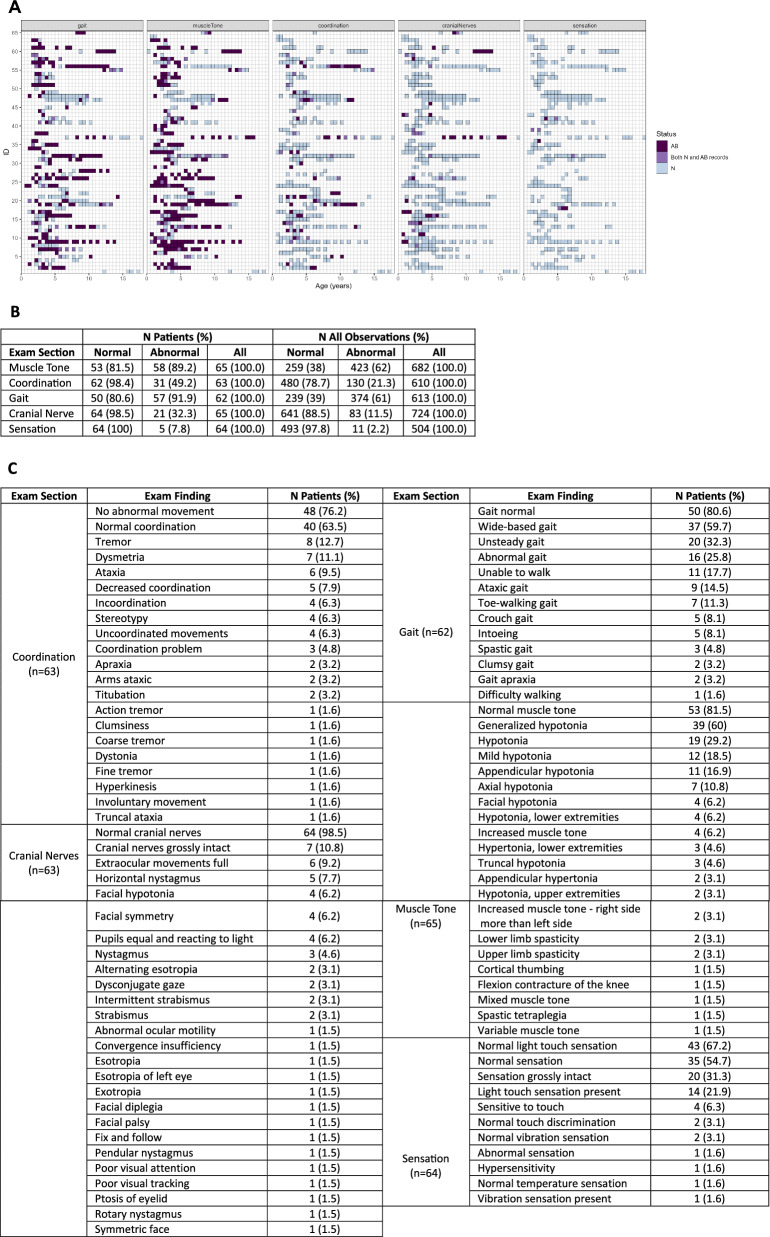 Figure 5
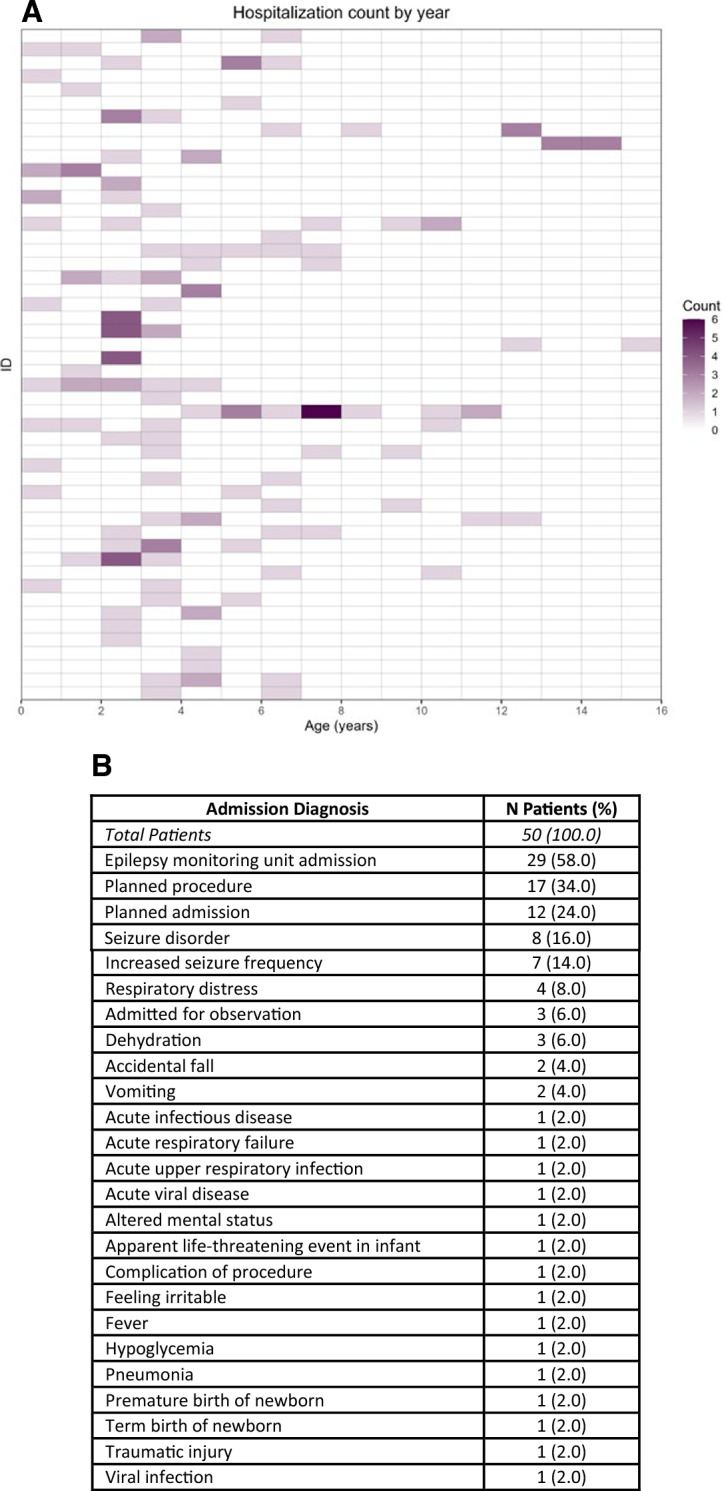 Figure 6
Peer Reviews
No public reviews on file for this paper yet. If you reviewed it on a platform where reviews are public (OpenReview, ICLR, NeurIPS, ICML), you can paste yours below so the community can read it here.
Videos
No videos yet. Explain this paper in a talk, walkthrough, or lecture? Add one.
Taxonomy
TopicsGenetics and Neurodevelopmental Disorders · Genomics and Rare Diseases · Lysosomal Storage Disorders Research
Introduction
Rare neurodevelopmental disorders (RNDDs) are neurological conditions caused by genetic variants that have substantial societal and economic impact. Variants of SYNGAP1 lead to an imbalance of synaptic Ras guanosine triphosphatase (GTP)-activating protein 1, resulting in several neurological issues [2, 6]. Heterozygous deficiency of SYNGAP1 is typically associated with non-syndromic intellectual disability (NSID), autism spectrum disorder (ASD), and epileptic encephalopathy [3, 4, 7, 8, 10, 15].
Studies have started to disentangle the natural history of SYNGAP1-related disorder (SRD) and identify outcomes for clinical trials of SRD. For instance, NSID is present in all SRD patients. Epilepsy is present in approximately 84.6% patients in [8] and 98% in Vlaskamp et al, 2018, with a portion of these patients even exhibiting pharmacoresistant epilepsy [9]. Delayed developmental skills are prominent in domains such as neuromotor or language, even before the onset of seizures [19].
Since the initial discovery of SYNGAP1 and its association to NSID, epilepsy, and ASD in 2009, natural history studies of SRD have been published over the last decade, with studies such as Vlaskamp et al. 2018 (n = 57 SRD patients) and [17] (n = 147 SRD patients). Gene therapy programs have recently launched (e.g., GEN 2023 [5]), thus further characterization of SRD is needed for trial design as it requires assessment of several potential outcomes. This work aims to bridge the gap by running a preliminary investigation on 65 patients with SRD from the Citizen database. We utilized this dataset to investigate the natural history of SRD and inform the design of clinical trials in SRD.
Methods
Citizen data
This work analyzed 8 of 17 datasets provided by Citizen Health (Citizen, https://www.Citizen.com/syngap1) in 2021: demographics, genetics, growth parameters, standardized clinical scales, developmental skills, neurological exam findings, hospitalizations, and seizures. The Citizen database is a United States-based digital health platform that allows individuals with rare neurodevelopmental disorders to contribute their de-identified medical records for research. Participation is voluntary and initiated by self-enrollment, though many individuals in this study were recruited through collaborations with patient advocacy groups such as the SynGAP Research Fund. Participants included in this study had genetically confirmed pathogenic or likely pathogenic SYNGAP1 variants identified through routine clinical testing. Ethnicity data are not available in this database.
65 patients with SRD were present, each with varying records across the different datasets. The presence of each patient’s records is reported in Fig. 1. Within each dataset, we aimed to determine if there were sufficient data for meaningful longitudinal or cross-sectional analyses. Most patients had records in each dataset, but the standardized clinical scales file was sparse due to a lack of harmonization between the scales (Supplemental Table 1). For example, the Peabody Developmental Motor Scales 2nd Edition was the highest frequency scale, yet it only had 19 patient records. Moreover, the highest frequency subdomain in this scale was the Grasping Standard Score, which had data for only 10 patient records (7 cross-sectional and 3 longitudinal). Though pertinent to understanding the natural history of SRD, standardized clinical scales data were not utilized due to this sparsity.Fig. 1. Availability of patient data in each Citizen datasetTable 1Frequency tables of alleles, amino acid changes, inheritance, and interpretation of pathogenicity in the SYNGAP1 gene (NM_006772.3 transcript)Genetic alleleAmino acid changeVariant typeInterpretationN (%)chr16:33,451,137–33,543,925 × 1CNVPathogenic1 (1.5)chr6:33,265,327–33,600,853 × 1CNVPathogenic1 (1.5)chr6:33,399,937–33,400,584 × 1CNVPathogenic1 (1.5)Gain (Exon 3)CNVLikely pathogenic1 (1.5)c.3416dupAp.Thr1140Aspfs13Duplication, FrameshiftPathogenic1 (1.5)c.698_699dupGTp.Arg234Valfs18Duplication, FrameshiftPathogenic1 (1.5)c.1760_1792del33p.Arg587_Leu598delinsIleIndel, ComplexPathogenic1 (1.5)c.1022_1030delinsTAp.Gly341Valfs4Indel, FrameshiftPathogenic1 (1.5)c.1154_1161delp.Ser385Trpfs31Indel, FrameshiftPathogenic1 (1.5)c.1167_1168delAGp.Gly391Glnfs27Indel, FrameshiftPathogenic1 (1.5)c.1167delAp.Gly391Alafs12Indel, FrameshiftPathogenic1 (1.5)c.1463delCp.Thr488Serfs7Indel, FrameshiftPathogenic1 (1.5)c.2293delAp.Ser765Alafs44Indel, FrameshiftPathogenic1 (1.5)c.2561_2577delp.Leu840fsIndel, FrameshiftPathogenic1 (1.5)c.2843delp.Gly948Alafs129Indel, FrameshiftPathogenic1 (1.5)c.3233_3236delp.Val1078Alafs51Indel, FrameshiftPathogenic1 (1.5)c.333delp.Lys114Serfs20Indel, FrameshiftPathogenic1 (1.5)c.333delAp.Lys114Serfs20Indel, FrameshiftPathogenic1 (1.5)c.404_411delGACGGCTAinsTp.Arg135Leufs37Indel, FrameshiftLikely pathogenic1 (1.5)c.410delTp.Leu137Glnfs37Indel, FrameshiftPathogenic1 (1.5)c.411_418delAAAAAGCTp.Lys138Hisfs11Indel, FrameshiftPathogenic1 (1.5)c.535delGp.Glu179Serfs9Indel, FrameshiftPathogenic1 (1.5)c.654_655delp.Phe218Leufs3Indel, FrameshiftPathogenic1 (1.5)c.745delp.Ala249Glnfs2Indel, FrameshiftPathogenic1 (1.5)c.768_770delCAGinsAAp.Asn256Lysfs5Indel, FrameshiftPathogenic1 (1.5)c.878delGp.Arg293Profs54Indel, FrameshiftPathogenic1 (1.5)c.3452_3453delp.Ser1151TerIndel, NonsensePathogenic1 (1.5)c.190-2A > GSplice-sitePathogenic1 (1.5)c.1913 + 1G > ASplice-sitePathogenic1 (1.5)c.3583-6G > ASplice-sitePathogenic1 (1.5)c.3583-9G > ASplice-sitePathogenic1 (1.5)c.388-3C > GSplice-siteLikely pathogenic1 (1.5)c.190-15_206delins28Splice-site, IndelPathogenic1 (1.5)c.1030G > Ap.Gly344SerSubstitution, MissenseLikely pathogenic1 (1.5)c.1292 T > Cp.Leu431ProSubstitution, MissenseLikely pathogenic1 (1.5)c.1403 T > Ap.Met468LysSubstitution, MissenseLikely pathogenic1 (1.5)c.1797C > Gp.Cys599TrpSubstitution, MissenseLikely pathogenic1 (1.5)c.1889 T > Ap.lle630AsnSubstitution, MissenseLikely pathogenic1 (1.5)c.1946 T > Gp.Met649ArgSubstitution, MissenseLikely pathogenic1 (1.5)c.662A > Tp.Glu221ValSubstitution, MissenseLikely pathogenic1 (1.5)c.851 T > Cp.Leu284ProSubstitution, MissenseLikely pathogenic1 (1.5)c.490C > Tp.Arg164TerSubstitution, NonsensePathogenic4 (6.2)c.3718C > Tp.Arg1240TerSubstitution, NonsensePathogenic3 (4.6)c.1861C > Tp.Arg621TerSubstitution, NonsensePathogenic2 (3.1)c.403C > Tp.Arg135TerSubstitution, NonsensePathogenic2 (3.1)c.1284 T > Ap.Tyr428TerSubstitution, NonsensePathogenic1 (1.5)c.1507C > Tp.Gln503TerSubstitution, NonsensePathogenic1 (1.5)c.1735C > Tp.Arg579TerSubstitution, NonsensePathogenic1 (1.5)c.2059C > Tp.Arg687TerSubstitution, NonsensePathogenic1 (1.5)c.2104C > Tp.Gln702TerSubstitution, NonsensePathogenic1 (1.5)c.2755C > Tp.Gln919TerSubstitution, NonsensePathogenic1 (1.5)c.2899C > Tp.Arg967TerSubstitution, NonsensePathogenic1 (1.5)c.2946 T > Ap.Tyr982TerSubstitution, NonsensePathogenic1 (1.5)c.3277C > Tp.Gln1093TerSubstitution, NonsensePathogenic1 (1.5)c.3316C > Tp.Gln1106TerSubstitution, NonsensePathogenic1 (1.5)c.3553A > Tp.Lys1185TerSubstitution, NonsensePathogenic1 (1.5)c.984C > Gp.Tyr328TerSubstitution, NonsenseLikely pathogenic1 (1.5)c.2115G > Ap.Lys705 = Substitution, SynonymousPathogenic1 (1.5)Total65 (100)
Analysis
Our approach was largely exploratory; visualization techniques, summary statistics, and non-parametric modeling were frequently used. Non-parametric statistical modeling included generalized additive models (GAMs), Mann–Whitney U tests, and Kaplan–Meier analyses. Visualizations included histograms, grid/panel plots, and scatter plots. Summary statistics included measures of frequency, central tendency (mean and median), and variability (IQR, [min, max], SD). Frequency was calculated by summing across all observations, as well as across patients, where a patient was counted once if they had at least one finding over any of their follow-up records. All analyses were performed using R v4.2.2. The variables and analyses in each dataset were as follows:
- I.Demographics data consisted of age at diagnosis as well as sex. Histograms and descriptive statistics of age at diagnosis were created across the full sample and stratified by sex. A Mann–Whitney U test was used to assess if age at diagnosis differed by sex. A smoothed GAM plot was used to visualize how age at diagnosis changes as a function of birth year.
- II.Genetics data contained allele changes, amino acid changes, interpretation of pathogenicity, and inheritance. In SYNGAP1, variant allele change, amino acid change, and interpretations of pathogenicity were tabulated concurrently. Frequency of inheritance is additionally reported. Interpretations of pathogenicity were determined by the variant classification criteria of the American College of Medical Genetic and Genomics, and the Association for Molecular Pathology [13].
- III.Growth parameters consisted of longitudinal body weight, body height, and head circumference. Sufficient data was present for each patient to perform a meaningful longitudinal analysis (Supplemental Table 2). GAMs were used to construct growth curves of each parameter over time (age) against published Center for Disease Control or World Health Organization 50th percentile norms stratified by sex and age (male or female; 0–2 years or 3 + years).
- IV.Developmental data comprised four domains (academic, language, fine motor, and gross motor) with specific skills in each domain (e.g., ability to babble in the language domain). Frequencies of skills in each domain are reported in Supplemental Table 3. Skills that were clinically relevant to neurologists, had sufficient frequency, and did not have ambiguous definitions were used in analyses. The academic domain was not analyzed as it did not meet these criteria. Longitudinal ability or inability status was visualized in 6-month intervals for each patient using grid plots. Kaplan–Meier cumulative density function curves were used to illustrate ages of skill attainment. Median ages of skill attainment were estimated.
- V.Neurological exam findings contained five domains (muscle tone, gait, cranial nerves, coordination, and sensation) with specific records in each domain (e.g., hypotonia in the muscle tone domain). Frequency of records by domain are reported. To visualize issues over time in each domain, a panel plot was used to show abnormal and normal records in 6-month intervals for each patient.
- VI.Hospitalization data consisted of age of hospitalization as well as the cause of hospitalization. Frequency of hospitalization causes were tabulated to illustrate factors driving healthcare and patient burden. Grid plots were used to visualize the number of hospitalizations at each year of age.
- VII.Frequency of seizure type was assessed to identify common manifestations of epilepsy. Table 2. Seizure frequency across patientsType of seizureN (%) Patients*Total Patients**62 (100.0)*Absence seizure33 (53.2)Atonic seizures31 (50)Atypical absence seizure18 (29)Myoclonic seizure12 (19.4)Tonic–clonic seizure12 (19.4)Eyelid myoclonia8 (12.9)Focal seizure4 (6.5)Tonic seizure4 (6.5)Absence seizure with atonic components3 (4.8)Eyelid myoclonus with absences3 (4.8)Myoclonic-atonic seizure2 (3.2)Subclinical seizure2 (3.2)Clonic seizure1 (1.6)Complex partial seizure with impairment of consciousness1 (1.6)Generalized tonic–clonic seizure1 (1.6)Myoclonic absence seizure1 (1.6)
Results
Demographics
The sample consisted of 30 (46%) females and 35 males (54%). Descriptive statistics for age of diagnosis and a smoothed scatterplots of age of diagnosis as a function of birthday are reported in Fig. 2. Age of diagnosis did not differ by sex (U = 598.5, p = 0.33). Age at diagnosis decreased as birth year increases.Fig. 2. Age at diagnosis. A Age of diagnosis (years) in the full sample and by sex. B Age of diagnosis as a function of birth year
Genetics
Allele change, amino acid change, and variant type frequencies are reported in Table 1. The c.490C > T allele and p.Arg164Ter amino acid change had the highest frequency (n = 4); no dominant allele or amino acid change was present in this patient population. Indel (n = 21) and substitution (n = 32) variant types were prominent, and most patients had pathogenic interpretations (n = 53). Inheritance was predominantly de novo (n = 38), with only n = 1 maternal mosaic and n = 26 missing.
Growth parameters
Growth parameters of SRD patients and 50th percentile norms were plotted over time by age and sex. Height, weight, and head circumference curves are reported in Fig. 3. Growth curves were typical across the three parameters when compared to established norms. However, minor deviations were present. For example, the 3 + females had slightly lower height at older ages compared to the norm, but this was likely due to a reduced sample size in stratification.Fig. 3. Growth curves for SRD patients (teal) compared to 50th percentile norms (red). A Height (upper left: males 0–2 years; lower left: males 3 + years; upper right: females 0–2 years; lower right: females 3 +). B Weight (upper left: males 0–2 years; lower left: males 3 + years; upper right: females 0–2 years; lower right: females 3 +). C Head circumference (left: males 0–2 years; right: females 0–2 years)
Developmental skills
Language, fine motor, and gross motor domains were analyzed. Grid plots and Kaplan–Meier cumulative density plot estimates are reported in Fig. 4. For language, the ability to use at least one word and ability to babble skills were used. Ability to use at least one word had n = 64, events = 62, 6 patients reverted in the skill, and median [95% CI] = 1.68 [1.5, 1.96] years. Ability to babble had n = 40, events = 32, 2 patients reverted, and median [95% CI] = 1.39 [1.08, 2.01] years. For gross motor, the ability to walk with or without assistance skill was used; it had n = 64, events = 62, 1 patient reverted, and median [95% CI] = 1.68 [1.5, 1.96] years. For fine motor, the ability to use pincer grasp and ability to grasp skills were used. Ability to use pincer grasp had n = 38, events = 26, 1 patient reverted, and median [95% CI] = 1.72 [1.42, 3.19] years. Ability to reach had n = 31, events = 31, 1 patient reverted, and median [95% CI] = 1.16 [0.75, 1.96] years. Overall, estimated medians were indicative of delayed development, and skill regression was observed in the language domain.Fig. 4. Developmental skills across domains of language, fine motor, and gross motor. Grid plots are shown in 6-month intervals. Dark colors indicate inability to perform a skill while light colors indicate ability to perform a skill. The gradient in-between indicates mixed reports in the 6-month interval. Kaplan–Meier survival plots for skill attainment are also displayed. Dashed lines indicate the median age of skill attainment
Neurological exam findings
A panel plot and frequency table highlighting neurological exam abnormalities over time are reported in Fig. 5. Gait and muscle tone were the most frequent abnormalities, with approximately 90% of patients experiencing at least one issue in these domains. The highest frequency concern in the muscle tone domain was hypotonia of varying degrees. In the gait domain, wide-based, unsteady, and/or abnormal gait as well as an inability to walk were common. For coordination, ataxia and tremors were present. Nystagmus was the most frequent problem in the cranial nerve domain, but this was not commonly or not frequently recorded. Only five patients had an abnormal sensation record.Fig. 5. Neurological exam abnormalities over time. A Panel plot of abnormal exam findings over time for each patient (rows) in 6-month intervals. Darker colors indicate abnormal findings, light colors indicate normal findings, and the gradient indicates mixed reports during the 6-month interval. B Frequency of abnormalities across patients and all observations. C Frequencies of neurological exam findings in each domain across patients
Hospitalizations
51 of the 65 SRD patients had hospitalizations records. A grid plot of all cause hospitalization frequency by age is reported in Fig. 6, showing frequent hospitalizations at younger ages. Seizures/epilepsy and planned procedures/admissions were the most common causes of hospital admissions for SRD patients. A breakdown of these causes is reported in Fig. 6.Fig. 6. Hospitalization frequency and causes. A Grid plot showing the number of all-cause hospitalizations per year in each patient (rows), with darker colors indicating higher admission frequency. B Hospital admission diagnosis frequency across patients
Seizures
Frequency of seizure types are reported in Table 2. Absence seizures were the most prevalent, followed by atonic and myoclonic seizures.
Discussion
This work employed Citizen data to characterize the nuanced and complex natural history of the SRD. Demographics, genetics, growth parameters, clinical scales, developmental skills, neurological exam findings, and hospitalizations data were analyzed. We first assessed completeness of data and found the standardized clinical scales data to be sparse. The remaining files were investigated using exploratory analysis methods.
Age at diagnosis did not differ by sex, indicating no apparent sex difference in the clinical manifestations of SRD. We observed that age at diagnosis decreased as a function of time, likely due to clinical sequencing becoming more commonplace in recent years [14]. For genetics data, no high frequency allele or amino acid change was present, indicating no dominant variant in this patient population. As expected, interpretations were pathogenic and inheritance was de novo. Growth curves of height, weight, and head circumference were compared to 50th percentile norms by age and sex. No major deviations in SRD patients were observed in any of the three growth parameters, indicating typical growth patterns in SRD patients. This contrasts with Lo Barco et al., who reported low auxological parameters in male SRD patients.
Development delay is common in SRD patients [7, 8, 12, 14, 15]. Citizen developmental data provided an extensive array of skills that were useful for investigating and scrutinizing the intricacies of this phenomenon. Across all five skills analyzed, median ages of skill attainment were slightly higher than those of a normal population. For example, the median age of walking with or without assistance was 1.68 years. However, in a normal population a child is expected to be walking with assistance at 9 months or alone at 1 year [18]. Another example is the ability to speak at least one word. The median age in SRD patients was 2 years, but in a normal population it is approximately 7–12 months [1]. Therefore, our findings indicate delayed development in SRD patients. Language regression was found in 6 of the 53 patients for the ability to use at least one word. This is a common feature of ASD [11], so regression in this skill may be a manifestation of ASD in SRD patients.
For neurological exam data, muscle tone and gait showed a higher frequency of abnormal reports compared to other exam metrics, consistent with previous reports of hypotonia and ataxia [15]. While more complex modeling methodologies are needed to fully elucidate longitudinal patterns of these abnormalities, the panel plot showed these issues remaining consistent over multiple follow-up visits. We observed recurrent hospitalizations at younger ages, highlighting the burden of hospitalizations on SRD patients. Hospitalization frequency decreased at later ages, possibly due to patients attaining stable treatment or due to a lack of follow-up records. Consistent with previous literature [7, 8, 15, 16], absence, atonic, and myoclonic seizures were dominant in the seizure data.
There are several key limitations to consider. While this sample was large compared to other studies of SRD, records were sparse in key domains pivotal to understanding the natural course of SRD. For example, standardized clinical scales may provide important insight into the progression of intellectual disability, but it was insufficient due to a lack of harmonized testing. Sleeping problems have also been reported in SRD patients [8, 10, 15], but sleep-related difficulties or insomnia data were outside the scope of our analysis. Recent work has investigated genotype–phenotype correlations in SRD. For example, [17] used Citizen data to show that individuals with variants in the SH3 domain were less likely to have epilepsy, while those with mutations in exons 1 through 4 tended to exhibit milder language delays. Future research should explore these correlations to better understand causes of heterogeneous SRD phenotypes.
More elaborate modeling methodologies may be explored in future work. For example, GAMs were utilized for their ability to model complex non-linear patterns with minimal assumptions. However, future methods may more explicitly account for within-patient variation or unbalanced follow-up records. Kaplan–Meier methods were used to estimate median age of developmental skill attainment. However, medical records only noted if a skill was or was not present, and a patient may have developed a skill earlier than their medical record indicates. Analyses accounting for missing data could be incorporated in future work to validate our findings. This work only analyzed univariate or bivariate associations. Given the complexity and multifaceted manifestation of SRD, analyses should examine multivariate associations and interactions to create more complete models of disease progression and staging. Lastly, there are additional Citizen datasets such as medications or adverse events that should be investigated in future work.
Conclusion
Citizen data revealed genetic variability in the SYNGAP1 gene, normal growth patterns, developmental delays and language reversion, gait and muscle issues, hospitalization burden in SRD patients, and seizure types in the largest natural history sample to date. To further disentangle the natural history of SRD, additional analyses should be performed with Citizen data and supplemented with data that can account for sparsity in certain domains.
Supplementary Information
Supplementary file 1.
The reference list from the paper itself. Each links out to its DOI / PubMed record.
- 1American Speech-Language-Hearing Association. “Communication Milestones: Birth to 1 Year.” www.asha.org, www.asha.org/public/developmental-milestones/communication-milestones-birth-to-1-year/.
- 2Genetic Engineering & Biotechnology News (GEN). (2023). Gene therapy team wins grant to further research on rare SYNGAP-1 genetic disorder. https://www.genengnews.com/news/gene-therapy-team-wins-grant-to-further-research-on-rare-syngap-1-genetic-disorder/
- 3Richards S, Aziz N, Bale S, et al. ACMG Laboratory Quality Assurance Committee. Standards and guidelines for the interpretation of sequence variants: a joint consensus recommendation of the American College of Medical Genetics and Genomics and the Association for Molecular Pathology. Genet Med. 2015; 17(5):405–2410.1038/gim.2015.30PMC 454475325741868 · doi ↗ · pubmed ↗
- 4World Health Organization. “Motor Development Milestones.” www.who.int, www.who.int/tools/child-growth-standards/standards/motor-development-milestones.