Epidemiology of Hip Dislocations in the United States From 1990 to 2019: A Temporal Study Using the Global Burden of Disease Database
Ambrose Loc T Ngo, Gabrielle Dykhouse, Taylor J Manes, Phillip C McKegg, Cameron J Sabet, Brett Barthman, Robert Golden

TL;DR
This study analyzed hip dislocation trends in the U.S. from 1990 to 2019, finding overall declines and regional and gender disparities.
Contribution
The study provides a comprehensive, regionally stratified analysis of hip dislocation epidemiology in the U.S. over nearly three decades.
Findings
Hip dislocation incidence, prevalence, and disease burden decreased in the U.S. from 1990 to 2019.
Men had higher rates of hip dislocations than women, with statistically significant differences in incidence.
The Western U.S. had the highest rates of hip dislocations, while the Northeast had the lowest.
Abstract
Introduction Hip dislocations are devastating injuries that require urgent intervention to minimize the development of severe complications. This study aimed to evaluate the epidemiology of hip dislocations in the United States (U.S.) from 1990 to 2019. Methods This study is a descriptive retrospective epidemiological study. The Global Burden of Disease (GBD) database was used to collect epidemiological data on hip dislocation in the U.S. from 1990 to 2019. Data included years lived with disability (YLDs), prevalence, and incidence rates per 100,000 people. Data were regionally stratified into Northeast, Midwest, South, and West by the U.S. Census definition. Bartlett’s test was used to assess equal variance. Welch’s ANOVA was performed to assess regional differences to compare the means of different groups without assuming equal variances or equal sample sizes. The Games-Howell post…
Genes, proteins, chemicals, diseases, species, mutations and cell lines named across the full text — each resolved to its canonical identifier and authoritative record.
Click any figure to enlarge with its caption.
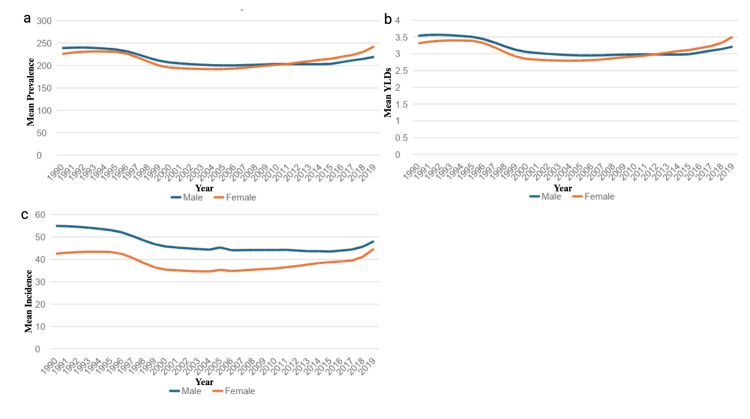 Figure 1
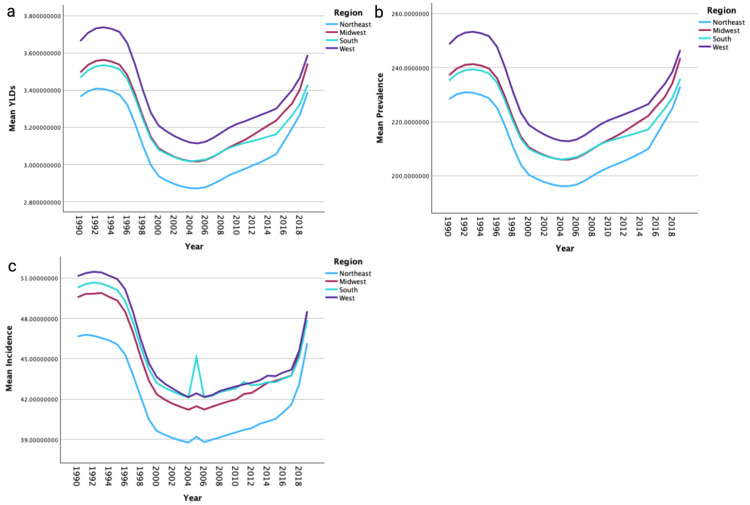 Figure 2
| State | YLDs: 1990 | YLDs: 2019 | % Change | Prevalence: 1990 | Prevalence: 2019 | % Change | Incidence: 1990 | Incidence: 2019 | % Change |
| Alabama | 3.6067 | 3.5008 | -2.9353769 | 244.900589 | 225.085919 | -8.0909035 | 52.8932213 | 48.9793621 | -7.3995479 |
| Alaska | 4.4298 | 3.8771 | -12.476916 | 300.999728 | 242.007171 | -19.598874 | 64.539417 | 50.9682707 | -21.027687 |
| Arizona | 3.6303 | 3.3359 | -8.1100531 | 246.964669 | 227.383424 | -7.9287636 | 50.0012609 | 45.7216625 | -8.5589808 |
| Arkansas | 3.8160 | 3.3646 | -11.831045 | 258.128427 | 235.731843 | -8.6765275 | 57.5482381 | 47.1634497 | -18.045363 |
| California | 3.3927 | 3.3342 | -1.7240094 | 228.579816 | 242.377459 | 6.03624689 | 48.5813602 | 46.7144668 | -3.8428184 |
| Colorado | 3.8942 | 3.2957 | -15.368303 | 264.659234 | 230.672319 | -12.841764 | 52.4567632 | 46.9494066 | -10.498849 |
| Connecticut | 3.2936 | 3.1560 | -4.1782662 | 223.165269 | 253.911145 | 13.777178 | 46.5447085 | 43.7803855 | -5.9390703 |
| Delaware | 3.3551 | 3.6102 | 7.60307794 | 228.475656 | 238.618152 | 4.43920176 | 46.5234595 | 49.1779537 | 5.70571119 |
| District of Columbia | 3.3355 | 3.6649 | 9.87420865 | 225.801351 | 252.783864 | 11.9496687 | 47.7591699 | 50.3204571 | 5.36292234 |
| Florida | 3.4260 | 3.8490 | 12.3455976 | 232.612718 | 245.742001 | 5.64426722 | 47.6788679 | 51.3905293 | 7.78470957 |
| Georgia | 3.4992 | 3.3913 | -3.0844966 | 237.835336 | 233.819664 | -1.688425 | 50.6070854 | 47.5490112 | -6.0427788 |
| Hawaii | 3.3223 | 3.7760 | 13.6554702 | 224.646747 | 238.55386 | 6.19065886 | 46.2357493 | 50.033788 | 8.21450671 |
| Idaho | 3.6278 | 3.7882 | 4.42035398 | 246.203462 | 261.961688 | 6.40048914 | 51.6129319 | 51.2479962 | -0.7070626 |
| Illinois | 3.5241 | 4.1623 | 18.1083087 | 238.782108 | 252.872639 | 5.90099945 | 49.9773598 | 57.4921736 | 15.0364361 |
| Indiana | 3.3659 | 3.1430 | -6.6222632 | 228.664392 | 251.570601 | 10.017392 | 48.9972819 | 48.1311407 | -1.7677331 |
| Iowa | 3.4732 | 3.3802 | -2.6780966 | 235.386708 | 225.61011 | -4.1534196 | 47.725927 | 47.4856901 | -0.5033677 |
| Kansas | 3.4300 | 3.6068 | 5.15329845 | 232.561708 | 260.724975 | 12.1100189 | 50.0576153 | 49.5574651 | -0.999149 |
| Kentucky | 3.6343 | 3.2485 | -10.614834 | 247.769802 | 244.157678 | -1.4578548 | 52.213969 | 44.1727648 | -15.400484 |
| Louisiana | 3.3128 | 3.3085 | -0.1293177 | 225.036178 | 244.059908 | 8.45363183 | 49.9814484 | 48.8951055 | -2.1734923 |
| Maine | 3.4922 | 3.7923 | 8.59299484 | 237.663502 | 225.59839 | -5.0765526 | 47.3317929 | 46.9113385 | -0.8883128 |
| Maryland | 3.4448 | 3.6601 | 6.25219531 | 233.344957 | 257.212935 | 10.2286236 | 50.2649269 | 50.7884752 | 1.04157786 |
| Massachusetts | 3.4030 | 3.3422 | -1.7862188 | 230.948025 | 245.951703 | 6.49656016 | 46.545826 | 51.369828 | 10.363984 |
| Michigan | 3.1640 | 3.6286 | 14.6836987 | 214.832748 | 246.22799 | 14.6138063 | 45.2674617 | 41.1281067 | -9.1442172 |
| Minnesota | 3.7872 | 3.8193 | 0.84695414 | 257.121508 | 237.016137 | -7.8194049 | 51.5518971 | 44.9057238 | -12.892199 |
| Mississippi | 3.5487 | 3.7582 | 5.90410779 | 239.536539 | 204.229922 | -14.739554 | 52.6861013 | 51.01491 | -3.1719775 |
| Missouri | 3.7431 | 2.9816 | -20.343123 | 254.431645 | 232.224398 | -8.7281781 | 52.8744211 | 48.8362751 | -7.6372391 |
| Montana | 3.7209 | 3.5252 | -5.2598641 | 253.088198 | 244.023415 | -3.5816694 | 52.1543001 | 50.1237968 | -3.8932616 |
| Nebraska | 3.5150 | 3.8193 | 8.6564687 | 238.520315 | 241.385715 | 1.20132327 | 50.2459369 | 47.0212376 | -6.4178309 |
| Nevada | 3.3904 | 3.4507 | 1.77800405 | 230.128907 | 240.433894 | 4.47791942 | 47.7446587 | 47.9649186 | 0.46132879 |
| New Hampshire | 3.4934 | 3.5471 | 1.53953703 | 237.661814 | 285.243132 | 20.0205986 | 47.2954736 | 45.6423634 | -3.4952821 |
| New Jersey | 3.0869 | 3.5745 | 15.7964545 | 209.365042 | 223.090031 | 6.55553029 | 44.2663107 | 47.3183937 | 6.89482132 |
| New Mexico | 3.8730 | 2.9849 | -22.929799 | 263.399479 | 248.634177 | -5.6056686 | 52.9522887 | 49.4907261 | -6.5371352 |
| New York | 3.1728 | 3.4727 | 9.45341297 | 215.197255 | 251.644244 | 16.9365493 | 44.9619501 | 47.943568 | 6.63142473 |
| North Carolina | 3.4838 | 3.5419 | 1.66798774 | 236.081691 | 214.789254 | -9.0190971 | 48.692165 | 48.7212092 | 0.05964873 |
| North Dakota | 3.3292 | 3.4782 | 4.47293778 | 225.984172 | 205.34004 | -9.1352112 | 48.2112405 | 43.8487054 | -9.0487925 |
| Ohio | 3.4708 | 3.6902 | 6.32347209 | 236.077996 | 229.831738 | -2.645845 | 49.0455814 | 46.034991 | -6.1383519 |
| Oklahoma | 3.5703 | 3.5908 | 0.57338498 | 242.582491 | 239.426354 | -1.3010575 | 51.2365441 | 47.2574959 | -7.7660354 |
| Oregon | 3.6540 | 3.2879 | -10.017659 | 248.434565 | 261.781444 | 5.37239206 | 51.2786285 | 45.9002279 | -10.488581 |
| Pennsylvania | 3.3417 | 3.5294 | 5.61645597 | 227.477938 | 240.878632 | 5.89098638 | 47.602317 | 48.585199 | 2.06477755 |
| Rhode Island | 3.4478 | 3.5106 | 1.82337666 | 233.883919 | 231.749701 | -0.9125115 | 46.6692197 | 50.7366771 | 8.71550344 |
| South Carolina | 3.3907 | 3.3353 | -1.63269 | 229.990152 | 227.282872 | -1.1771289 | 49.3311799 | 45.1104617 | -8.5558833 |
| South Dakota | 3.6180 | 3.3593 | -7.14972 | 245.232828 | 247.991379 | 1.12487048 | 51.30734 | 50.3097652 | -1.9443121 |
| Tennessee | 3.3978 | 3.3888 | -0.2635283 | 230.863544 | 258.955304 | 12.1681227 | 50.5129599 | 53.696573 | 6.30256687 |
| Texas | 3.5942 | 3.6651 | 1.97238196 | 243.827202 | 253.349074 | 3.90517215 | 51.4777563 | 45.7812305 | -11.065995 |
| Utah | 3.5355 | 3.4612 | -2.1021561 | 239.82908 | 228.192934 | -4.8518495 | 48.8372343 | 48.627606 | -0.4292389 |
| Vermont | 3.7057 | 3.4294 | -7.4573015 | 251.237017 | 217.562827 | -13.403355 | 50.556291 | 48.5866397 | -3.895957 |
| Virginia | 3.3490 | 3.4623 | 3.38075717 | 227.308988 | 265.656193 | 16.8700788 | 48.9960645 | 48.4551964 | -1.1039013 |
| Washington | 3.6278 | 3.5180 | -3.0264571 | 246.573442 | 233.251892 | -5.4026702 | 49.1035981 | 47.4169124 | -3.4349533 |
| West Virginia | 3.3776 | 3.2727 | -3.1073789 | 229.359899 | 260.872972 | 13.7395738 | 49.031336 | 46.7810493 | -4.5894868 |
| Wisconsin | 3.6962 | 3.6844 | -0.3177017 | 251.462731 | 267.400693 | 6.33810133 | 51.9366022 | 42.0400387 | -19.055085 |
| Wyoming | 3.7184 | 3.5780 | -3.7734343 | 252.122062 | 230.136276 | -8.7202943 | 52.8855711 | 48.3326062 | -8.6090872 |
Peer Reviews
No public reviews on file for this paper yet. If you reviewed it on a platform where reviews are public (OpenReview, ICLR, NeurIPS, ICML), you can paste yours below so the community can read it here.
Videos
No videos yet. Explain this paper in a talk, walkthrough, or lecture? Add one.
Taxonomy
TopicsHip disorders and treatments · Orthopaedic implants and arthroplasty · Hip and Femur Fractures
Introduction
Dislocations of the hip are devastating orthopedic injuries that require urgent intervention. Among the elderly and frail population in the United States (U.S.), hip dislocations are the most common lower extremity joint dislocation [1]. According to Beebe et al., it is estimated that 46%-84% of all hip dislocations occur as a result of traffic accidents, traumatic falls, sporting injuries, and occupational injuries [2]. With hip dislocations, it is highly recommended to perform an anatomic reduction within six hours of injury to reduce the risk of developing avascular necrosis and post-traumatic osteoarthritis [3].
Patients with hip dislocations typically present with severe pain, immobility, and abnormal limb positioning. A flexed, abducted, and externally rotated hip points to an anterior dislocation, while a flexed, adducted, and internally rotated hip points to a posterior dislocation; the latter is more commonly encountered, comprising 90% of native cases [2, 4]. Furthermore, these injuries can be classified as simple or complicated. A simple dislocation is one without an associated fracture, whereas a complicated dislocation involves an associated fracture of the acetabulum, femoral head, or femoral neck [5]. Recognizing these characteristic presentations is critical, as they directly inform the urgency and method of intervention.
Additionally, hip dislocations may be treated non-operatively or operatively. Non-operative reduction of simple posterior dislocations involves techniques such as the Bigelow maneuver, in which longitudinal traction is applied with internal rotation of the hip [6]. Anterior dislocations involve longitudinal traction and external rotation, accompanied by pressure on the femoral head or pulling the femur laterally [7]. Pain management includes anti-inflammatories, physical therapy, or intra-articular steroid injections. However, complex dislocations or failed non-operative treatment of simple dislocations may require surgical interventions such as percutaneous fixation, open fixation, or replacement, including hemiarthroplasty or total hip arthroplasty (THA).
Regarding financial implications, Weber et al. found that patients admitted with a diagnosis of traumatic hip dislocation had increased lengths of stay and direct treatment costs as compared to other patients [8]. They experience added indirect costs of limited mobility and higher rehabilitation needs, which can also be seen following periprosthetic dislocations [8]. Furthermore, by 2034, it is estimated that the percentage of the U.S. population over 65 years of age will reach 25% [9]. Although the hip withstands force from multiple directions and recruits stability from many ligaments and muscles, these conforming forces begin to weaken and become unbalanced as a patient ages, predisposing them to hip dislocations [7]. Therefore, with a concurrent aging population, it may be expected that the prevalence of hip dislocations and their resulting economic burden will increase in the coming decades. However, the available information on temporal trends and geographical discrepancies of hip dislocations in the United States is limited. As such, this study aims to address that concern by offering a holistic national and regional assessment over 29 years.
Materials and methods
Data sources and study design
This study is a retrospective descriptive epidemiological analysis of hip dislocation burden in the United States from 1990 to 2019. It was done utilizing the Global Burden of Disease (GBD) dataset that was developed by the Institute for Health Metrics and Evaluation [10]. The GBD dataset is comprised of the epidemiological data of 369 diseases and injuries across 204 countries and spans from 1990 to 2019. To provide estimates and projections, the GBD utilizes data from numerous primary and secondary sources, including administrative data, census data, demographic surveys, geospatial data, and modeled data. The methods and development of the GBD dataset have been described at length, and the disease burden estimates have been previously validated. Utilizing the U.S. Census Bureau definitions, the data were stratified into four regions: the Northeast, the Midwest, the South, and the West.
Outcomes
The outcomes of interest in this study included years lived with disability (YLD), incidence, and prevalence of hip dislocations. The World Health Organization defines a YLD as “one full year of healthy life lost due to disability or ill-health" [11]. Age-standardized rates of YLDs, prevalence, and incidence per 100,000 people were collected and utilized for both males and females in this study, consistent with the Institute for Health Metrics and Evaluation (IHME) methodology. These data were collected for the entire U.S. population as well as each state. Institutional review board approval was not obtained for this study as it does not contain any protected health information, and all data have been de-identified and are publicly accessible. As the GBD database uses statistical modeling to address gaps in data coverage, including predictive covariates and ensemble modeling techniques, no additional imputation was required for missing data in this study.
Statistical analysis
The statistical analysis in this study mirrors analytical methods used in previously published GBD analyses. To assess the potential need for multiple comparisons, an analysis of variance (ANOVA) of all measures was performed. Bartlett’s test was performed to assess the variance of the dataset and to evaluate whether this difference was equal or unequal. If unequal variability was found, a Welch’s ANOVA test was performed to assess the differences in regional rates of YLDs, prevalence, and incidence. A Games-Howell. The post-hoc test was also utilized to perform multiple comparisons between regions in regard to mean rates of YLDs, prevalence, and incidence if the variance was unequal. If variability was equal, Tukey’s post-hoc analysis was used. Then, an independent t-test was performed to compare the mean YLDs, prevalence, and incidence rates between males and females per region and amongst the entire U.S. Statistical significance was defined as p < 0.05. All statistical analyses were performed using IBM SPSS Statistics software, version 29 (IBM Corp., Armonk, NY).
Results
National trends by gender analysis
From 1990 to 2019, the United States saw a 1.67% decrease in the mean rate of YLDs, a 0.32% decrease in the mean prevalence rate, and a 4.74% decrease in the mean incidence rate of hip dislocations over the 29 years. For the entire United States, men had a higher mean rate of YLDs and a higher mean prevalence rate; however, this difference did not reach statistical significance (p > 0.05). Men also experienced a higher mean incidence rate compared to women (p<0.001) (Figures 1a-1c).
Prevalence, mean years lived with disability (YLDs), and incidence of hip dislocation by genderFigure 1a illustrates the mean age-standardized prevalence per 100,000 by sex over the same period. Figure 1b illustrates the mean age-standardized years lived with disability (YLDs) per 100,000 for males and females from 1990 to 2019. Figure 1c displays the mean age-standardized incidence per 100,000 by sex.
Regional difference analysis
Regional analysis demonstrated that the western region had the highest mean rate of YLDs, the highest mean prevalence rates, and the highest mean incidence rates compared to all other regions (Figures 2a-2c). The Northeastern region experienced the lowest mean rates of YLDs, prevalence, and incidence rates of hip dislocation. Men had higher mean rates of YLDs in the Midwest (p=0.001), South (p<0.001), and West (p=0.004) regions. Men had a higher mean prevalence rate of hip dislocations in the South (p=0.007); however, no significant difference was noted in the Northeast (p=0.442), Midwest (p=0.209), or West (p=0.233) regions. Men had a higher mean incidence rate compared to women in all regions (p<0.001).
Comparison of mean years lived with disability (YLDs), prevalence, and incidence by regionFigure 2a shows the mean age-standardized YLDs per 100,000 by region. Figure 2b presents the mean age-standardized prevalence per 100,000 by region. Figure 2c illustrates the mean age-standardized incidence per 100,000 by region.
State-level analysis
Illinois experienced the highest increase in mean rate of YLDs (18.01%) and incidence (15.03%), while New Hampshire experienced the highest increase in mean prevalence rate (20.02%) (Table 1). New Mexico experienced the greatest decrease in mean rates of YLDs (22.93%), while Alaska experienced the greatest decrease in mean prevalence (19.60%) and mean incidence rates (21.03%) of hip dislocations (Table 1).
Discussion
Based on the temporal trend, the findings suggest an improvement in prevention and management techniques for hip dislocations. The significant reduction in the incidence rate is likely due to advancements in diagnostic technologies and improved preventive measures in managing the condition. Clegg et al. stated that the use of multidetector CT, hip arthroscopy, and MRI has enormously influenced the understanding and management of hip dislocations, as they are now able to reveal parts of the anatomy and diagnostic information on displaced femoral heads that were not possible with conventional CT [4]. The impact of this improvement in technology may suggest an explanation for the reduction in the incidence and prevalence rates seen in the current study.
We found a significant gender difference where the mean YLDs, prevalence, and incidence rate of hip dislocation are higher for men than for women. This description had two important points. First, hip dislocation in men can be higher due to an increased exposure to high-energy trauma like motor vehicle accidents and contact sports. This is fairly consistent with previously published literature reporting that men had an elevated risk of hip dislocation. A study by Weber in 2022 reported that traumatic hip dislocations mostly affected males in high-energy mechanisms, including motor vehicle accidents and contact sports [8]. This echoes the results of the current study, where we observed that high-energy trauma mostly affected the high-risk male population; hence, this population needs more emphasis on preventive measures. Moreover, our findings parallel previous results from Gillinov and colleagues, who studied hip dislocations after total hip arthroplasty [12]. The team similarly found that even after surgery, younger age, female sex, and combined comorbidity indices signaled an increased risk of postoperative instability cases [12]. Reporting among 1,517 patients undergoing primary THA, the study’s authors found that 2.3% of patients experienced a dislocation within the first two years, of which 30% reported recurrence [12]. These results mirror the general trend of higher-risk groups, but the increased incidence rate among men in the present study also indicates that gender-specific factors might be involved in post-arthroplasty outcomes through different mechanisms.
In the regional analysis, the mean rates of YLDs, prevalence, and incidence of hip dislocation were highest in the South, and those were lowest in the Northeastern region of the US. Specifically, males in the South have the highest incidence rate of all four regions, with a rate of 50.14 per 100,000. For females, the West leads with 41.15 per 100,000. Some of these differences can be explained by the demographics and lifestyles associated with these regions. For example, favorable weather found in the South and West has been associated with higher physical activity times among older adults, which may be contributing to the higher incidence of hip dislocations in these regions [13]. The overall higher rate among men could be explained by the fact that males are more likely than females to play high-level sports, perform hard manual labor, and engage in other high-risk leisure activities that lead to trauma [14-16].
Notably, our study revealed that Illinois had the highest increase in mean rates of YLDs (18.01%) and incidence (15.03%). Potentially contributing to this rise is the fact that the state’s fastest-growing population is the group aged 65 or above, rising by 33.9% between 2010 and 2022 [17]. Beyond age, traumatic injuries like automobile accidents may also be contributing to this state’s growth in YLDs and incidence. Thus, we suggest that the Illinois Department of Transportation further investigate statewide data on automobile accidents to identify modifiable risk factors and redesign physical roadways and their laws as needed [18].
In contrast to Illinois, New Mexico had the largest decrease in YLDs (22.93%), and Alaska had the largest decrease in prevalence (19.6%) and incidence (21.03%). The reduction in hip dislocation injuries in New Mexico could be due to the 2006 implementation of the statewide Department of Transportation Highway Safety Improvement Program (HSIP), using a data-driven approach to improve safety on our roads and reduce injury and fatal crashes on our state roadway system [19]. Another important contributor in New Mexico to these improvements has been Safer New Mexico Now’s programs that provide public education, as well as enhanced law enforcement efforts such as Click It or Ticket that reduced alcohol-related crashes and increased seat belt use [20]. Alaska has similarly enjoyed a decline in hip dislocations, likely due in part to educational online programming from its statewide Senior Fall Prevention program, from its Commission on Aging [21].
Additionally, hip dislocations were observed to decrease drastically over the investigated timeframe. A decrease in hip dislocations can be attributed to advances in diagnostic technologies, such as multidetector CTs, hip arthroscopies, and MRIs [22]. This, as a result, indicates that advances in prevention and management strategies are effective.
Furthermore, regional variations in hip dislocation rates reflect possible demographics, lifestyle, and environmental influences. Compared to the Northeast, the South had the highest mean rate of hip dislocation, which emphasizes the need to alternate interventions based on regional characteristics. Finally, the rate of hip dislocations in Illinois had notable increases, whereas it decreased significantly in areas such as New Mexico and Alaska. This suggests the impact of policy and program interventions. As mentioned earlier, it is estimated that by 2034, 25% of the U.S. population will be over the age of 65 [9]. Therefore, the need to continue efforts to improve preventative measures and diagnostic tools is essential so that hip dislocations can be mitigated as much as possible.
This study has several limitations concerning the modeled data used from the GBD database. A key limitation of this study is the lack of data from 2019 onwards during our data collection and analysis process. This lack of access could limit our evaluation of recent patterns and may affect the applicability of the results to contemporary situations. Additionally, input measurements such as coding practices would influence over time changes, while reporting gaps for specific injuries could impact some estimates. Data discrepancies across regions may reflect different infrastructure and healthcare access or even true differences in reporting and diagnosis capacity instead of actual incidence variation. In addition, the ecological nature of the data restricts control for confounding factors like socioeconomic status, comorbidities, and injury mechanisms beyond broad groupings. Addressing these trends requires understanding their individual-level risk factors through prospective cohort studies. Moreover, intervention trials at the regional level combined with statewide systems for monitoring hip dislocation injuries may evaluate public health impacts and discover changeable determinants postulated by them.
Overall, this study presents a critical sex- and region-based disparity that informs resource allocation planning alongside targeted prevention, exposing modifiable determinants, which is novel in the longitudinal epidemiological review of hip dislocations in the U.S.
Conclusions
Overall, this detailed examination of hip dislocation occurrences in the U.S. between 1990 and 2019 has given us insights into its regional spread and related factors. Our study highlighted gender differences in incidence, prevalence, and YLDs of hip dislocations, consistently showing higher rates among men. This overall underlines the necessity for targeted measures for at-risk male groups involved in activities like high-impact sports or vehicle accidents. By understanding the trends in hip dislocations and associated injuries, we can enhance technology and treatment methods. We hope our findings guide future improvements in the prevention of injury and the development of diagnostic tools to improve the treatment of hip dislocations. Indeed, such measures can be most effective through concerted intervention aimed at at-risk populations residing in the regions with the highest incidence and prevalence rates.
The reference list from the paper itself. Each links out to its DOI / PubMed record.
- 1Managing dislocations of the hip, knee, and ankle in the emergency department [digest]Emerg Med Pract Arnold C Fayos Z Bruner D Arnold D Gupta N Nusbaum J 12192017 https://pubmed.ncbi.nlm.nih.gov/29261271/29261271 · pubmed ↗
- 2Treatment of hip dislocations and associated injuries: current state of care Orthop Clin North Am Beebe MJ Bauer JM Mir HR 5275494720162724137710.1016/j.ocl.2016.02.002 · doi ↗ · pubmed ↗
- 3Traumatic hip dislocation-a review Bull NYU Hosp Jt Dis Sanders S Tejwani N Egol KA 9196682010 https://pubmed.ncbi.nlm.nih.gov/20632983/20632983 · pubmed ↗
- 4Hip dislocations-epidemiology, treatment, and outcomes Injury Clegg TE Roberts CS Greene JW Prather BA 3293344120101979676510.1016/j.injury.2009.08.007 · doi ↗ · pubmed ↗
- 5Hip dislocation: evaluation and management J Am Acad Orthop Surg Foulk DM Mullis BH 1992091820102035722910.5435/00124635-201004000-00003 · doi ↗ · pubmed ↗
- 6Luxations of the hip-joint Boston Med Surg J Bigelow H.J 6567821870
- 7Desolation of the hip: a review of types, causes, and treatment Ochsner J Dawson-Amoah K Raszewski J Duplantier N Waddell BS 2422521820183027578910.31486/toj.17.0079 PMC 6162140 · doi ↗ · pubmed ↗
- 8Traumatic hip dislocations in major trauma patients: Epidemiology, injury mechanisms, and concomitant injuries J Clin Med Weber CD Lefering R Sellei RM Horst K Migliorini F Hildebrand F Trauma Register Dgu 4721120223515992510.3390/jcm 11030472 PMC 8837148 · doi ↗ · pubmed ↗