Modeling of Linear Die Filling Based on Dimensional Analysis Using DEM-CFD Methods
Jie Li, Sunsheng Zhou, Shiyan Yan, Yuanqiang Tan, Jiangtao Zhang

TL;DR
This paper develops a model for powder die filling using dimensional analysis and simulations to improve industrial processes.
Contribution
A novel semi-empirical model for linear die filling is proposed using dimensionless parameters derived from DEM-CFD simulations.
Findings
Filling ratio increases with dphD−1 and ρpρg−1 due to higher drag force.
Filling ratio decreases with vρgLDμ−1 due to reduced effective filling time.
A semi-empirical model was developed using (dphD−1)90 as a critical value.
Abstract
Linear die filling is currently widely employed in industries. However, there is no comprehensive and systematic model to describe the powder die filling process. This paper utilizes dimensional analysis to extract and analyze various factors that affect the flow characteristics of powder based on DEM-CFD simulations. Several dimensionless parameters including the ratio of particle size to die depth (dphD−1), solid density number (ρpρg−1), shoe speed number (vρgLDμ−1), and force number (GpFDrag−1) were proposed based on the Pi theorem. The results showed that the filling ratio δ increased with the increase in dphD−1 and ρpρg−1 due to GpFDrag−1 rising. But it decreased with the increase in vρgLDμ−1 due to the shortening of effective filling time. Finally, a semi-empirical modeling of linear die filling was developed, taking the critical value (dphD−1)90 as the dependent variable and the…
Genes, proteins, chemicals, diseases, species, mutations and cell lines named across the full text — each resolved to its canonical identifier and authoritative record.
Click any figure to enlarge with its caption.
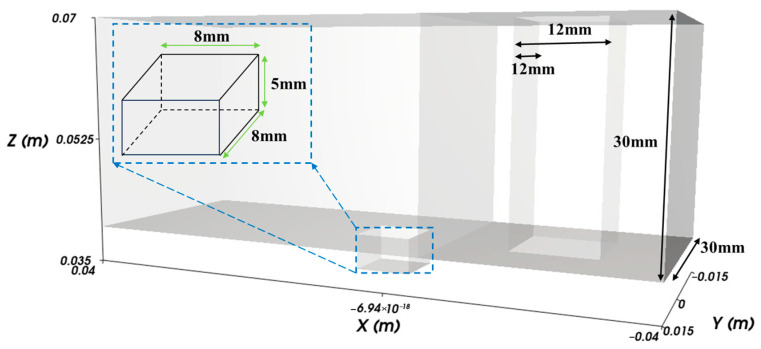 Figure 1
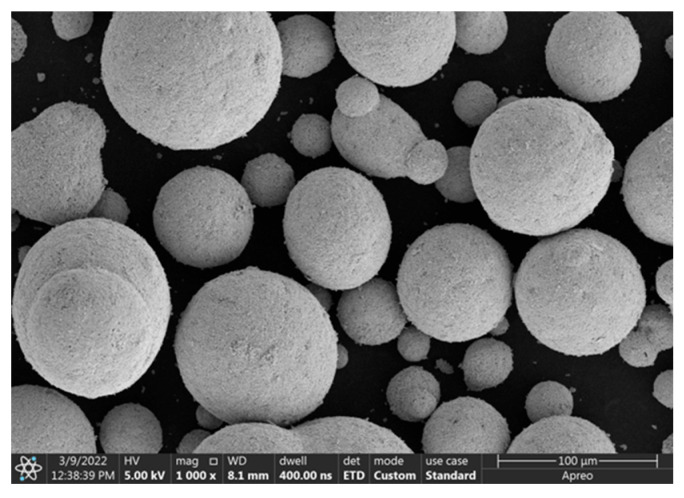 Figure 2
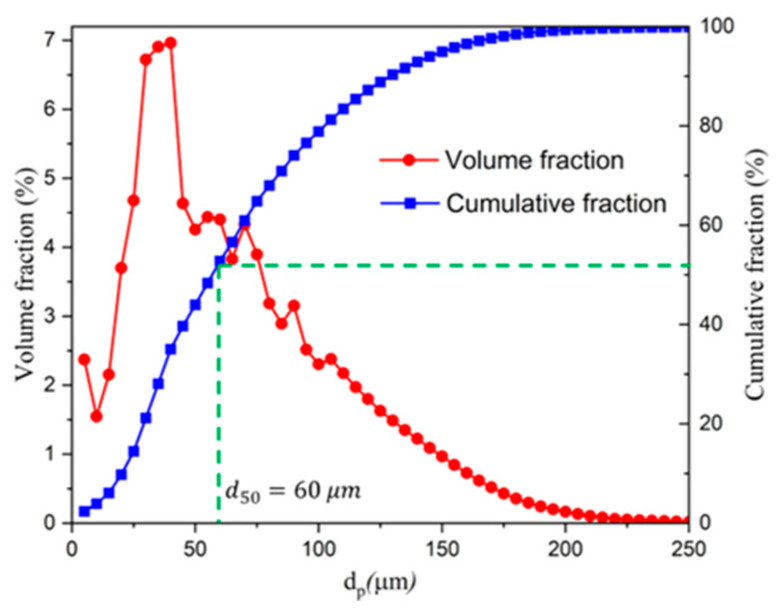 Figure 3
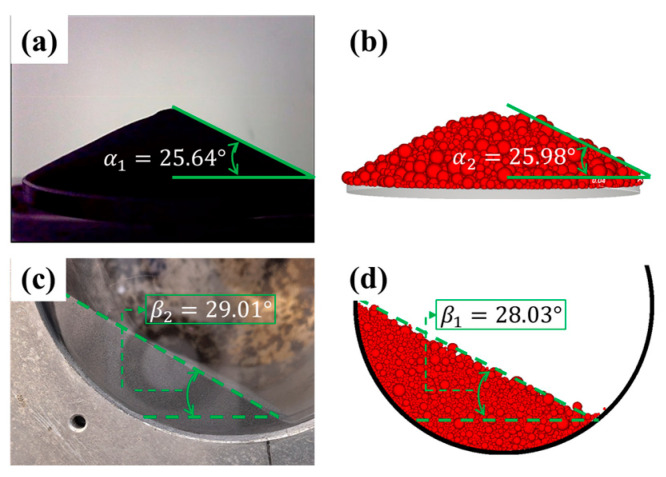 Figure 4
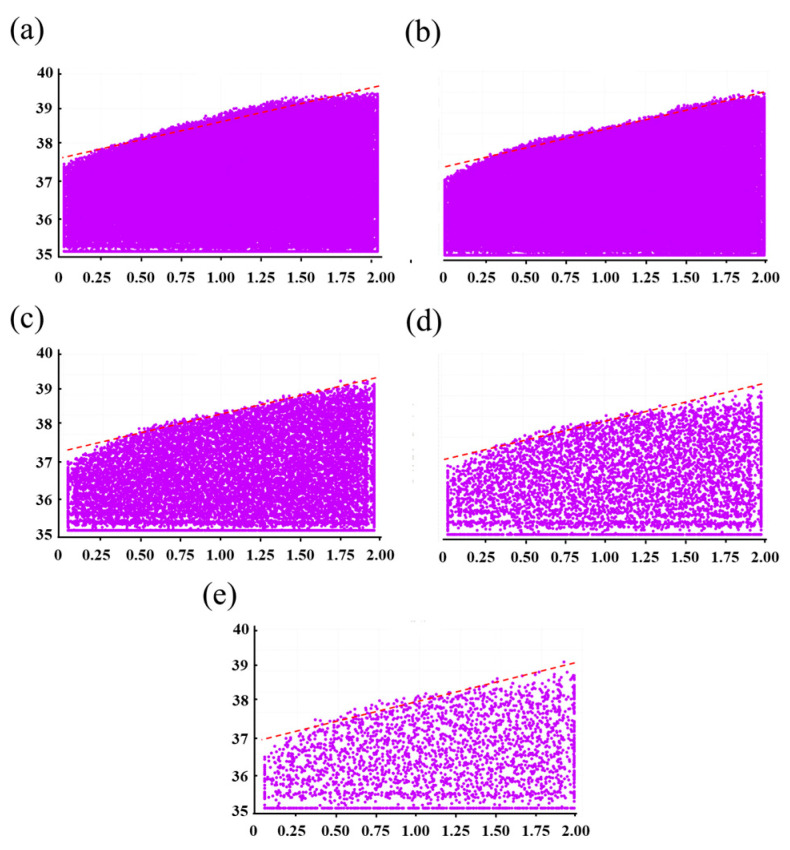 Figure 5
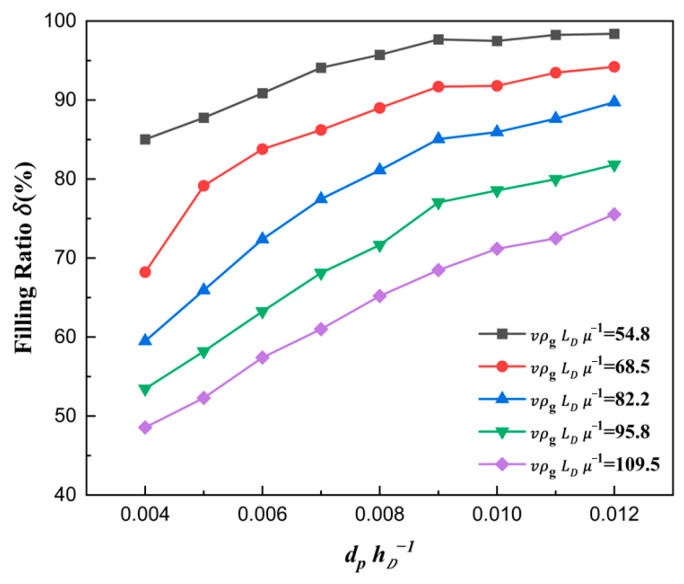 Figure 6
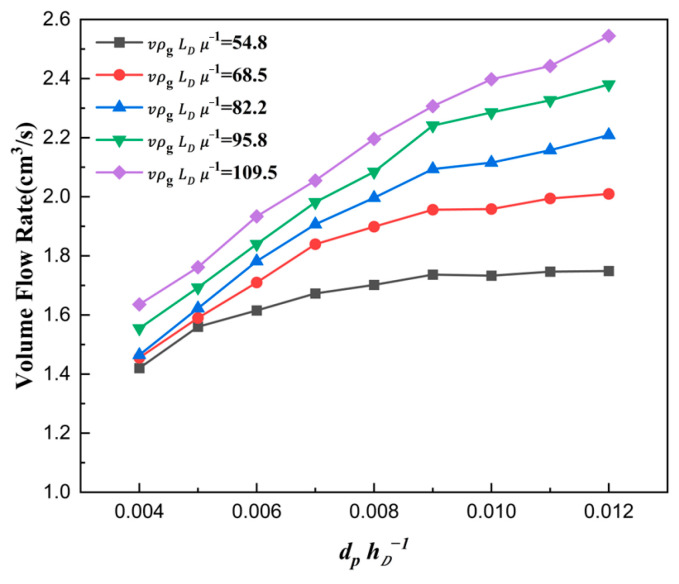 Figure 7
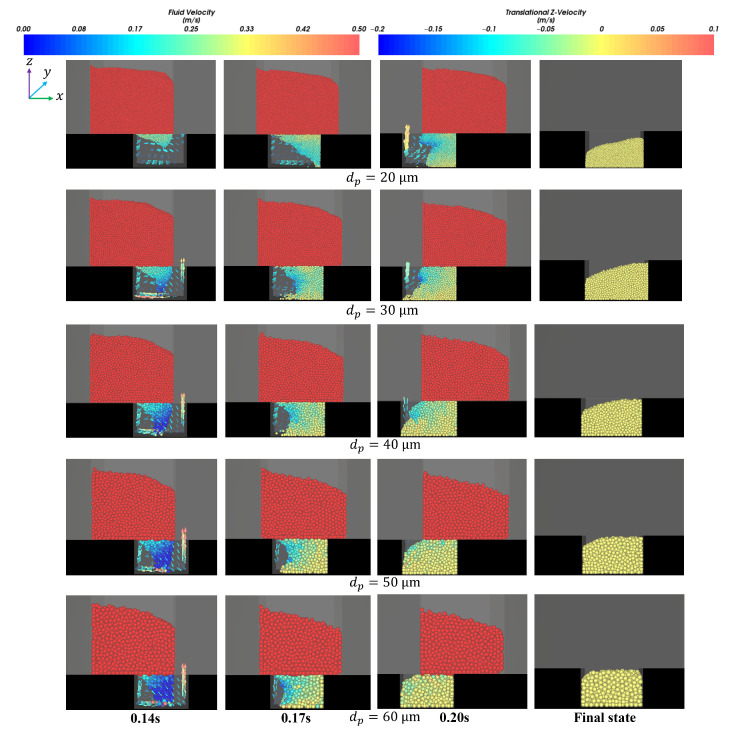 Figure 8
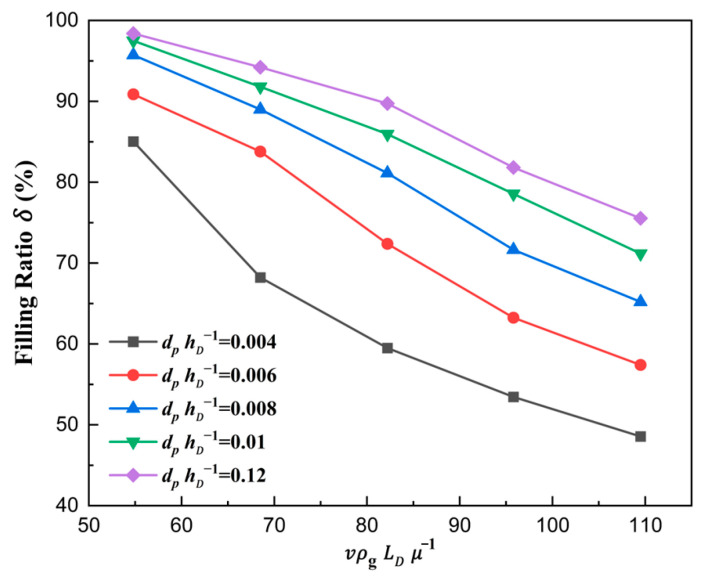 Figure 9
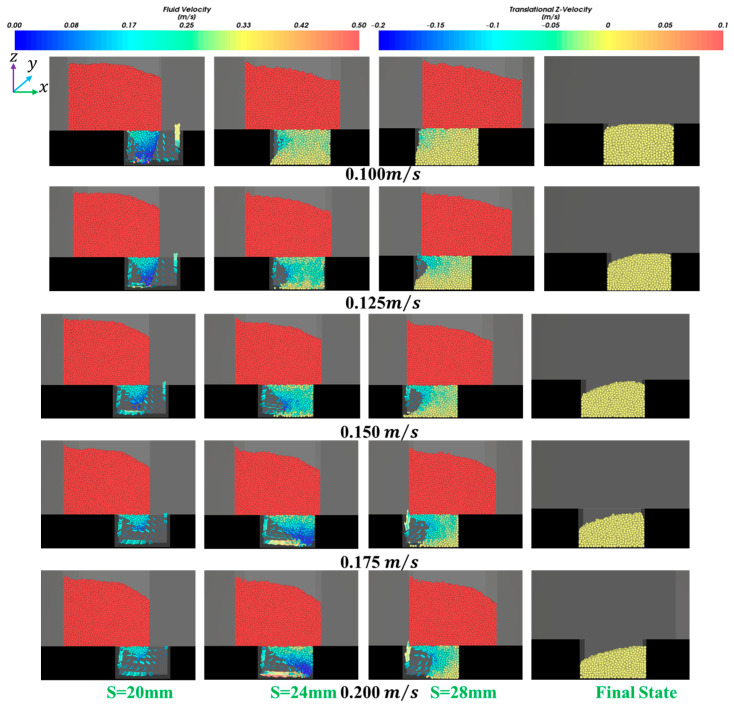 Figure 10
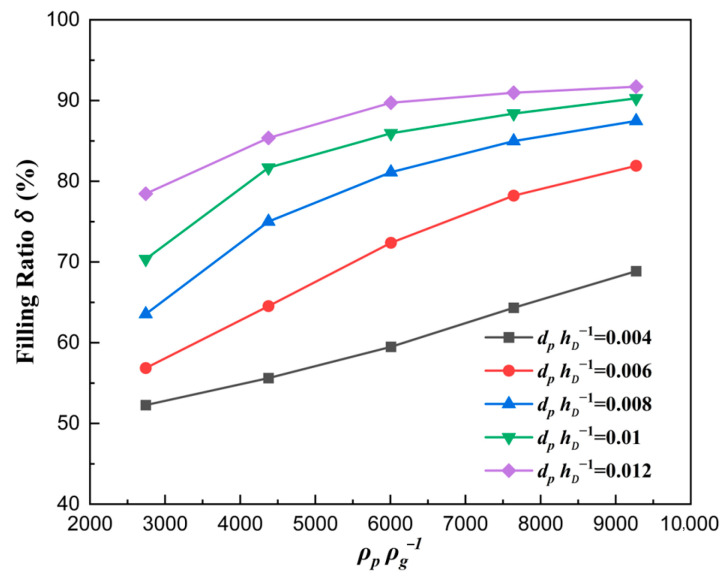 Figure 11
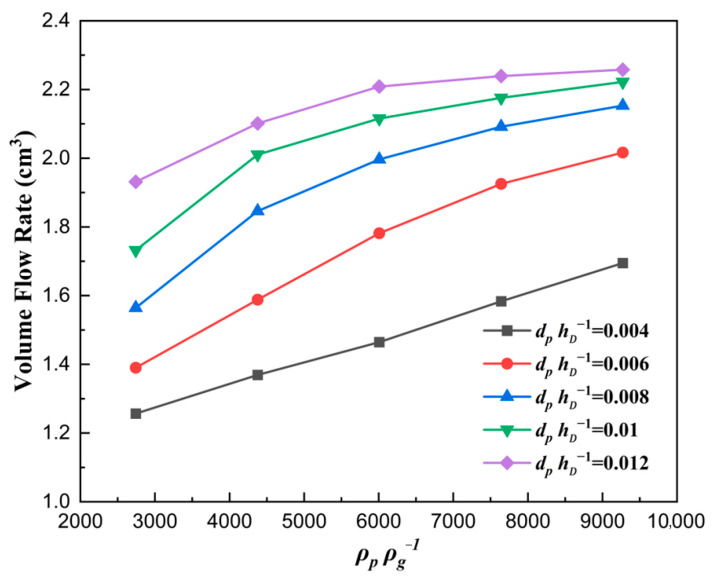 Figure 12
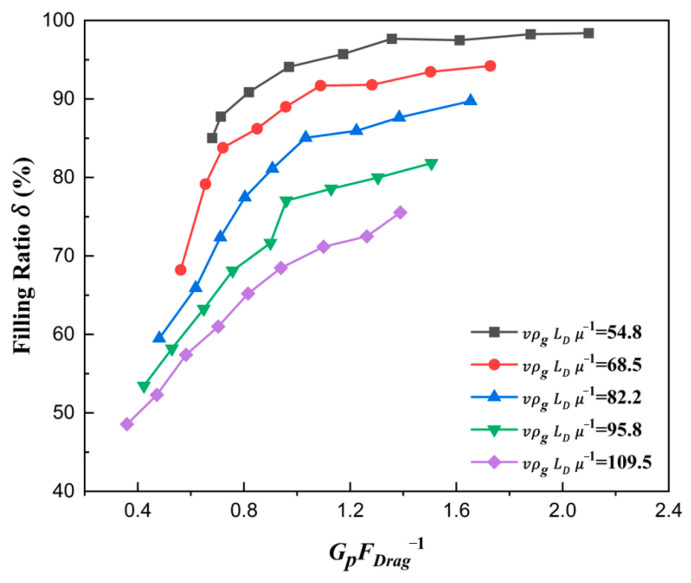 Figure 13
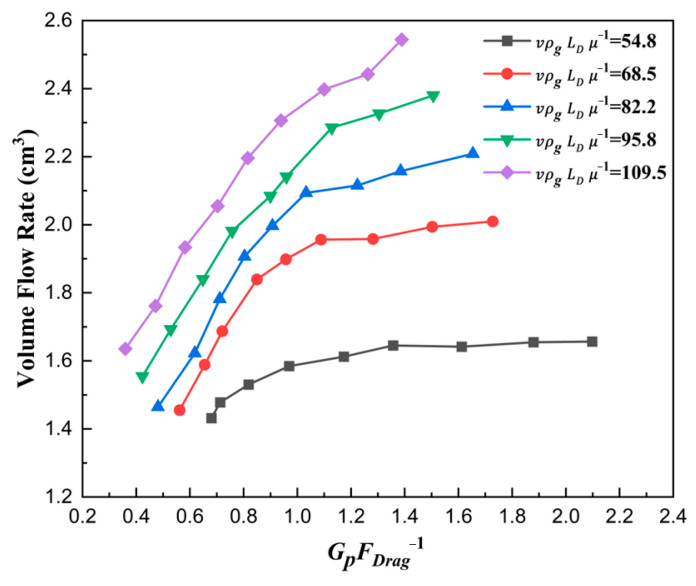 Figure 14
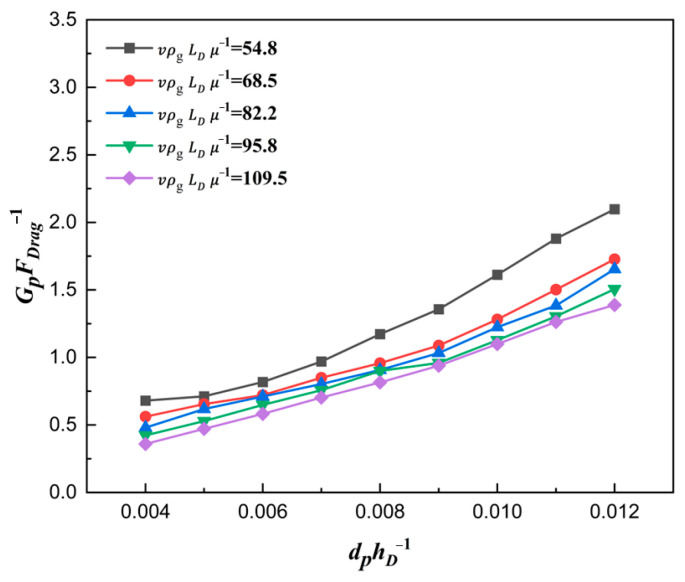 Figure 15
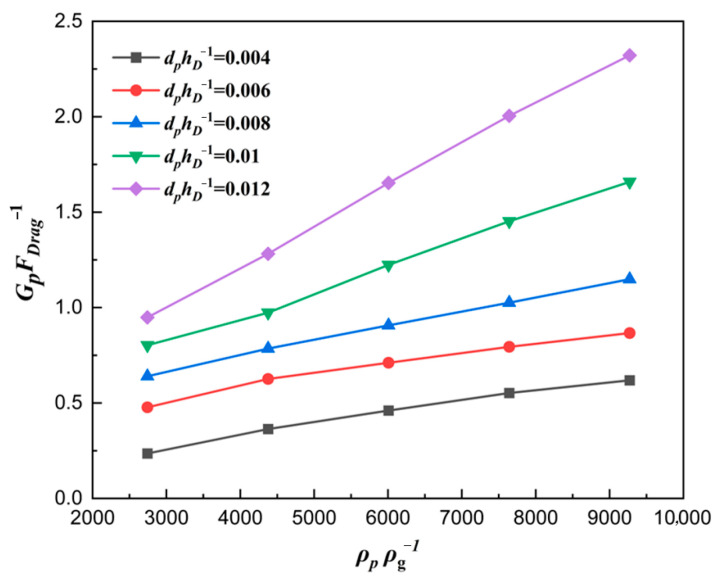 Figure 16
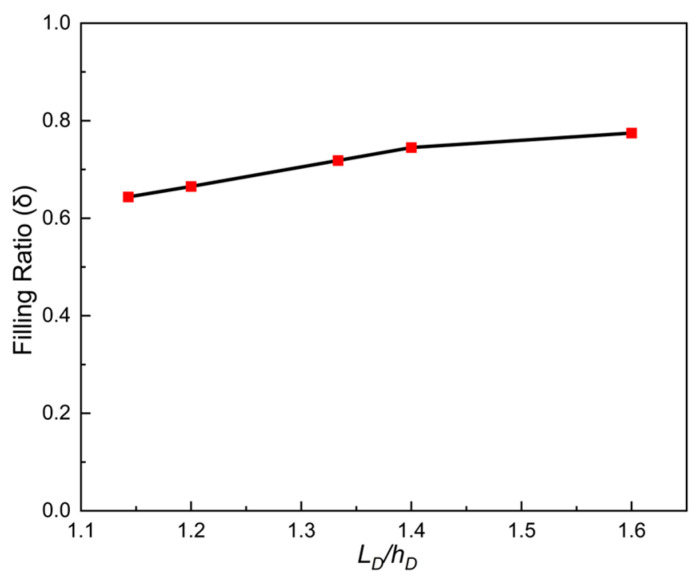 Figure 17
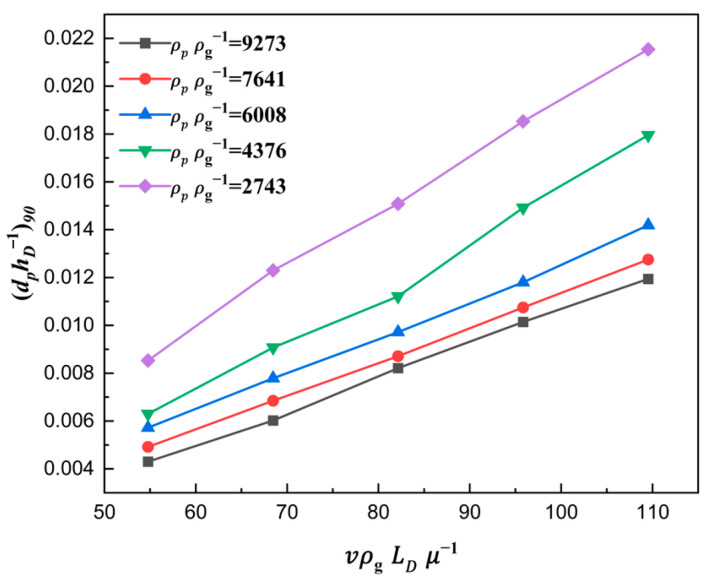 Figure 18
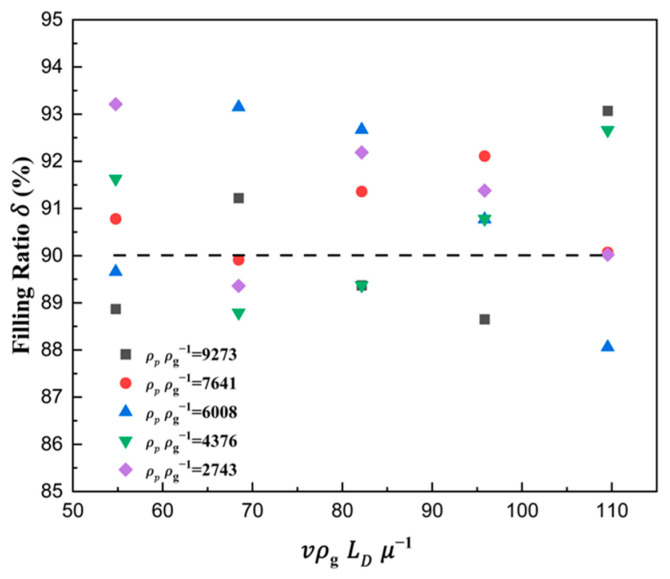 Figure 19
- —High-Level Talent Recruitment Project in Quanzhou, China
- —Science and Technology Plan Project in Quanzhou, China
Peer Reviews
No public reviews on file for this paper yet. If you reviewed it on a platform where reviews are public (OpenReview, ICLR, NeurIPS, ICML), you can paste yours below so the community can read it here.
Videos
No videos yet. Explain this paper in a talk, walkthrough, or lecture? Add one.
Taxonomy
TopicsGranular flow and fluidized beds · Mineral Processing and Grinding · Fluid Dynamics Simulations and Interactions
1. Introduction
Die filling serves as the fundamental procedure determining the quality and performance of powder products as it directly controls powder fill mass homogeneity while concurrently affecting the green compact’s structural integrity [1]. There are some factors influencing quality and strength, such as the filling process [2], powder properties [3], geometrical parameters [4,5,6], and the airflow [7,8,9,10] inside the die. Generally, powder properties determine flowability, which influences filling efficiency significantly; geometrics, mainly referring to the shape and size of dies, also play a role; and airflow hinders the falling of particles. The selection of process parameters is mainly based on experience, which often leads to suboptimal parameter combinations. In the worst case, incomplete filling may occur, resulting in the quality of products not meeting usage requirements [11]. Up to now, there has been no comprehensive and systematic analysis or filling model to describe and instruct the filling process. Therefore, a comprehensive investigation and systematic research must be undertaken.
Linear die filling is a typical case. Researchers have analyzed operational protocols in device systems. Shoe speed is a major process parameter. The critical velocity proposed experimentally [3] is the maximum shoe speed at which complete filling just occurs, which is a classical model [6]. Furthermore, enhancing the flowability by improving powder properties is also a better choice. Large [12], near-spherical [3,11], and heavier particles [5] have better flowability. The flow features are different and generally divided into three types: nose flow, bulk flow, and intermittent flow [6]. Nose flow is observed as a phenomenon where powder migrates rearward along the shoe, forming nose flow, driven by inertial forces during shoe acceleration and powder-base frictional resistance. Nose flow allows surface particles to exhibit enhanced mobility while facilitating rapid air venting from the die, jointly boosting fill efficiency. As the nose flow front advances, shear-induced detachment occurs in powder layers that slide across the base plane, which is referred to as “bulk flow”. Furthermore, the bulk flow is dominant under high shoe speeds. Intermittent flows often occur when powders are cohesive [13], when the flowability is bad. The shape and depth of dies also have some influence on the filling ratio. For example, when powder is filled into a stepped mold, the corner gaps cannot be filled [14]. Schneider [13] found that the amount of powder filling the die in vacuum was more than that in the presence of air at the same shoe speed, and the vacuum conditions increased the critical velocity compared to air-filled systems. The differences between linear and rotary die filling were investigated by Zhong [15], and the results demonstrated that poor-flowing powders exhibit marginally superior fill performance in linear dies versus rotary configurations, whereas free-flowing powders achieve comparable results in both systems. In addition, the effects of moisture content [16] and agitator structure [17] on fill performance were studied.
In order to strengthen flowability, suction is introduced. Suction filling can improve filling efficiency under the same shoe speed condition compared to gravity filling, and the critical velocity in suction filling is generally less than that in gravity filling [4,18]. In addition, the improvement effect of suction filling is more pronounced for powders with poor flowability. For example, the flowability of cohesive powders is enhanced more significantly than that of free-flowing powders [19]. In addition, the tendency for segregation during suction filling is also reduced [20]. However, the cost of suction filling equipment is higher in industrialization. The majority of the above achievements are based on experimental research. Existing filling models derived from laboratory studies show limited transferability to industrial-scale engineering design. Therefore, the discrete element method (DEM) has been widely employed in handling bulk materials. Due to the non-negligible effect of air, computational fluid dynamics (CFD) coupled with the DEM is currently widely applied. The DEM-CFD method is employed extensively in multiple disciplines such as crop residue cleaning [21], materials conveying [22], throttle valve erosion [23], and particle deposition [24]. The reliability of this method has been extensively demonstrated.
The DEM-CFD method for linear die filling was investigated [5,8,9,25], and the analysis revealed that air had obvious impacts on powder flowability. Specifically, low-density and fine particles are more sensitive. Therefore, the air enhances the density segregation tendency and weakens the size segregation tendency. Furthermore, the particle’s sensitivity to the air could be described by a dimensionless parameter , where particles can hence be classified into two regimes with a critical value of the dimensionless parameter ( ). These include air-sensitive particles ( ), for which air has a significant impact on powder flow, and air-inert particles ( ), for which the impact of air can be neglected. However, the dimensionless parameter cannot take the geometric parameters of the die into consideration, and for air-sensitive particles, there is no further study exploring the correlation between the dimensionless parameter and the filling ratio.
Industrial particle systems exceed single-node computational feasibility, requiring distributed computing [26]. Consequently, the coarse-graining methodology (CGM) is implemented to achieve computationally tractable gas–solid flow simulations. The CGM simulations have been validated for dense granular regimes, such as bubbling fluidized beds [27,28], pneumatic conveying systems [29], and spouted beds [30,31]. In addition, the CGM has undergone rigorous verification and validation against benchmark cases [26,32], where the simulation results exhibit quantitative agreement with experimental measurements within a relative error of 3%. In addition, linear die filling based on the DEM-CFD method with CGM was introduced and verified by Xie [31].
Above all, these studies mainly focused on a single factor or aspect. The model of mass flow rate of linear die filling was established by Schneider [13] based on dimensional analysis, but the solid density was neglected. The critical velocity is only an indicator that cannot be directly used in industry due to its recalibration when the material changes. Schomberg et al. experimentally derived a fill process model for rotary tablet presses [11], which, however, is not applicable to linear filling.
Therefore, the applicability and promotability of the current models and findings on linear die filling are limited and cannot take all impact factors into account. In this paper, dimensional analysis was used to explore the complicated interactions among powder properties, process parameters, and geometric parameters in the presence of air. The coarse-graining DEM-CFD coupled method was adopted, and air-sensitive particles such as fine and lighter particles were focused on. The aim of the study is to reveal the mechanism of linear die filling and establish the correlations among these parameters comprehensively. Furthermore, developing a semi-empirical model to predict the filling results is the ultimate goal.
2. Numerical Modeling
This section presents details about the mathematical approach, including the discrete element method and computational fluid dynamics.
2.1. Discrete Element Method
The DEM is employed to model the motion of solid particles. In DEM simulations, contact forces between particles are introduced and Newtonian motion equations are solved to obtain physical information about the particles’ behavior over time. Forces and torques acting on each particle facilitate their translation and rotation, with the relevant equations shown below.
and
where , , , and were the mass, linear velocity, moment of inertia, and angular velocity of particle i, respectively. g is the gravitational acceleration, is the contact forces between particles and wall, is the interaction force between particle and air (mainly drag force), and represents the torque arising from the tangential force . and are the normal force and tangential force, respectively. Boldface symbols denote vector quantities.
In this study, the Hertz contact model is employed to determine the normal contact force on particles during contact, and the Mindlin and Deresiewicz model is used for the tangential force [33,34,35]. The normal component of the contact force is given by the following equation:
where , , and are the normal stiffness, normal overlap, and normal damping coefficient, respectively. The first term on the right-hand side of the equation represents the repulsive force on the particles, while the second term represents the energy dissipation before and after contact.
And the tangential force is defined as follows:
where , , and represent the tangential stiffness, tangential overlap, and tangential damping coefficient.
The drag force between particles and air is given by
where , , , and represent the drag coefficient, fluid density, projected area of particle i in the flow direction, and fluid velocity, respectively. A_i_ is calculated as follows:
is the size of particle i. The Gidazpow, Bezburuah & Ding [36] drag correlation covers the entire range of solids (particle phase) volume fraction (from 0 up to the maximum packing limit) but presents a discontinuity at the point . To ensure a smoother transition between the Ergun [37] correlation in Equation (9) and the Wen & Yu [38] correlation in Equation (10), Huilin & Gidazpow [39] applied a blending function in Equations (7) and (8) to promote the connection based on the fluid volume fraction .
where φ, , and represent the blending parameter, the drag coefficient of Ergun, and the drag coefficient of Wen & Yu, which are written as follows:
where and are the sphericity of the particle and the particle’s Reynolds number. In this research, a sphere particle is selected, . is calculated as follows:
where is the dynamic fluid viscosity.
2.2. Computational Fluid Dynamics
The air is treated as a continuum and modeled using CFD, in which the continuity and momentum equations are considered.
and
where is the viscous stress tensor, g is the gravitational acceleration, and f is calculated by summing up the fluid–particle interaction force given in Equation (14) and divided by the volume of the CFD grid as
where N is the number of particles in the CFD grid and V_mesh-grid_ is the volume of the CFD grid. The two-way coupling between the solid and fluid phases can be implemented by Equation (12).
The geometric dimensions of the linear filling system are much larger than the actual particle sizes, resulting in an excessively large particle system. During the handling of bulk materials, the estimated number of particles can reach billions, making simulation computations too extensive. Therefore, this paper adopts a coarse-graining DEM for particle scaling. The coarse-graining DEM approach involves replacing many particles with the same properties (such as density and mass) with a single large particle, termed as coarse-grained particles after replacement [32]. In conjunction with fine particle sizes and equipment geometric dimensions, this study selects a scale-up factor of 10 for the coarse-grained particle model, which is explained in Section 3. Details regarding the scaling criteria of particle material properties can be found in these studies [26,29,31,40,41,42,43,44].
2.3. Simulation Conditions
The geometry of the powder die filling system is illustrated in Figure 1. The system consisted of a shoe, a table, and a die. The domain size of the system was 80 mm, 30 mm, 30 mm in the x, y, and z directions. The size of the shoe was 12 mm, 12 mm, and 30 mm in the x, y, and z directions. The die was a rectangular cavity, and the size of the die was 8 mm, 8 mm, and 5 mm in the x, y, and z directions.
In DEM, parameter calibration is key to ensuring the accuracy and reliability of numerical results. In our research, WC-10Co, in which the powder material is composed of a WC matrix with a 10 wt% Co binder phase, was selected as the main subject. The solid density of the particles is 11,360 kg/m^3^, which is a relatively heavy particulate material. The density range of 336011,360 kg/m^3^ was selected in our research, which covers the density of all particulate materials. And the interval of the density range is 2000 kg/m^3^. Figure 2 shows the SEM images of the powder particles. And it can be seen that the particles have good sphericity. Therefore, sphere particles were used in DEM. Figure 3 shows the size distribution of particles from a dynamic particle size and shape analyzer, “CAMSIZER X2”. By combining it with the sensitivity coefficient of particles to air, proposed by Guo [8], it is calculated that when the particle size does not exceed 60 , the particles are all air-sensitive. Therefore, the size range of 2060 was considered and used in DEM, with a size interval of 10 . The sensitivity coefficient was calculated as follows:
The contact model of normal force was a Hertzian spring–dashpot model, and the contact model of tangential force was a Mindlin–Deresiewicz model [35]. The static and dynamic repose angles were used to calibrate and validate the inertial friction and rolling resistance, as shown in Figure 4.
During the calibration, the CGM (coarse-graining model) was adopted and the scale-up factor was set to 10. In addition, the gas density was set to 1.225 kg/m^3^, and the viscosity of the air was set to Pa s in CFD. The other parameters in DEM, such as restitution coefficients and shoe speed, were determined from a dropping test and industrial experience. The parameters in DEM and CFD coupling are listed in Table 1.
In order to verify the accuracy of the scale-up factor and select a suitable one, in our research, the CGM scale-up factors were set to 1, 4, 6, 8, and 10, as shown in Table 1, where the particle size is 40 , the solid density is 7360 kg/m^3^, and the shoe speed is 0.150 m/s. The simulation of die filling was conducted with different scale-up factors.
Figure 5 presents a typical scatter plot of powders inside the die after filling. When different scale-up factors from Figure 5b–e were used, a similar phenomenon was observed: the pile surface of powders formed and sloped up from the left side to the right side, similarly to the initial particle system in Figure 5a. The angle of the pile surface was selected as an indicator and maintained in a narrower range from 14.52° to 14.77°. Table 2 showed the filling ratios of the CGM with different scale-up factors. Although the scale-up factors changed in the selected range from 1 to 10, the filling ratio always remained around 50.7%. Therefore, the coarse-grain system has similar characteristics to the original system, and a scale-up factor of 10 was selected to ensure an acceptable computational load of the simulation.
To analyze the influence of the breadth depth ratio of dies, the widths of the dies were 6 mm, 7 mm, and 8 mm, respectively. The depths of the dies were 5 mm, 6 mm, and 7 mm, respectively.
For the initial condition in each simulation, the particles were generated randomly inside the shoe cavity. In order to make a fair comparison among different conditions, the CFD grid size was set equivalently in all cases. As a matter of course, the CFD grid size should be slightly larger than the maximum particle size due to the volumetric diffusion technique. The time step for DEM was self-adaptive, varying from to s, and for gas dynamics, it was set to s. ROCKY4.4-DEM was adopted to simulate the motion of particles, and FLUENT2020R1-CFD was used to calculate the air dynamics.
3. Results and Discussion
The key physical variables related to the induced airflow were obtained by Li [45,46], and the semi-empirical equation for induced airflow velocity were derived based on similitude theory. In addition, the model of linear die filling on mass flow rate was derived by Schneider based on dimensional analysis. Following this method, the parameters affecting die filling are presented as follows: shoe speed , the depth of the die , size of the cross section , density of air , air viscosity , solid density , particle size , particle gravity , drag force , and filling ratio . All physical variables may be described using three basic dimensions: , , and . , , and were selected as independent variables with dimensions of , , and . The dimensions of the remaining six variables , , , , , and were , , , , , and . The theory of Buckingham Pi was used, and the shoe speed can be written as follows: . The corresponding dimensional equation can be written as follows: . It can be obtained by solving the equation: , , , . In the same manner, the π-terms of the remaining five physical variables can be obtained: , , , , and . Since the fill ratio was inherently a dimensionless parameter, no transformation was required. In addition, by letting , , four dimensionless parameters were obtained: , , , and . The physical meanings of the four dimensionless parameters were as follows: the ratio of particle size to die depth , the solid density number , the shoe speed number and the force number .
The ratio combined particle size and die depth . Generally, the larger the value of is, the less sensitive the particle is to air. To some extent, the airflow inside the die cavity will hinder the filling of particles. In addition, the solid density number means that particles heavier than air are more insensitive to airflow. And the shoe speed number consisting of the process parameter (shoe speed ), air properties, and die size (die width) denotes that a higher shoe speed needs to be matched with a larger die width to achieve complete filling. Above all, the filling ratio will be a function that is related to the ratio number , solid density number , and shoe speed number , which is as follows:
Taking the filling ratio as the evaluation index, the influence mechanism and law of each dimensionless parameter on the die filling process were analyzed. The fill ratio was calculated as follows:
where , , , , and are actual filled mass, complete filled mass, actual filled volume, volume of die cavity, and bulk density of particles, respectively. The actual filled volume is directly related to particle size , and the volume of die cavity is related to die depth and die width . Therefore, the left of Equation (17) can be simplified as . Combining with Equation (16), Equation (18) can be induced as follows:
The ratio number was extracted separately, and Equation (19) was further derived as follows:
3.1. The Effect of Ratio Number
The curve obtained by using Equation (17) is plotted in Figure 6. It can be seen that the filling ratio increased with the increase in ratio number . This can primarily be attributed to two aspects. On the one hand, the increase in indicated that the particle size increased faster than the depth of die . Due to being heavier and having a larger inertia, larger particles generally have better flowability than smaller ones. On the other hand, air escaped more easily and quickly in shallower dies than deeper ones, which made the particles less sensitive to air. Therefore, the volume flow rate of particles also rose with the increase in , as shown in Figure 7, which effectively explains the above law in Figure 6.
It can also be seen from Figure 6 and Figure 7 that the filling ratio and volume flow rate changed slowly when the shoe speed number was no more than 68.5 (that means the shoe speed m/s). In this case, the die was almost filled fully when the ratio number was over 0.007. The above law can be described and explained vividly in Figure 8. It can be seen that the influence of the air inside the cavity on filling was increasingly insignificant with the increase in particle size. In addition, fine particles induce larger air vortices, thereby enhancing drag effects on the particles. Cavities containing finer particles generate stronger air vortices, leading to a reduced filling capacity within equivalent time intervals, as shown in Figure 8.
3.2. The Shoe Speed Number
The curve is plotted in Figure 9, where the shoe speed number affecting the filling ratio is analyzed quantitatively.
It can be seen that with the increase in , the filling ratio δ decreased gradually. On the one hand, the effective time of die filling was reduced when the shoe speed number increased. On the other hand, the airflow, which hindered the particles from falling to some extent, could not escape before the shoe completely covered the die inlet due to the faster shoe speed. Therefore, the filling ratio decreased when the shoe moving speed increased.
In Figure 10, a similar phenomenon to that in Figure 9 is observed. A higher air velocity was found when the shoe speed was higher at the same displacement. Therefore, the filling ratio decreased.
3.3. The Solid Density Number
The curve is plotted in Figure 11, where the solid density number affecting the filling ratio is analyzed quantitatively. It can be seen that the filling ratio increased with the increase in solid density number . The reason is that the particle’s gravity, as well as the acceleration and velocity in the falling direction, all increased, which would cause the number of particles filled in the die to increase at the same time.
The curve describing the correlation between the volume flow rate and the solid density number is plotted in Figure 12. The volume flow rate of particles increased with the increase in solid density number, which verified the above explanation in Figure 11. A deeper analysis reveals that heavier particles are less sensitive to air, resulting in weaker hindering effects on heavier particles compared to lighter ones.
3.4. The Force Number
To explore the mechanism of linear die filling under the action of airflow inside the die, the forces on the particles were analyzed quantitatively, mainly including gravity and drag force. The force number was selected to explore the mechanism of die filling. The collisions among falling particles were neglected. Therefore, in the downward direction, that is, the negative direction of the Z axis, the force equation of particles obtained from Newton’s second law is as follows. Evidently, the acceleration determines the filling ratio and effects.
where and represent the single particle mass and the particle acceleration in the falling direction, respectively.
The curve showing the relationship between the filling ratio δ and force number is plotted in Figure 13. It can be seen that the filling ratio increased with the increase in force number . This can be explained by Equation (20). With the increase in , the acceleration of particles in the falling direction also rose, which made the filling effects grow. And then, the number of particles falling in the die increased at the same time, and naturally, the filling ratio δ rose.
The volume flow rate of particles filled in the die is also described with the force number in Figure 14. With the increase in force number , the volume flow rate rose apparently, which naturally explained the law in Figure 13. Therefore, only when the force number increases can the filling ratio increase.
The curve explaining the reason why a larger ratio number led to a larger filling ratio is plotted in Figure 15. As expected, with the ratio number increasing, the force number also increased, which was the essence of the filling ratio rising. Figure 16 shows the correlation between the force number and the solid density number . With the increase in solid density number , the force number increased considerably, which was the essence of the filling ratio rising affected by solid density. The main reason was that the gravity increased faster than the drag force, which caused a larger acceleration .
Therefore, the filling ratio increased with the increase in ratio number and solid density number . The fundamental reason lay in the relative proportion of the drag force to the gravitational force on the particles. The lower drag force relative to the gravitational force led to a larger filling ratio . Furthermore, with the increase in shoe speed, the filling ratio decreased due to the effective filling time shortening and the stronger drag force in Figure 9 and Figure 14.
3.5. Geometric Parameters
The macroscopic phenomenon of filling ratios among different geometric sizes of dies was difficult to distinguish. Therefore, quantitative analysis was conducted where the ratio of the opening size to the die depth was adopted to be variable, and the filling ratio was selected as an indicator. The curve showing the relationship between the ratio and filling ratio is plotted in Figure 17. It can be seen that increased with the increase in the ratio . A larger opening size of the die contributed to the air inside the die escaping. The deeper die prolonged the time required for the air to be discharged from the die, which may have prevented the air from escaping completely before the opening was covered by the shoe. The air trapped in the die can block particles falling into the die. Therefore, the larger value of made the air escape faster. Naturally, the filling ratio would be larger with the increase in the ratio .
3.6. Modeling of Linear Die Filling
From the above analysis, we can see that the filling ratio rises slowly or even remains stable at the 90% percentage. Combining Equation (19), the ratio number was selected as the indicator of die filling when the filling ratio was 90%, which was treated as a sign of full filling, and then the corresponding critical value was suggested. A curve taking the critical value as the dependent variable and the solid density number and shoe speed number as independent variables is plotted in Figure 18. It can be seen that the critical value linearly increased with the increase in shoe speed number and decreased with the increase in solid density number . In addition, the interaction between the shoe speed number and the solid density number was not obvious. Therefore, the semi-empirical modeling of the critical value was developed by the method of multiple linear fitting as follows:
The coefficient of determination of the model was greater than 0.95, and the verification of the model was conducted, as shown in Figure 19. It can be seen that the maximum error between the model and simulation results was no more than 3%. Therefore, the semi-empirical modeling of the critical value can be better used to predict and design the correlations among the particle properties, geometric parameters of the die, and the filling process.
In terms of particulate properties, lighter and finer particles exhibit heightened sensitivity to air flowing, resulting in compromised filling efficiency. From a process perspective, elevated shoe speeds impede sufficient air evacuation and shorten filling durations, collectively suppressing filling performance. Structurally, cavities with higher aspect ratios facilitate air escape, thereby enhancing filling efficacy. A semi-empirical model for complete filling was derived through dimensional analysis, offering practical guidance for achieving full compaction in powder-forming processes. However, this study focuses on regular mold geometries. For complex configurations, such as rhombic, stepped, or gear-shaped cavities, wall effects frequently lead to incomplete filling near boundaries. Developing robust methodologies to evaluate filling efficiency in such intricate molds remains a critical research frontier.
4. Conclusions
In this research, a critical value and a filling model were introduced to describe and predict the linear die filling results based on dimensional analysis derived from material properties, process parameters, and die geometrics. The details are as follows:
- (1)The coarse-grain DEM-CFD method was adopted, and the scale-up factor was verified. The static and dynamic repose angles in experiments and DEM simulations were used to determine the contact parameters. The scale-up factor was also determined by DEM simulations in die filling.
- (2)Based on dimensionless derivation and analysis, the ratio number of size , the solid density number , the shoe speed number , and force number were derived. The filling ratio increased with the increase in and and decreased with the increase in . The force number was found to be a key point determining the filling ratio. Due to the falling of the particles being hindered by the airflow, smaller proportions of drag forces relative to gravity result in larger filling ratios, which is the essence of filling.
- (3)A filling ratio of ninety percent was selected as a sign of full filling, and then, the corresponding critical value was obtained. A semi-empirical modeling of linear die filling, taking the critical value as the dependent variable and solid density number and shoe speed number as independent variables, was developed. Hence, this model can be used to design the smallest shoe speed to achieve complete die filling, optimize the parameters of die structures, and support process development.
The reference list from the paper itself. Each links out to its DOI / PubMed record.
- 1Van Snick B. Holman J. Cunningham C. Kumar A. Vercruysse J. De Beer T. Remon J.P. Vervaet C. Continuous direct compression as manufacturing platform for sustained release tablets Int. J. Pharm.201751939040710.1016/j.ijpharm.2017.01.01028069390 · doi ↗ · pubmed ↗
- 2Hildebrandt C. Gopireddy S.R. Fritsch A.K. Profitlich T. Scherliess R. Urbanetz N.A. Evaluation and prediction of powder flowability in pharmaceutical tableting Pharm. Dev. Technol.201924354710.1080/10837450.2017.141246229227171 · doi ↗ · pubmed ↗
- 3Wu C. Guo Y. Modelling of the flow of cohesive powders during pharmaceutical tabletting J. Pharm. Pharmacol.20106214501451 Available online: https://research.birmingham.ac.uk/en/publications/modelling-of-the-flow-of-cohesive-powders-during-pharmaceutical-t(accessed on 25 May 2025)
- 4Mills L.A. Sinka I.C. Effect of particle size and density on the die fill of powders Eur. J. Pharm. Biopharm.20138464265210.1016/j.ejpb.2013.01.01223403013 · doi ↗ · pubmed ↗
- 5Guo Y. Wu C.Y. Kafui K.D. Thornton C. Numerical analysis of density-induced segregation during die filling Powder Technol.201019711111910.1016/j.powtec.2009.09.003 · doi ↗
- 6Wu C. Dihoru L. Cocks A.C.F. The flow of powder into simple and stepped dies Powder Technol.2003134243910.1016/S 0032-5910(03)00130-X · doi ↗
- 7Nwose E.N. Pei C. Wu C.Y. Modelling die filling with charged particles using DEM/CFD Particuology 20121022923510.1016/j.partic.2011.11.010 · doi ↗
- 8Guo Y. Wu C.Y. Kafui K.D. Thornton C. 3D DEM/CFD analysis of size-induced segregation during die filling Powder Technol.201120617718810.1016/j.powtec.2010.05.029 · doi ↗