Volatile Profile of 16 Unifloral Pollen Taxa Collected by Honey Bees (Apis mellifera L.)
Vasilios Liolios, Chrysoula Tananaki, Dimitrios Kanelis, Maria Anna Rodopoulou, Fotini Papadopoulou

TL;DR
This study analyzed the volatile compounds in 16 types of unifloral bee pollen to understand how their aroma influences honey bee behavior and preferences.
Contribution
The study provides the first comparative analysis of volatile profiles in 16 unifloral pollen taxa and links specific compounds to bee visitation rates.
Findings
Pollen from Erica manipuliflora, Papaver rhoeas, and Sisymbrium irio had the highest number of volatile organic compounds.
Isothiocyanate compounds in Brassicaceae pollen may correlate with higher bee visitation rates.
4-methyl-5-nonanone was uniquely found in E. manipuliflora pollen, suggesting a role in bee attraction.
Abstract
The aroma of a flower is composed of a mixture of numerous volatile compounds. Various floral organs contribute to this aroma, including the anthers and the pollen they produce. Although it is often assumed that pollen scent influences honey bee preferences, research on insect attraction to bee pollen aromas is limited and has not extensively focused on unifloral pollen species. In this study, the volatile profiles of 16 unifloral bee pollen taxa with significant importance to beekeeping were analyzed, re-vealing differences in their volatile compound profiles. Certain volatile compounds, such as isothiocyanate compounds found in the pollen of the Brassicaceae family, may be associated with higher bee visitation rates. This suggests a potential explanation for honey bees’ behavior during pollen collection and their preference for specific pollen types. Bee pollen’s aroma combined with…
Genes, proteins, chemicals, diseases, species, mutations and cell lines named across the full text — each resolved to its canonical identifier and authoritative record.
Click any figure to enlarge with its caption.
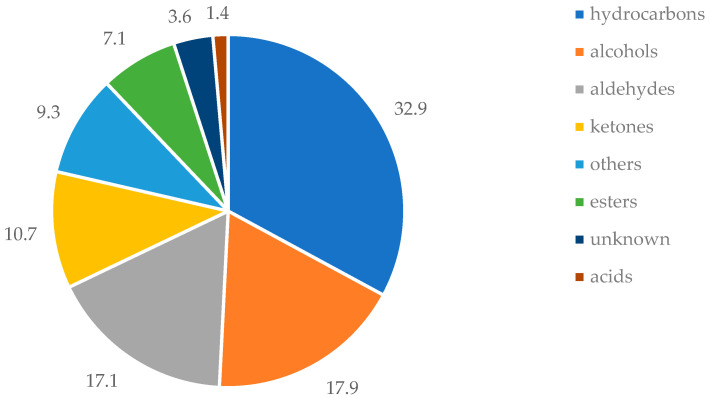 Figure 1
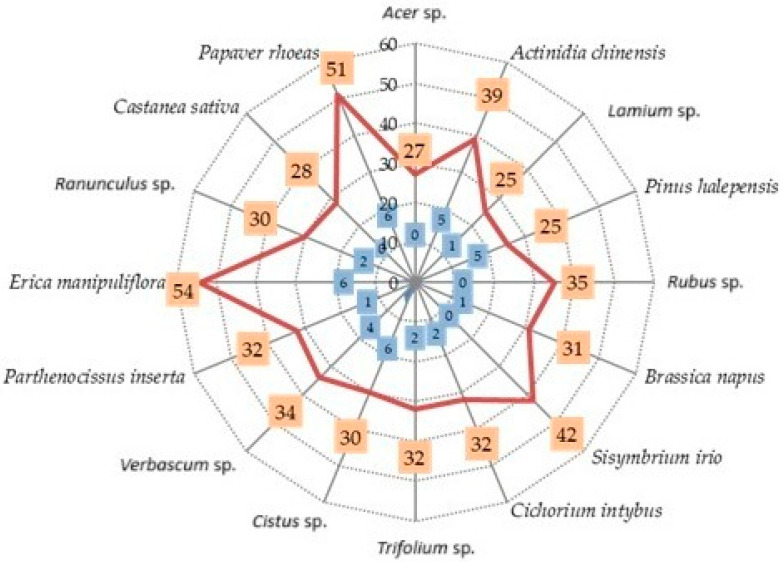 Figure 2
 Figure 3
 Figure 4
Peer Reviews
No public reviews on file for this paper yet. If you reviewed it on a platform where reviews are public (OpenReview, ICLR, NeurIPS, ICML), you can paste yours below so the community can read it here.
Videos
No videos yet. Explain this paper in a talk, walkthrough, or lecture? Add one.
Taxonomy
TopicsPlant and animal studies · Insect and Pesticide Research · Bee Products Chemical Analysis
1. Introduction
Plants synthesize and emit a large variety of biogenic volatile organic compounds (VOCs), thereby interacting dynamically with their immediate environment. These compounds include fatty acid derivatives, terpenoids, phenylpropanoids/benzenoids, and amino acid derivatives [1,2]. The emission of certain VOCs into the atmosphere can have profound biological effects on plant interactions with other organisms, as well as environmental consequences, by influencing the physicochemical properties of the atmosphere [3,4].
Floral volatiles are typically emitted from petals, although other floral or vegetative tissues may also contribute significantly to their production and release [5]. Indeed, Dudareva & Pichersky [6] reported the emission of VOCs from non-floral vegetative tissues as well. Nevertheless, some compounds are exclusively produced by floral organs, serving functions such as the attraction of mutualistic visitors or the deterrence of antagonists. In addition to petals, other floral components such as sepals, nectar, and pollen are also involved in the emission of scent mixtures [7,8,9,10]. In certain species, the androecium—the male reproductive structures of the flower, including stamens, anthers, and pollen grains—is hypothesized to produce distinctive volatile compounds involved in pollinator attraction [11].
The production of VOCs in plants serves a variety of ecological functions. Repellent chemicals—primarily terpenoids—constitute a fundamental defense mechanism that deters harmful organisms while mitigating adverse environmental conditions [12,13]. Benzenoids, however, are encountered with equal frequency [14] and, in some cases, in greater abundance than terpenoids [15]. It is also known that plants compete with one another for optimal growth conditions. According to Rasher et al. [16], the evolution of allelopathic compounds has been crucial in enabling plants to cope with the intense competition that arises under dense planting or crowding. Nonetheless, the most significant ecological role of VOCs is the attraction of suitable pollinators [2], especially considering that 85% of plant species rely on animal pollinators for successful reproduction [17]. Chittka & Raine [18] described the diversity of flowering plants as a “biological market,” from which pollinators select species that offer the greatest rewards. Thus, specific chemical compounds play a key role in facilitating botanical recognition by pollinators. This intricate plant–pollinator interaction is further supported by observations from Negre et al. [19], who reported a decline or alteration in floral VOC emission following successful pollination in some species. Such changes likely serve to reduce unnecessary visitation by floral visitors, especially those that could damage fertilized flowers, while promoting efficient foraging toward unpollinated flowers [20].
Regarding pollen, the characterization of its scent-related chemical components remains limited, mainly due to the methodological challenges in sampling and analyzing pollen volatiles [21]. Studies of VOCs in the pollen of angiosperms using headspace extraction techniques have confirmed the presence of distinctive olfactory profiles, chemically distinct from those of other floral parts [22,23]. Plants with pollen of a characteristic and intense odor confer an advantage by directly signaling the presence of rewards to potential pollinators, thereby enhancing the plant’s competitiveness within floral communities. Doull [24] was the first to demonstrate the ability of honey bees to distinguish between pollen odors of different plant taxa. Pollen scent appears to play an important role in pollinator attraction and tends to be more pronounced in entomophilous species [25], which rely predominantly on insect pollination. Knoll [26] was the first to investigate the origin of pollen scent, attributing it primarily to the outer lipid-rich layer (pollenkitt) of the pollen grains, which constitutes approximately 5% of their mass [25]. Additionally, Dobson et al. [27] suggested that some VOCs emitted from petals may be adsorbed onto pollen grains from the surrounding air.
However, the plant–pollinator relationship is bidirectional. Therefore, understanding the behavior and response of pollinators to pollen-derived volatile compounds is equally important. Several studies have confirmed that honey bees [25,28], beetles [29,30], and hoverflies [31] are attracted to odors during foraging. According to Lunau [32], bumblebees combine visual (e.g., anther color) and olfactory (e.g., pollen odor) cues to select flowers for visitation. Dobson et al. [28], in experiments with Rosa rugosa pollen, demonstrated that bumblebees are capable of distinguishing between flowers with different pollen quantities based on olfactory cues.
Honey bees collect pollen from a wide range of plant species, both cultivated and wild [33]. Although several studies suggest that the sensory characteristics of bee pollen vary significantly among plant species [34,35], available data on the volatile composition of pollen from individual plant species remain limited [36,37,38]. To date, most research has focused on the volatile profiles of mixed pollen samples [39,40,41,42,43,44].
Considering all the above, the aim of the present study was to comparatively assess the volatile profiles of unifloral pollen samples. The presence of characteristic volatile compounds in certain pollen types may be associated with their increased visitation by honey bees. Consequently, when evaluating the beekeeping value of a pollen-producing plant, its volatile profile should be considered alongside its chemical composition and nutritional value, due to its potential influence on pollen attractiveness.
2. Materials and Methods
2.1. Sample Collection, Separation, and Pollen Identification
A total of 16 unifloral pollen species were analyzed, which were collected from the experimental apiary of the Laboratory of Apiculture-Sericulture (A.U.TH.) using outdoor front pollen traps. The separation of pollen loads was carried out as promptly as possible after their collection from the pollen tray to minimize any potential contamination with volatile compounds. The separation process was primarily based on color, shape, and size. The separated samples were examined for purity and botanical origin using an optical microscope (Olympus, B X 40, Tokyo, Japan) with 400× magnification. Purity was assessed by calculating the percentage of the dominant pollen species present in 1 g of each sample. All samples exhibited purities greater than 95%, which exceeds the threshold recommended by Campos et al. [45] for confirming uniflorality (>80% of pollen grains from a single botanical species). Pollen analysis was performed using the method described by Louveaux et al. [46,47]. Specifically, the 16 unifloral pollen taxa whose volatile profile was studied were as follows: Acer sp. L. (Sapindaceae), Actinidia chinensis Planch. (Actinidaceae), Brassica napus L. (Brassicaceae), Castanea sativa Mill. (Fagaceae), Cichorium intybus L. (Asteraceae), Cistus sp. L. (Cistaceae), Erica manipuliflora Salisb. (Ericaceae), Lamium sp. L. (Lamiaceae), Parthenocissus inserta (A.Kern.) Fritsch (Vitaceae), Papaver rhoeas L. (Papaveraceae), Pinus halepensis Mill. (Pinaceae), Ranunculus sp. L. (Ranunculaceae), Rubus sp. L. (Rosaceae), Sisymbrium irio L. (Brassicaceae), Trifolium sp. Tourn. ex L. (Fabaceae), and Verbascum sp. L. (Scrophulariaceae).
2.2. Isolation and Identification of Volatile Organic Compounds
The process of isolating and identifying volatile organic compounds involves the following stages for each sample.
2.2.1. Sample Preparation
A 2 g sample of pollen was accurately weighed to ±0.001 g, diluted with 13 g of ultrapure water (Millipore Simplicity 185 system, Merck Millipore, Darmstadt, Germany), and the solution was transferred into a 25 mL glass vial of a Purge and Trap extraction system (OI Analytical, model 4560, New York, NY, USA). The extraction system was equipped with a heating capability for the sample and an automatic sampler. The mixture was subjected to mechanical stirring (vortex) for 30–60 s. To prevent foam formation, a 40 cm stainless steel (No. 316) spiral coil was used.
2.2.2. Sample Extraction
The sample was at first heated at a low temperature (40 °C) for 2 min without gas flow to reduce viscosity, facilitating the easier passage of helium (He) gas through the solution during extraction. Then, the volatile compounds were isolated by passing high-purity He (99.999%) gas at a flow rate of 40 mL/min through the glass vial for 40 min. The sample temperature was maintained at 40 °C throughout this process. During extraction, the volatile and semi-volatile components of the sample were trapped in a Tenax 07 column (Buchem B.V., Apeldoorn, The Netherlands). Following extraction, moisture was removed from the trap by heating to 100 °C for 2 min. The trapped compounds were released by heating the trap to 180 °C for 6 min. To prepare the trap for the next sample, it was heated for 7 min at 200 °C to ensure complete cleaning.
2.2.3. GC Analysis
After extraction, the compounds were transferred to the gas chromatograph (Agilent, model 6890, Agilent Technologies, Santa Clara, CA, USA) via a thermostatted (100 °C) transfer line. The sample was introduced into the column using a split-splitless injector at 220 °C. The separation of the components was achieved on a capillary HP-5MS column, CA, USA (30 × 0.25 mm, df = 0.25 μm), using the following temperature program: 40 °C (hold for 5 min), ramped at 10 °C/min to 55 °C, ramped at 30 °C/min to 120 °C, ramped at 100 °C/min to 230 °C, and ramped at 200 °C/min to 280 °C (hold for 5 min). The carrier gas flow (He) was set to 1 mL/min. Detection of the separated compounds was carried out using a mass spectrometer (Agilent, model 5973, Agilent Technologies, CA, USA), operating under the following conditions: interface temperature 280 °C, ionization source temperature 230 °C, quadrupole temperature 150 °C, and ionization voltage +70 eV. Chromatographic data were processed and analyzed using MSD ChemStation software (5973N, version G1701DA). Peak identification was performed by comparing the mass spectra to those stored in the NIST05 electronic library. Additionally, previously established identification tables (retention times and spectra) for volatile compounds were consulted [48]. The percentage participation was estimated by dividing the peak area of the isolated volatile compound by the sum of the peak areas of all compounds detected in the sample.
3. Results
A total of 140 VOCs were detected from the analysis of 16 unifloral pollen samples, of which 117 were successfully identified and 23 remained unknown. Peaks exhibiting low spectral match scores were not identified and are herein referred to as “unknown,” with their corresponding mass fragments described. Additionally, 12 compounds were identified at the isomeric level. The complete list of volatile compounds, ordered sequentially based on their retention time (RT), is presented in Table 1. Due to the complexity of certain compound names and the difficulty in referring to them throughout the text, a coding system was implemented. These codes are listed in the second column of Table 1. For VOCs of particular importance, the corresponding chemical names are also provided. In some cases, alongside the IUPAC name, commonly used trivial names are included—especially for constituents typically found in essential oils, where such names are more widely recognized. The mass spectral fragments for each VOC are reported in parentheses, with the base peak indicated by underlining.
Among the 140 VOCs identified across all samples, only seven were consistently detected in 100% of the analyzed unifloral pollen types. Of these, four were aldehydes—furfural (C28), heptanal (C49), nonanal (C111), and decanal (C126)—while the remaining three were hydrocarbons—toluene (C17), ethylbenzene (C34), and α-pinene (C52). Additionally, two VOCs were present in 94% of the samples, being absent in only one pollen type each. Specifically, octanal (C78) was not detected in Pinus sp., whereas 2-ethyl-1-hexanol (C85) was absent from Acer sp.
The pronounced presence of hydrocarbons, aldehydes, and alcohols is further illustrated in Figure 1, which presents the relative abundance of major chemical classes detected across the unifloral pollen samples.
Hydrocarbons represented the most prevalent class, comprising 32.9% of all identified VOCs. Alcohols and aldehydes followed with similar contributions, accounting for 17.9% and 17.1%, respectively. Ketones (10.7%), esters (7.1%), and carboxylic acids (1.4%) were detected at lower frequencies. A minor proportion of the compounds (3.6%) could not be structurally identified and were designated as unknowns. An additional 9.3% encompassed structurally diverse and infrequently occurring compounds—including heterocycles, sulfides, and isothiocyanates—which, due to their chemical heterogeneity and sporadic detection, were collectively classified under a miscellaneous group. Among the 16 unifloral pollen samples analyzed, those from E. manipuliflora, P. rhoeas, and S. irio exhibited the greatest chemical complexity, with 54, 51, and 42 VOCs detected, respectively. In contrast, the lowest VOC richness was observed in Pinus sp. and Lamium sp., each yielding only 25 identified VOCs, while the VOC profile of Acer sp. was notably limited, with just 27 compounds detected.
The total number of VOCs identified in each pollen sample (orange rectangles), alongside the number of VOCs found uniquely in each unifloral pollen taxa analyzed (blue rectangles), is given in Figure 2.
Beyond the total number of volatiles detected, the presence of species-specific VOCs may be associated with the attractiveness of individual pollen types. The highest number of such unique compounds was identified in the pollen of P. rhoeas, Cistus sp., and E. manipuliflora (six unique VOCs each), followed by A. chinensis and P. halepensis, each with five exclusive compounds.
A detailed overview of these species-specific volatiles, along with their percentage participation in each pollen type, is presented in Table 2.
The majority of the characteristic compounds were detected in relatively low concentrations, typically under 5%. However, certain volatile compounds were found to have significantly higher relative abundances in specific pollen types. These compounds were classified as “major” not due to their exclusive presence in a particular species, but rather because their percentage participation was notably higher compared to other compounds identified in the same pollen samples.
A detailed list of these major compounds, along with their respective concentrations, is provided in Table 3.
Characteristic examples include the presence of octane (C23) at 67.90% in C. sativa pollen, 29.31% in Lamium sp. pollen, and 26.79% in Acer sp. pollen, 6-methyl-5-hepten-2-one (C70) at 61.99% in Verbascum sp. pollen, 4-isothiocyanato-1-butyne (C71) at 58.45% in S. irio pollen, 4-ethyl-5-methylthiazole (C102) at 54.52% in B. napus pollen, hexanal (C24) at 47.16% in P. inserta pollen, 2-ethyl-1-hexanol (C85) at 39.96% in Cistus sp. pollen, β-pinene (C64) at 38.42% in Pinus sp. pollen, 6-methyl-5-hepten-2-one (C70) at 30.60% in A. chinensis pollen, 1-pentanol (C12) at 22.56% in E. manipuliflora pollen, nonanal (C111) at 19.31% in C. intybus pollen, 3-hexen-1-ol (C33) at 17.59% in Ranunculus sp. pollen, 1-hexanol (C40) at 15.77% in Trifolium sp. pollen, and 1,2-dimethylbenzene (C37) at 13.32% in Rubus sp. pollen.
In terms of chemical classes, the highest number of hydrocarbons (n = 25) was detected in E. manipuliflora and P. rhoeas pollen, while the lowest number was found in Cistus sp. pollen (n = 4) and Ranunculus sp. pollen (n = 6). Among the group of hydrocarbons, octane (C23) and o-xylene (C37) were detected at notably high levels in certain unifloral pollen types, such as C. sativa, Acer sp., Lamium sp., Rubus sp., and C. intybus. As previously mentioned, certain hydrocarbons were exclusively found in specific species, likely contributing to the attractiveness of their pollen.
The highest number of aldehydes was found in the pollen of A. chinensis (n = 11) and (Ranunculus sp.) (n = 11). Nonanal (C111) stood out both for its presence in all tested species and for the exceptionally high concentrations found in C. intybus pollen (19.31%), Acer sp. pollen (16.98%), Trifolium sp. pollen (13.84%), Cistus sp. pollen (11.43%), C. sativa pollen (10.4%), P. rhoeas pollen (8.82%), and A. chinensis pollen (8.36%). In contrast to the findings of Kaškoniene et al. [40], who report the presence of hexanal (C24) in 92.9% of mixed pollen samples, in the present study, it was detected in only 5 out of 16 unifloral pollen types, where it was the dominant volatile compound in P. inserta pollen, accounting for 47.16% of the total volatiles. The lowest number of aldehydes (n = 5) was found in P. halepensis pollen, and their total percentage did not exceed 3% of the total volatiles.
Among alcohols, 1-penten-3-ol (C4), 1-hexanol (C40), and 2-ethyl-1-hexanol (C85) were detected in the majority of samples. The highest number of alcohol-containing compounds was found in Ranunculus sp. pollen (n = 9), while the lowest was in Lamium sp. pollen (n = 2). Notably, 4-ethyl-5-methylthiazole (C102) was detected in exceptionally high concentrations in B. napus pollen (54.52%), 2-ethyl-1-hexanol (C85) in Cistus sp. pollen (39.96%), 1-pentanol (C12) in E. manipuliflora pollen (22.56%), 3-hexen-1-ol (C33) in Ranunculus sp. pollen (17.59%), and 1-hexanol (C40) in Trifolium sp. pollen (15.77%).
The highest number of esters was detected in P. rhoeas pollen (n = 5), followed by E. manipuliflora pollen (n = 4) and S. irio pollen (n = 4). In 50% of the tested pollen samples, no esters were detected. In E. manipuliflora, the ethyl ester of propanoic acid (C10) and the 2-methyl-ethyl ester of butanoic acid (C30) stood out, with concentrations of 3.83% and 4.53%, respectively. In P. rhoeas and S. irio, the percentage of esters was lower than 1%.
Among ketones, the highest number was detected in A. chinensis pollen (n = 5), Cistus sp. pollen (n = 5), and Verbascum sp. pollen (n = 5), while they were absent from Acer sp. and P. halepensis pollen. The percentage of 6-methyl-5-hepten-2-one (C70) exceeded 8% in Rubus sp. and Trifolium sp. pollen and was the dominant compound in A. chinensis pollen (30.6%) and Verbascum sp. pollen (61.99%).
Finally, from the acid chemical class, only two VOCs (C80, C125) were detected, both in Cistus sp. pollen. Among heterocyclic compounds, 2-ethylfuran (C7) stood out for its high percentage in Lamium sp. pollen (18.91%), Rubus sp. pollen (8.13%), and Trifolium sp. pollen (8.35%). Lastly, in the other VOC chemical class, the presence of 4-isothiocyanato-1-butyne (C71) was particularly notable in the Brassicaceae family species.
4. Discussion
Bee pollen contains a wide array of VOCs, among which hydrocarbons, aldehydes, ketones, and esters are predominant [22,25,42,44,49,50,51]. In the present study, hydrocarbons represented the most abundant chemical group, accounting for 32.9% of the total volatile profile, followed by alcohols (17.9%), aldehydes (17.1%), and ketones (10.7%). The predominance of hydrocarbons at levels exceeding 25% of total volatile compounds has also been reported by Dobson and Bergström [25], who analyzed unifloral pollen samples from species of the Asteraceae family. Similarly, a hydrocarbon content greater than 25% has been documented in the pollen of P. rhoeas [22] and Lycopersicon esculentum [25]. In contrast, Flamini et al. [23], studying the volatile characteristics of Citrus limon pollen from Italy, highlighted terpenes as the dominant constituents. Regarding alcohols, their relative abundance has been reported to range from 10% to 25% in species such as Sonchus arvensis, Lonicera caprifolium [25], Ranunculus acris [36], and several members of the Rosaceae family [11,22,27]. Aldehydes typically represent less than 10% of the total volatiles [22,25], with the exception of certain Rosaceae species, which exhibit a higher aldehyde content in their pollen [11,27]. Conversely, Karabagias et al. [42] reported that aldehydes were the dominant volatiles in mixed bee pollen samples from Northwestern Greece. Moreover, Csóka et al. [38], analyzing the volatile profiles of 14 unifloral pollen samples, observed notable proportions of alcohols (6.21–15.10%), aldehydes (0.83–25.30%), and ketones (0.26–22.72%).
The botanical origin appears to play a decisive role in shaping the volatile profile of pollen. Indeed, both quantitative and qualitative differences in total VOCs were observed among the different unifloral pollen samples analyzed. Among the 16 unifloral samples examined, E. manipuliflora, P. rhoeas, and S. irio stood out due to the high number of VOCs detected—54, 51, and 42 compounds, respectively. The notably rich volatile profile of E. manipuliflora may be linked to the particular foraging preference honey bees exhibit for its pollen, despite its relatively low crude protein (16.26% D.M. [Dry Matter]) and total lipid (0.4% D.M.) content [52,53]. It is also worth noting that the flowering period of E. manipuliflora coincides with autumn, a time when pollen sources are scarce and protein availability is limited for pollinators [52]. As for S. irio and P. rhoeas, these wild species are abundant in the study region, and their pollen is collected in large quantities by honey bees during spring [33,47,52]. Moreover, the strong foraging preference of honey bees for Brassicaceae species has been reported by other researchers as well [54,55]. Csóka et al. [38] highlighted the high number of aroma-active zones in the pollen of B. napus, P. rhoeas, and Rubus fruticosus, with P. rhoeas showing the most diverse VOC profile among the 14 unifloral samples examined. In contrast to the present findings, Dobson et al. [22] reported a smaller number of VOCs in P. rhoeas pollen, detecting only 33 compounds, while Bergström et al. [36] identified just 5 VOCs in the unifloral pollen of Ranunculus acris. In the current study, the lowest number of VOCs was detected in Pinus sp. (pine) and Lamium sp. pollen, with only 25 compounds identified. Von Aufsess [56], comparing volatile profiles of anemophilous and entomophilous species—mainly Poaceae—highlighted the lack of pronounced odor in the pollen of wind-pollinated species and the compositional differences in their VOC profiles. This trend is confirmed by Dobson & Bergström [25], who studied four anemophilous species (Pinus sylvestris, Betula verrucosa, Quercus robur, and Dactylis glomerata), all of which showed reduced VOC diversity.
Among the exclusive organic compounds detected in the pollen of the examined plant species, the highest number of unique compounds was identified in P. rhoeas (n = 6), Cistus sp. (n = 6), and E. manipuliflora (n = 6), followed by A. chinensis (n = 5) and P. halepensis (n = 5). Although most of these characteristic compounds were present in relatively low percentages (Table 2), a more in-depth investigation into some of these unique metabolites appears to be of particular interest. Notably, 4–methyl–5–nonanone (C113), found exclusively in the pollen of E. manipuliflora at a concentration of 6.11%, has been reported as a beetle-attractant pheromone with practical applications in insect trapping [57,58]. Therefore, the presence of such an attractant compound in Erica pollen may partially explain the notable preference exhibited by honey bees toward this species. Similarly, the occurrence of geraniol (C128) in P. rhoeas pollen (4.04%) could be associated with its attractiveness. Hohmann [59] demonstrated that the addition of various aromatic compounds, including geraniol, to cellulose powder significantly increased its uptake by honey bees. Furthermore, one of the best-known orientation pheromones in honey bees—produced by the Nasonov gland and functioning as an attractant for worker honey bees—is composed of a mixture of compounds that includes geraniol [60,61,62,63]. Among the unique compounds detected in the pollen of Cistus sp., caprylic acid (C125) was found in the highest concentration. Saa-Otero et al. [64], in their study of fatty acid composition in eight unifloral pollen types, reported the presence of caprylic acid in trace amounts in other pollen taxa such as C. sativa, Erica, Eucalyptus, Rubus, Quercus robur, and Halimium alyssoides. In A. chinensis, geranial (C97) and neral (C93)—the two stereoisomers that comprise citral—were detected in small amounts. Citral is another attractant pheromone also found in the Nasonov gland secretion [60,61,62,63]. However, Blum [65], studying the reaction of Trigona subterranea worker bees to high concentrations of citral, reported aggressive behavior and in some cases nest abandonment for the duration of exposure, indicating a potential concentration-dependent behavioral response. In P. halepensis, the exclusive compounds β-myrcene (C74) and δ-3-carene (C77) were particularly abundant, detected at 14.03% and 10.47%, respectively. These two terpenes are known constituents of several essential oils with documented antifungal properties [66,67,68,69]. Llusià & Peñuelas [70] linked terpene emission in pine seedlings to environmental conditions, particularly temperature and humidity. The high concentrations of these terpenes in P. halepensis are consistent with findings by Blanch et al. [71], who reported elevated levels of β-myrcene, δ-3-carene, and α- and β-pinene in the foliage of this species.
The exclusive occurrence of isothiocyanate compounds (C39, C44, C71) in species belonging to the Brassicaceae family is worth further discussion. However, due to their detection in the pollen of both S. irio and B. napus, they were not included among the species-specific compounds in Table 2. Isothiocyanates and thiocyanates are degradation products of glucosinolates following their hydrolysis by the enzyme myrosinase [72,73]. These compounds are largely responsible for the characteristic odors of cruciferous plants, which have been shown to act either as attractants [74] or repellents [75] for certain pollinators. The strong presence of isothiocyanates in Brassicaceae species has also been reported by other researchers [38,74,76]. Additionally, Tollsten & Bergström [77] noted the emission of isothiocyanates in crucifers upon the mechanical injury of their tissues. Regarding the pollinators’ response to these compounds, it has been demonstrated that certain insects, including bees, are capable of detecting thiocyanates through their antennae [78,79].
5. Conclusions
Among the analyzed unifloral pollen species, both quantitative and qualitative differences and similarities in their volatile compound profiles were observed. Notably, the pollen of E. manipuliflora, P. rhoeas, and S. irio exhibited a significantly higher number of VOCs compared to other species. A total of 54 VOCs were identified in E. manipuliflora, 51 in P. rhoeas, and 42 in S. irio. The presence of specific VOCs in certain pollen species may be associated with their increased attractiveness to honey bees. For instance, 4-methyl-5-enal was detected exclusively in E. manipuliflora pollen, while isothiocyanate compounds were uniquely found in species of the Brassicaceae family. Thus, when assessing the apicultural value of a pollen-producing plant, it is crucial to consider not only its basic chemical composition and nutritional value but also its volatile compound profile, as these compounds significantly influence the plant’s attractiveness to honey bees and its pollen collection efficiency. Moreover, the characteristic volatile compounds identified in the 16 examined taxa could potentially serve as reliable indicators for determining botanical origin, pending further studies on other unifloral pollen species to confirm the uniqueness of their presence in specific pollinating plants.
The reference list from the paper itself. Each links out to its DOI / PubMed record.
- 1Dudareva N. Pichersky E. Gershenzon J. Biochemistry of plant volatiles Plant Physiol.20041351893190210.1104/pp.104.04998115326281 PMC 520761 · doi ↗ · pubmed ↗
- 2Dudareva N. Negre F. Nagegowda D.A. Orlova I. Plant volatiles: Recent advances and future perspectives Crit. Rev. Plant Sci.20062541744010.1080/07352680600899973 · doi ↗
- 3Peñuelas J. LlusiàJ. BVO Cs: Plant defense against climate warming?Trends Plant Sci.2003810510910.1016/S 1360-1385(03)00008-612663219 · doi ↗ · pubmed ↗
- 4Peñuelas J. Staudt M. BVO Cs and global change Trends Plant Sci.20101513314410.1016/j.tplants.2009.12.00520097116 · doi ↗ · pubmed ↗
- 5Dobson H.E.M. Floral Volatiles in Insect Biology Insect–Plant Interactions Bernays E.A. CRC Press Boca Raton, FL, USA 1994 Volume V 4781
- 6Dudareva N. Pichersky E. Biochemical and molecular genetic aspects of floral scents Plant Physiol.200012262763410.1104/pp.122.3.62710712525 PMC 1539243 · doi ↗ · pubmed ↗
- 7Dötterl S. Jürgens A. Spatial fragrance patterns in flowers of Silene latifolia: Lilac compounds as olfactory nectar guides?Plant Syst. Evol.20052559919910.1007/s 00606-005-0344-2 · doi ↗
- 8Mena A. Egea F.J. Guerra J.M. Martínez J.L. Analysis of biogenic volatile organic compounds in Zucchini flowers: Identification of scent sources J. Chem. Ecol.2005312309232210.1007/s 10886-005-7103-216195845 · doi ↗ · pubmed ↗