Cretaceous Connections Among Camel Cricket Lineages in the Himalaya Revealed Through Fossil-Calibrated Mitogenomic Phylogenetics
Cheten Dorji, Mary Morgan-Richards, Steven A. Trewick

TL;DR
This study uses DNA and fossils to show that camel crickets in the Himalaya evolved long before continents drifted apart, challenging old theories about their spread.
Contribution
The paper provides new mitogenomic data and fossil-calibrated phylogenetics to challenge continental drift as the driver of camel cricket distribution.
Findings
The common ancestor of camel crickets lived in the Early Jurassic, before Pangea broke apart.
The most recent common ancestor of two subfamilies lived 137 million years ago, before the Bering Land Bridge existed.
Continental drift is not a major factor in the current distribution of camel crickets.
Abstract
The flightless camel crickets are one of the oldest living lineages of Orthoptera, believed to have originated around 250 million years ago. In this paper we infer the timing of their radiation using DNA sequences from whole mitochondrial genomes of 20 camel crickets, with a focus on the neglected Rhaphidophorinae and Aemodogryllinae groups. To determine whether the taxonomic groups share a single common ancestor, we combined new DNA sequences from camel crickets from Bhutan with published genetic data. Our phylogenetic tree supports the monophyly of most of the genera sampled but supports the reinstatement of Gymnaeta Adelung, which forms a lineage sister to the group comprising Diestrammena, Tachycines, Gymnaetoides, Homotachycines, and Pseudotachycines. Based on our fossil-calibrated molecular clock phylogeny, the common ancestor of camel crickets was estimated to have lived in the…
Genes, proteins, chemicals, diseases, species, mutations and cell lines named across the full text — each resolved to its canonical identifier and authoritative record.
Click any figure to enlarge with its caption.
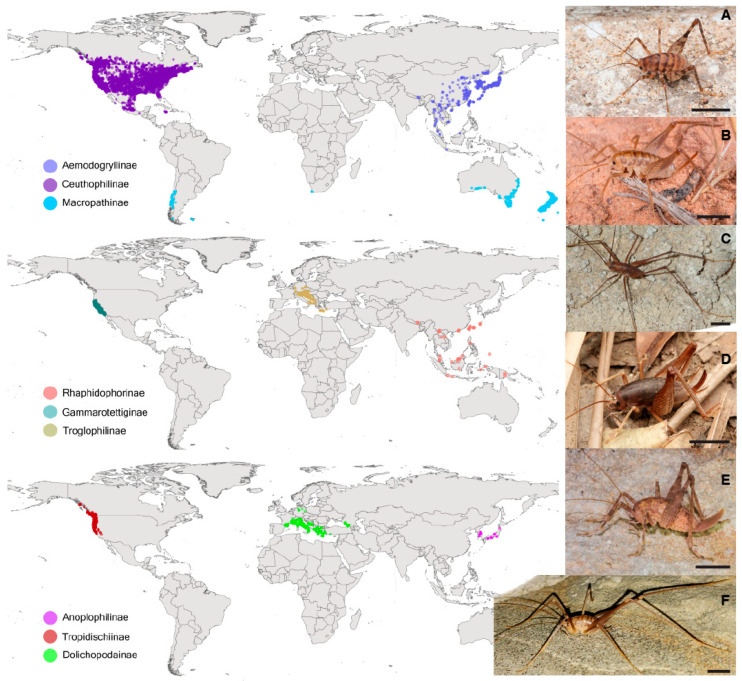 Figure 1
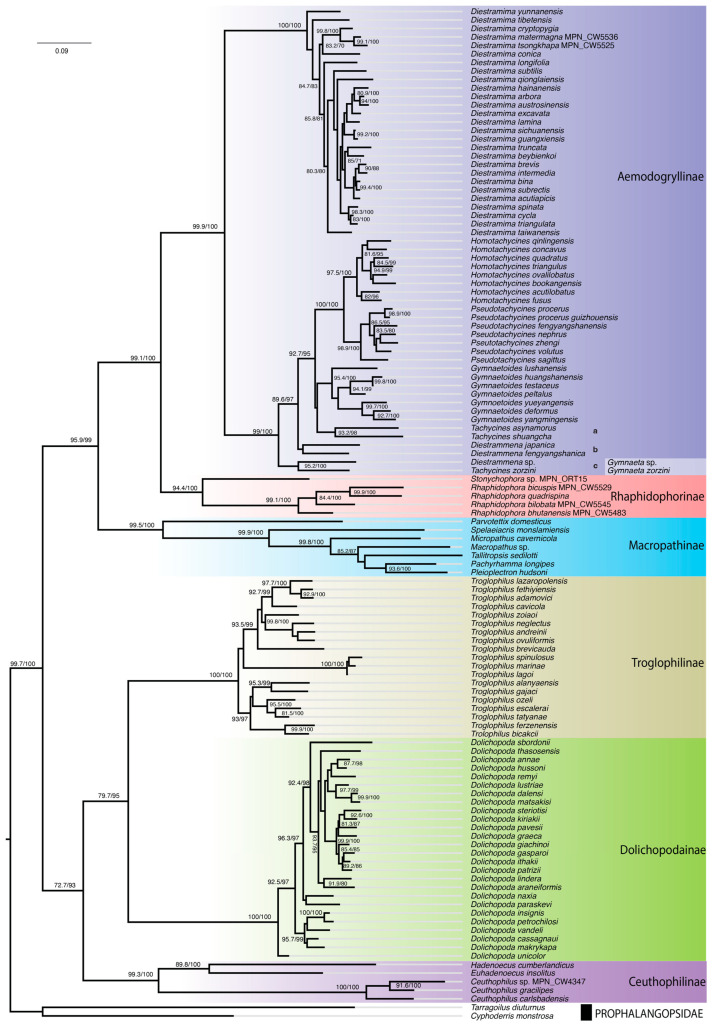 Figure 2
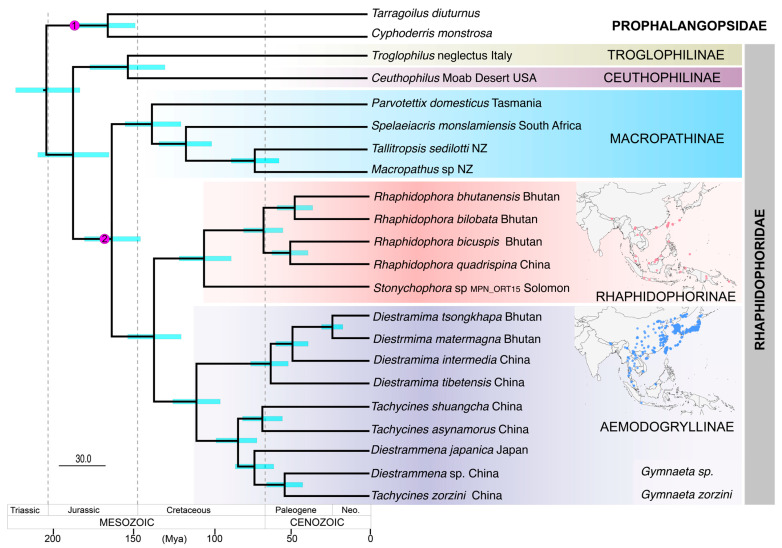 Figure 3
| Family | Subfamily | Taxa | Country | Specimen Code | Accession No. | Author |
|---|---|---|---|---|---|---|
| Rhaphidophoridae | Aemodogryllinae |
| Pema Gatshel, Bhutan | MPN_CW5536 |
|
|
|
| Trongsa, Bhutan | MPN_CW5525 |
|
| ||
| China | [ | |||||
|
| China | [ | ||||
| China | [ | |||||
|
| Japan | [ | ||||
| China | [ | |||||
|
| China | [ | ||||
|
| China | [ | ||||
| Ceuthophilinae | Moab Desert, USA | MPN_CW4347 |
|
| ||
| Rhaphidophorinae | Vangunu, Solomon Is. | MPN_ORT15 |
|
| ||
|
| China | [ | ||||
|
| Thimphu, Bhutan | MPN_CW5529 |
|
| ||
|
| Pema Gatshel, Bhutan | MPN_CW5483 |
|
| ||
|
| Trongsa, Bhutan | MPN_CW5545 |
|
| ||
| Troglophilinae |
| Brje pri Kombu, Slovenia | [ | |||
| Macropathinae | Waitomo, NZ | MPN_CW109 | [ | |||
|
| Hawkes Bay, NZ | MPN_CW1830 | [ | |||
|
| Taronga, Tasmania | MPN_CW736 | [ | |||
|
| Hex River, South Africa | MPN_CW3801 | [ | |||
| Prophalangopsidae | Cyphoderrinae |
| [ | |||
| Prophalangopsinae |
| [ |
|
|
|
|
|
|
|
|
|
|
|
|
|
|
|
| 1 | LN/N | 10 | 411 | 327 | 368 | 188.7 | 166.6; 210.7 | 153.4 | 131; 178.7 | 137.6 | 121.5; 154.9 | Hard min = 157; mean =172; | 2.5% min = 140; mean = 160; |
| 2 | N/N | 10 | 1109 | 846 | 1819 | 188.8 | 165.7; 211.3 | 153.6 | 129.8; 178 | 138.1 | 120.7; 154.9 | 2.5% min = 152; mean = 172; | 2.5% min = 140; mean = 160; |
| 3 | E/E | 10 | 1019 | 775 | 1234 | 188.7 | 159.2; 226.8 | 153.7 | 124.7; 189.7 | 137.6 | 115.2; 166.1 | Hard min = 157; mean = 172; | Hard min = 140; mean = 160; |
| 4 | LN/E | 10 | 945 | 675 | 1173 | 188.6 | 156.4; 227.2 | 153.6 | 126.1; 189.7 | 135.3 | 113.2; 170.6 | Hard min = 157; mean = 172; | Hard min = 140; mean = 160; |
| 5 | N/N | 100 | 10278 | 7661 | 20,075 | 188.7 | 166.7; 211.9 | 153.6 | 130; 178.5 | 138.1 | 121.1;155 | 2.5% min = 152; mean = 172; | 2.5% min = 140; mean = 160 |
|
|
|
|
|
|
|
|
|
|
|
|
|
|
|
| 1 | N | 10 | 707 | 663 | 1245 | 109.5 | 98.0; 122.4 | 69.9 | 65.8; 73.6 | 88.5 | 77.6; 100.8 | 2.5% min = 48.9; mean = 68.5; | 2.5% min = 105; mean = 117; |
| 2 | E | 10 | 635 | 511.1 | 1266 | 113 | 105.3; 127.7 | 85.4 | 69.8; 102.2 | 90.4 | 81.4; 103.8 | Hard min = 56; mean = 68.5; | Hard min = 105; mean = 117; |
| 3 | U | 10 | 776 | 626.9 | 1388.3 | 121 | 106.6; 136.5 | 94.5 | 76.2; 115.9 | 95.5 | 84.1; 108.5 | Bounds: min = 46; mean = 72.5; | Bounds: min = 105; mean = 118; |
| 4 | N | 100 | 8860 | 8032 | 10,664 | 109.8 | 97.7; 122.1 | 69.8 | 66; 73.6 | 88.3 | 77.1; 100.4 | 2.5% min = 48.9; mean = 68.5; | 2.5% min = 105; mean = 117; |
- —Royal Government of Bhutan and the Royal University of Bhutan
- —Phoenix Research Group, Palmerston North, Massey University
Peer Reviews
No public reviews on file for this paper yet. If you reviewed it on a platform where reviews are public (OpenReview, ICLR, NeurIPS, ICML), you can paste yours below so the community can read it here.
Videos
No videos yet. Explain this paper in a talk, walkthrough, or lecture? Add one.
Taxonomy
TopicsOrthoptera Research and Taxonomy · Fossil Insects in Amber · Scarabaeidae Beetle Taxonomy and Biogeography
1. Introduction
The Rhaphidophoridae, commonly known by the names camel crickets, cave crickets, and cave wētā, are among the least-studied groups within the Orthoptera [1]. The family is diverse, encompassing 912 extant described species and 93 genera [2] distributed around the world. Although all species of Rhaphidophoridae are flightless, there are numerous examples living on geologically young oceanic islands [3,4,5] resulting from colonization, which demonstrates their excellent dispersal potential [6]. They are characterized by an arched profile; long antennae; and usually long legs, an absence of wings and tympanum, and limited pigmentation (Figure 1). They are nocturnal and associated with humid environments in temperate and tropical wet forests and sometimes in caves.
The Rhaphidophoridae are classified into nine extant and one extinct subfamily, each restricted to a distinct geographic region (Figure 1): the Troglophilinae and Dolichopodainae are found in Mediterranean Europe; the Rhaphidophorinae, Aemodogryllinae, and Anoplophilinae in Asia, with the latter being limited to the Korean Peninsula and Japan; the Macropathinae in the Southern Hemisphere; and the Ceuthophilinae, Gammarotettiginae, and Tropidischiinae exclusively in North America. Although representation in molecular phylogenetic analyses is sometimes sparse, the monophyly of seven subfamilies is concordant with their distinct geographical distributions [3,7]. The geographic partitioning of relatively deep lineages implies long regional persistence in separate regions, but this pattern does not necessarily reveal paleogeographic processes due to the unknown influence of extinction [8].
The Rhaphidophoridae are regarded as a sister to the majority of ensiferan diversity and are thought to have originated between the Carboniferous and Late Jurassic periods [9,10,11]. Vicariant explanations of the global distribution of the Rhaphidophoridae rather than long-distance dispersal have historically been favored, primarily due to the absence of wings in all species [12,13,14], and phylogenetic trees are broadly consistent with this [3,7,15,16,17,18]. While Northern Hemisphere subfamilies are each associated with one part of a continent, the Macropathinae are distributed across multiple continents, including South Africa, South America, Australia, New Zealand, and several subantarctic islands. Data-rich phylogenetic analyses of this subfamily show that rhaphidophorids have successfully dispersed long-distances across inhospitable habitats [6], and it is widely recognized that dispersal is the only plausible explanation for the current spatial arrangement of many endemic species on young oceanic islands [19,20,21,22]. Sister to the Macropathinae are the Northern Hemisphere subfamilies the Aemodogryllinae and Rhaphidophorinae, which have their nexus in Southeast Asia, a geologically complex region of continent and islands. How did these distinctive lineages come to occupy the same region? One suggestion is that their common ancestor colonized East Asia in the later Cretaceous via the Bering Land Bridge [7].
The timing of lineage origins and the relevance of landscape processes in the evolution of the Orthoptera and other insects often relies on the application of paleogeographic events for phylogenetic dating [3,23,24], but this is problematic since it is founded on an assumption of the very question to be decided [25]; it assumes a role of landscape changes in lineage formation, which results in logical circularity [19,26,27]. However, the scarcity of relevant verified fossils inhibits the use of this alternative to calibration [28].
The earliest fossils assigned to the Rhaphidophoridae are from Oligocene Baltic amber [29]. Protroglophilus and Prorhaphidophora [29,30] represent lineages of uncertain affinity and are not definitively stem lineages of the family or extant subfamilies and are therefore unsuitable for molecular phylogeny that seeks to estimate the divergence of the major phylogenetic linages. Uncertainty in the systematic placement of other extinct taxa in the Tettigoniidea, such as Aenigmaraphidophora mouniri [31], prevents their use. Consequently, previous molecular phylogenetic studies on the Rhaphidophoridae used inferred paleogeographic events to calibrate the most recent common ancestor of the group [3,15,32]. To overcome the limited availability of fossils, ‘secondary fossil’ calibration relies on fossil-constrained calibration of a different taxon set that overlaps the group of interest, with node dates being transferred for molecular clock analysis of the focal group [7,16].
Camel crickets from the Asian continent form a major part of the global Rhaphidophoridae diversity, yet their phylogenetic relationships have been neglected. For Tachycines and Diestrammena within the subfamily Aemodogryllinae, classification of species is challenging due to the large number of species, their high degree of morphological similarity, and the lack of diagnostic characters. The genus Tachycines was established with T. asynamorus by separation from Diestrammena based on a difference in the number of spines on the hind tibia [33]. Furukawa, in 1933, did not accept the evidence for the division of Diestrammena and Tachycines proposed by Adelung and preferred D. (Tachycines) [34]. Karny (1934) merged Diestrammena with Gymnaeta Adelung as subgenera of Tachycines; hence Tachycines (Diestrammena) and T. (Gymnaeta) [13]. Gorochov and Storozhenko (1992) transferred the subgenus Gymnaeta from the genus Tachycines to Diestrammena [35]. Six years later, Gorochov (1998), using male genitalia, proposed four subgenera of Diestrammena: D. (Diestrammena), D. (Aemodogryllus), D. (Tachycines), and D. (Gymnaeta) [36]. Despite the complicated and convoluted taxonomic history of these cricket species, their systematics has not been examined using molecular phylogenetics.
We sampled taxa representing five subfamilies to determine the evolutionary relationships of the Rhaphidophoridae, including systematic analysis of neglected Asian subfamilies, the Aemodogryllinae and Rhaphidophorinae. We constructed phylogenetic hypotheses from mitogenomic data and inferred the timing of the diversification of major lineages using fossil-calibrated molecular clock analysis to shed light on the biogeographic history of the family. Explicitly we examined the proposal that the most recent common ancestor of the Aemodogryllinae and Rhaphidophorinae existed in the Late Cretaceous, facilitating dispersal to North America and East Asia from Beringia [7].
2. Materials and Methods
2.1. Taxon Sampling
In this study, we considered species representing six subfamilies of the Rhaphidophoridae from three major Northern Hemisphere geographical regions (North America, Europe, and Asia) and the Southern Hemisphere. Two datasets were generated. The larger taxon dataset (n = 117 species) was compiled to test the current generic classification system within the Aemodogryllinae and Rhaphidophorinae by incorporating data from as many species representatives as possible. We supplemented data available from previous phylogenetic studies of the Rhaphidophoridae (Aemodogryllinae and Rhaphidophorinae) from Asia (e.g., [16,37]) with sampling from Bhutan, Oceania, and North America. Samples from Bhutan were collected during April 2022 under the authorization of research permit number 7008186946225A7A8C6D0B granted by the Ugyen Wangchuck Institute for Forestry Research and Training (UWIFoRT), Bhutan. Subsequent transfer to Massey University was conducted in accordance with a Material Transfer Agreement, reference number NBC/BRD/7/2022-2023/197. All samples were deposited in the Phoenix collection at Massey University, Palmerston North (MPN). We used DNA sequences (12S, 16S, COI, 28S, and 18S) from GenBank and the Barcode of Life Data System (BOLD) in conjunction with additional genetic data extracted from skim sequencing (Supplementary Table S1). This dataset will be referred to as the 117-taxa set.
For molecular clock analyses we compiled a dataset using the 13 protein-coding genes extracted from whole mitochondrial assemblies of 20 Rhaphidophoridae and 2 outgroup taxa (Table 1). This included representatives of diversity in Southern Hemisphere Macropathinae that constitute a sister to the clade that includes the Aemodogryllinae and Rhaphidophorinae in Asia and near Oceania. We generated new mitogenomic data for species in the subfamilies Rhaphidophorinae and Aemodogryllinae from Bhutan and the Solomon Islands and Ceuthophilinae from the United States of America. The Rhaphidophorinae and Aemodogryllinae were identified based on the descriptions provided in [35,38,39,40,41]. The Rhaphidophorinae specimen from Vangunu Island, Solomon Islands, was identified as belonging to the genus Stonychophora Karny upon comparing descriptions and high-resolution images of the type specimen Stonychophora salomonensis Willemse described from Aola, Solomon Islands [13,42]. We identified the specimen belonging to the Ceuthophilinae as a member of the genus Ceuthophilus Scudder [43].
2.2. DNA Sequencing
We assembled entire mitochondrial genomes from DNA extractions without the need for PCR using skim sequencing techniques. For this, we carried out extraction of DNA from leg muscle using a salting-out protocol [22,44]. Genomic DNA samples were paired-end-sequenced through massive parallel, high-throughput sequencing on an Illumina HiSeq 2500 by Macrogen (Seoul, Republic of Korea) following fragmentation and indexing using the Illumina (San Diego, CA, USA) TruSeq Nano DNA kit. The resulting DNA reads with a mean fragment size of 150 base pairs (bp) were sorted and iteratively assembled in Geneious Prime v2022.2.2 [45]. Initial mapping reads from each sample used published annotated mtDNA genome data from GenBank under strict sensitivity settings to allow mapping with minimal gaps and ambiguity, generating novel consensus sequences [46,47]. Partial assemblies were remapped to close gaps and the resulting draft assembly remap with raw sequence reads until all the alignment gaps were filled by extension with the new sequence data and ambiguities were resolved. Consensus sequences were checked for ambiguity and reading-frame anomalies and annotated by comparison with published examples, with submission to the MITOS server [48]. Reading frames, amino acid translation, and secondary structures were examined for protein-coding, ribosomal RNA (rRNA), and transfer RNA (tRNA) genes, respectively. Each of the 13 protein-coding genes were extracted and aligned separately using ClustalW aligner (default settings) before they were concatenated to give a final dataset 11,124 nucleotides in length.
2.3. Phylogenetic Analysis
For analysis of the 117-taxa set, we concatenated partial DNA sequences of three mitochondrial genes (12S, 16S, and COI) and two nuclear ribosomal genes (28S and 18S) to provide a total alignment length of 3314 bp. For phylogenetic inferences the data were partitioned based on gene type (ribosomal or protein-coding) and on codon position (for COI), creating seven partitions.
Phylogenetic reconstruction of five subfamilies within the Rhaphidophoridae used data from whole mitochondrial genomes. For these we extracted and concatenated the protein-coding genes and excluded the tRNA and rRNA genes based on the findings from previous studies on Orthoptera that found that the use of only protein-coding genes resulted in the most stable analyses and that inclusion of RNAs did not improve tree topology [46,57,58]. We explored the influence on topology and node support of different partition models using the Maximum Likelihood (ML) method on both nucleotides and amino acid sequence alignments. The final dataset for 20 taxa consisted of concatenated data for 13 protein-coding genes, and removing stop codons from each gene and trimming to equal alignment lengths yielded 13 partitions based on genes and 52 partitions based on genes plus codon positions.
For both datasets, we used Partition Finder 2 [59] implemented in IQ-TREE 2 v2.2.0 [60] to identify the optimal partition scheme and the most suitable models of DNA evolution under the Bayesian information criterion (Supplementary Table S2). The best partitioning schemes were used for reconstructions of phylogenetic relationships within the family. The ML analysis was performed in IQ-TREE 2 considering invariable sites, Gamma rate heterogeneity, and resampling strategy [61]. Ultrafast Bootstrap [62] and Sh-aLRT support values [63] were calculated with 1000 replicates.
2.4. Divergence Time Estimate Analysis
We inferred the timing of lineage splitting among the rhaphidophorid subfamilies using BEAST2 v2.7.4 [64]. Since the only fossil record of Rhaphidophoridae is uninformative for dating the earliest splits, recent studies have relied on estimates of time of divergence using secondary fossil calibration points from a phylogenomic study of Orthoptera (e.g., [7,16]). The reliability of node ages of subfamily linages within the Rhaphidophoridae is uncertain due to under-representation of taxa (only 3 Rhaphidophoridae included in [65]), which may result in significant skewing in molecular clock inferences. We also used a secondary fossil calibration but in conjunction with a fossil calibration constraining the sister lineage of Rhaphidophoridae. We calibrated our phylogeny using the fossils of Prophalangopsidae, which are considered to be close relatives of the rhaphidophorid family [1,65]. Positioning a calibration within the target group of analysis is essential for good molecular clock inference; therefore, we positioned a secondary fossil calibration to constrain the node age of the common ancestor of Macropathinae and (Aemodogryllinae + Rhaphidophorinae). Our secondary fossil calibration within the Rhaphidophoridae is based on an analysis that included the same Prophalangopsidae fossil calibration but with much wider outgroup sampling (nine taxa representing Anostostomatidae, Stenopelmatidae, and Tettigoniidae) and included a well-dated geological constraint within their ingroup using endemic Talitropsis species of the Chatham Islands [6]. We constructed our phylogeny using mitochondrial genomes. We examined the effects on divergence times, model convergence, and Effective Sampling Size (ESS) scores of applying different distribution priors (normal, log-normal, and exponential) [28]. We found that a normal distribution prior on both the fossils outside the rhaphidophorids and on a secondary node constraining Macropathinae + Aemodogryllinae + Rhaphidophorinae gave the optimal result, and these were used for the final analysis (Table 2).
Fossils belonging to the genus Aboilus Martynov (201.3–157.3 million years ago [Mya]) are the oldest definitive Prophalangopsidae known [66,67]. These are well-recognized fossils previously used in divergence dating analysis of Orthoptera [1,50]. Aboilus consists of 20 extinct taxa [2], with fossils from the Jurassic and Cretaceous. We constrained two commonly used extant species of Prophalangopsidae in our molecular analyses (represented by Cyphoderris monstrosa Uhler and Tarragoilus diuturnus Gorochov) under a normal distribution prior with the minimum fossil age as a minimum soft bound (157.3 Mya) and 192 Mya as a maximum soft bound.As a secondary fossil calibration point, we constrained our analysis using a recent phylogenomic study of Southern Hemisphere rhaphidophorids calibrated with a Prophalangopsidae fossil (Aboilus) and a recent geological constraint [6]. We used 160 Mya as a mean age, with 95% Highest Posterior Density (HPD) values as soft minimum and maximum bounds at the node of Macropathinae and Aemodogryllinae + Rhaphidophorinae.
The BEAST input file was generated using BEAUti2 v2.7.5 [68] by implementing parameters for molecular clock models, trees, and fossil priors. As in the ML phylogeny, we used optimal partitioning by genes in the concatenated protein-coding mitochondrial DNA dataset by linking clock and tree models for three final substitution models. We implemented a GTR model with non-standard substitution models by allowing parameter linking. Fossil-calibrated analyses were run under an uncorrelated optimized relaxed clock model with the birth–death process as a tree prior.
For comparison we also calibrated dating analyses of the same DNA dataset using two node age estimates derived from a previous study that relied on the paleogeographic inference of the timing of ancient land distributions (referred to here as ‘landscape’ calibration). This approach makes the assumption that continental drift was the primary influence on lineage splitting in the Rhaphidophoridae [3]. Thus, the split between the North American Ceuthophilinae and the European Troglophilinae was set at 68.4 Mya with 95% HPD bounds of 46.3–99.3, and the ancestor of Aemodogryllinae and Rhaphidophorinae with Macropathinae was set to 117 Mya with 95% HPD bounds of 105–130. We enforced similar settings as above in BEAUti2 using a relaxed molecular clock and the birth–death process as a tree prior. We used 95% HPD values of these node ages as soft minimum and maximum bounds in a normal prior distribution around the secondary landscape calibration points.
For both calibration approaches we enforced monophyly constraints on each subfamily for consistency in topologies of molecular clock dating trees with the ML tree topology from 13 protein-coding genes. Initially, to assess the convergence of models using different distribution priors, we conducted BEAST2 analysis of 10 million generations. After considering analysis convergence and evaluation of Effective Sampling Sizes, final BEAST2 runs of 100 million generations with sampling every 1000 generations were performed. Tracer v1.7 [70] was used to inspect the results, and ESS statistics were investigated to check the fit of the models. We considered ESS values greater than 250 sufficient for the analyses to be informative after discarding 10% of the run as burn-in. Maximum clade credibility trees with median heights were generated in TreeAnnotator v2.7.1 [71] after removing fossils and were visualized in FigTree v1.4.4 [70].
3. Results
3.1. Systematics
The ML tree for the set of 117-taxa resulted in six well-supported clades congruent with recognized subfamilies of the Rhaphidophoridae. All the clades were supported by high statistical bootstrap values > 90 (Figure 2). Although diverse in terms of body size and color patterns, most rhaphidophorid genera are recognized by a few traits that typically include apical spines on legs and features of male terminalia. Nevertheless, our phylogenetic hypothesis was mostly concordant with the current taxonomy. Within the subfamily Aemodogryllinae, four of the six genera sampled formed separate monophyletic clades. The notable exception to this was the placement of six taxa in the genera Diestrammena Brunner von Wattenwyl and Tachycines Adelung in three separate paraphyletic clades: (a) Tachycines asynamorus (Adelung) with Tachycines shuangcha Feng, Huang & Luo having a close relationship to Gymnaetoides Qin, Liu & Li; (b) Diestrammena japanica Blatchley with Diestrammena fengyangshanica; and (c) Tachycines zorzini (Rampini & Di Russo) with Diestrammena sp. (Figure 2).
3.2. Rhaphidophoridae Mitogenomic Data
New mitochondrial genomes were assembled and annotated for seven rhaphidophorids. For all sampled taxa (Table 1), gene order was typical of mitochondrial genomes already documented for Rhaphidophoridae, comprising the expected complement of 13 protein-coding genes, 22 tRNAs, 2 rRNAs, and a repeat region (putative control region) (Supplementary Figure S1) [6]. The final length of 13 concatenated protein-coding genes varied from 11,208 bp (MPN_CW4347) to 11,231 bp (MPN_CW5536 and MPN_CW5525), with truncated AT stop codons in COII, ND4, and ND5 in some sampled taxa (Supplementary Table S3). Assembled mitochondrial genomes, excluding the putative control region that lies between the small rRNA and tRNAs adjacent to ND2, ranged in size from 14,718 bp (MPN_ORT15) to 14,885 bp (MPN_CW5529).
3.3. Phylogenetic Analysis and Time Calibration
Phylogenetic analysis of the concatenated alignment of 13 mitochondrial protein-coding genes (11,124 bp) yielded a resolved tree topology with high node bootstrap support (99 or 100%) (Supplementary Figure S2). Topologies from different partition and model schemes on nucleotide and amino acid alignments were congruent and without significant differences in node support values, with a gene concordance factor > 45 (Supplementary Figures S3–S5). The topology was found to be consistent with the current classification of rhaphidophorid subfamilies. Despite the smaller number of taxa representing the subfamily Aemodogryllinae, the paraphyletic nature of the genera Diestrammena and Tachycines was consistent with our findings from the analysis of a combination of partial gene sequences for 117-taxa. Stonychophora from the Vangunu Island, Solomon Islands (MPN_ORT15), were grouped within the Asian subfamily Rhaphidophorinae but on a long branch.
Following standard practice [69,72,73], initial fossil calibration and secondary landscape calibration analyses were performed using 10 million generations for each under different combinations of prior distributions to access the effects on convergence with reference to Effective Sampling Size (ESS) statistics examined in Tracer. During this process, it was recognized that all the analyses started to converge between 1 and 4 million generations, with stable node ages and good ESS values (>250) for all the priors (after removing 10–40% as burn-in), with the exception of secondary landscape calibration that showed varying node ages and 95% HPD intervals. Analysis using a combination of log-normal and exponential priors yielded a wide range of upper and lower bounds for all node ages. For the final analysis, normal priors for both the calibration points (fossil and secondary fossil calibration) were found to be optimal based on the evaluation of ESS statistics (Table 2, Beast run 5). For secondary landscape calibration, uniform and exponential distribution priors produced slightly higher median ages compared to results with a normal prior and very wide ranges of minimum and maximum 95% HPD intervals for the node ages of Troglophilinae and Ceuthophilinae. Final analysis of secondary landscape calibration was therefore performed using normal prior distributions (Table 2, Beast run 4).
Our fossil-calibrated molecular clock analysis estimated the origin of Northern Hemisphere Rhaphidophoridae subfamilies during the Jurassic and Early Cretaceous periods of the Mesozoic Era (Figure 3). The earliest common ancestor of the Rhaphidophoridae we sampled is estimated to have lived during the Early Jurassic, 188.7 Mya (Table 2). We estimated that the split between the North American Ceuthophilinae and Mediterranean Troglophilinae (~153 Mya) and Asiatic lineages from Southern Hemisphere Macropathinae (~164 Mya) also occurred during the Mesozoic. The Aemodogryllinae and Rhaphidophorinae diverged during the Cretaceous (~138 Mya). The most recent common ancestor within the Rhaphidophorinae diverged at about 105 Mya in the Early Cretaceous, represented by the node between Stonychophora from Vangunu Island, Solomon Islands (MPN_ORT15), and the remaining Asian taxa diverged throughout the Cenozoic Era. The common ancestor of the sampled Aemodogryllinae taxa was estimated at 110 Mya.
In contrast to the fossil-calibrated analysis, our secondary landscape calibration of the phylogeny based on inferences from landscape history suggests significantly younger node ages with narrower credibility intervals (Table 2). The estimation of the most recent common ancestor for Rhaphidophoridae indicates a divergence that occurred approximately 110 Mya during the Early Cretaceous. This divergence was followed by the separation of North American and Mediterranean taxa around 70 Mya and the divergence of Asiatic taxa around 108 Mya from the Macropathinae. Within the Asiatic lineages, the common ancestor of the Aemodogryllinae and Rhaphidophorinae lived about 88 Mya. The divergence of the most recent common ancestor of the Pacific taxon and the Asian taxa was estimated to have occurred at 67.8 Mya, while the divergence of the Aemodogryllinae was estimated at 70.5 Mya (Supplementary Figure S6).
4. Discussion
4.1. Systematics
Our phylogenetic analysis of 117 Rhaphidophoridae found an excellent concordance between the taxonomy and evolutionary relationships, despite morphological conservation within this family. The placement of only six of the included taxa within Diestrammena and Tachycines constitutes an exception to the general observation of monophyletic genera. There is inconsistency between the phylogenetic relationships among six Diestrammena and Tachycines taxa inferred from DNA sequence data with the current classification scheme of two subgenera based on morphology [13,49]. Discrepancies in the assignment of subgenera have also been reported for other genera (e.g., Diestramima Storozhenko) in the same subfamily [16]. Adelung (1902) [33] erected the genus Tachycines. Since then, the taxonomic placement of taxa associated with Tachycines Adelung and Diestrammena Brunner von Wattenwyl and with Gymnaeta Adelung has been repeatedly modified with the use of the additional subgenus rank [13,34,35,49,74]. The lack of monophyly identified by our analysis of molecular data suggests that a third genus needs to be recognized to resolve the current inconsistencies (Figure 2, clades a, b, and c). This can be achieved by resurrection of the genus Gymnaeta Adelung and by revising Tachycines zorzini (Rampini & Di Russo) as Gymnaeta zorzini and Diestrammena sp. (GenBank accession: MT849270) as Gymnaeta sp., while maintaining the monophyly of Tachycines and Diestrammena.
4.2. Lineage Age and Origin
Some of the uncertainties of molecular clock analysis, including substitution rate variation, are integrated into molecular dating within the Bayesian framework [75], but the scarcity of appropriate fossil material and the potential for uncertain interpretation of their systematic relationships is inevitable. We showed that the prior distribution models (normal, log-normal, or exponential) used for our calibrations of molecular clock analyses did not significantly impact our estimates of the timing of common ancestors. However, our fossil calibration (in the outgroup) and secondary fossil calibration node (in the ingroup) are not entirely independent of one another and therefore might result in the appearance of greater accuracy than is realistic in our molecular clock analysis. The universal uncertainties from incomplete sampling that results from both extinction and lack of specimens for DNA sequencing must also be considered [26,76]. Our analysis included new samples representing the subfamilies Aemodogryllinae and Rhaphidophorinae from a wider geographic range than previously considered, including the Kingdom of Bhutan in the Himalaya. Better representation of the diversity within these lineages should improve our estimates of the age of their most recent common ancestor. However, the poor sampling from the Pacific Islands and the lack of samples from India, where divergent lineages may exist, remain a major challenge. Therefore, we need to treat all date estimates as hypotheses that require further testing.
If the calibration of our data-rich molecular clock analysis is realistic, then the orthopteran family of camel crickets (Rhaphidophoridae) had a common ancestor before Pangea broke into the supercontinents of Gondwana and Laurasia (~180 Mya). The Jurassic was a major period of continental movement and would appear to have coincided with the divergence of the Mediterranean and North American subfamilies from the Asian and southern subfamilies. However, the confidence intervals around divergence estimates based on fossil calibrations are such that it will be difficult to test vicariant hypotheses based on events that took place so long ago. If the orthopteran fossils from Triassic and Jurassic deposits used for time calibration have been correctly identified, then the age of the rhaphidophorid family is much older than inferred based on an assumption of landscape vicariance [3] and calibration based on secondary constraints derived from a phylogenomic study of Orthoptera [7]. Specifically, the most recent common ancestor of the European lineages (Troglophilinae and Dolichopodainae) and the North American lineage (Ceuthophilinae) seems to have existed before the supercontinent Laurasia broke up to give rise to the basal rocks of Europe, North America, and much of Asia.
Divergence of the Rhaphidophoridae family from a common ancestor during the Late Triassic and Jurassic periods is compatible with the divergence dates of Rhaphidophorids obtained from fossil-calibrated phylogeny studies of Ensifera [1,6,16,65]. The increase in subfamily diversity of Rhaphidophoridae is also consistent with the Jurassic-to-Early Cretaceous peak in insect diversity [77,78], which is in part explained by a warmer climate and the Early Cretaceous radiation of angiosperms [79,80]. We constrained our molecular clock analysis so that the Southern Hemisphere Macropathinae shared a common ancestor with Asiatic Aemodogryllinae and Rhaphidophorinae about 160 Mya, which agrees with a hypothesis based on morphology [12,13].
Divergence times inferred from our alternative analysis using secondary landscape calibrations were significantly younger than those estimated with our fossil calibration. Inconsistency in estimates derived from geophysical models of landscape changes have previously been observed [7,32], and ambiguity about the timing and biological influence of paleoenvironments such as Beringia (e.g., [81,82]) suggests that they are probably inappropriate for constraining phylogeny. The spatial distribution of lineage diversity in the Macropathinae also shows that the location of extant representatives of deep lineages does not indicate the ancestral location [26,76,83].
We inferred that a common ancestor of the two Asian subfamilies Aemodogryllinae and Rhaphidophorinae existed during the Late Jurassic/Early Cretaceous (155–121 Mya), when Gondwana and Laurasia were breaking up, and prior to the Late Cretaceous (110–65 Mya) Beringia land connection of North America and Asia. Moreover, stratigraphic evidence indicates that subduction of the Indian tectonic plate under Asia began about 61 Mya [84], with the subsequent formation of connecting land masses through continental collision about 45 Mya [85]. In our analysis, the earliest diversification of representative Aemodogryllinae and Rhaphidophorinae from Bhutan, Southeast China, and Japan occurred before the Tertiary contact of the Indian subcontinent and Eurasian tectonic plates [86]. The estimated diversification of Diestramima starting at about 63 Mya is inconsistent with the timing of the Himalayan emergence and the associated change in weather patterns thought to have influenced the diversification of this genus in Southeast China [16].
Our sample of Stonychophora from the Solomon Islands is at the southernmost end of the known range of the Rhaphidophorinae and brings this subfamily geographically close to the Macropathinae that span the Southern Hemisphere (Figure 1). In the current analysis Stonychophora is sister to Rhaphidophora species sampled from Bhutan, and their common ancestor was estimated to have existed about 106 Mya. We know through radiometric dating that the Solomon Islands archipelago started to form from volcanic activity 45–40 Mya [87], and Vangunu Island, where the specimen was collected, formed from more recent Plio-Pleistocene volcanics [88]. This indicates a complex biogeographic history of Stonychophora in the archipelago, Papua New Guinea, and through the Malay Archipelago—a region long recognized as a biogeographic nexus [89]. The establishment of such island biotas requires colonization from dispersal over water [6,8,90], which could obscure any signal of the spatial origins of subfamily lineages. The Solomon Islands archipelago spans a large area, with islands of various ages, so further sampling in this region is needed to interpret rhaphidophorid diversity in the region and its evolutionary history in relation to other Rhaphidophorinae in Southeast Asia. Nevertheless, it appears that the ancestral connection of these lineages to the Asian continent was via Southeast Asian, through the Western Pacific, rather than through India or Beringia.
The reference list from the paper itself. Each links out to its DOI / PubMed record.
- 1Song H. Amédégnato C. Cigliano M.M. Desutter-Grandcolas L. Heads S.W. Huang Y. Otte D. Whiting M.F. 300 Million Years of Diversification: Elucidating the Patterns of Orthopteran Evolution Based on Comprehensive Taxon and Gene Sampling Cladistics 20153162165110.1111/cla.1211634753270 · doi ↗ · pubmed ↗
- 2Cigliano M. Braun H. Eades D. Otte D. Orthoptera Species File Available online: http://orthoptera.speciesfile.org/Home Page/Orthoptera/Home Page.aspx(accessed on 25 June 2025)
- 3Allegrucci G. Sbordoni V. Insights into the Molecular Phylogeny of Rhaphidophoridae, an Ancient, Worldwide Lineage of Orthoptera Mol. Phylogenet. Evol.201913812613810.1016/j.ympev.2019.05.03231132518 · doi ↗ · pubmed ↗
- 4Trewick S.A. A New Weta from the Chatham Islands (Orthoptera: Raphidophoridae)J. R. Soc. N. Z.1999216517310.1080/03014223.1999.9517590 · doi ↗
- 5Trewick S.A. Molecular Evidence for Dispersal Rather than Vicariance as the Origin of Flightless Insect Species on the Chatham Islands, New Zealand J. Biogeogr.2000271189120010.1046/j.1365-2699.2000.00492.x · doi ↗
- 6Dowle E.J. Trewick S.A. Morgan-Richards M. Fossil-Calibrated Phylogenies of Southern Cave Wētā Show Dispersal and Extinction Confound Biogeographic Signal R. Soc. Open Sci.20241123111810.1098/rsos.23111838356874 PMC 10864783 · doi ↗ · pubmed ↗
- 7Kim D.-Y. Kim S. Song H. Shin S. Phylogeny and Biogeography of the Wingless Orthopteran Family Rhaphidophoridae Commun. Biol.2024740110.1038/s 42003-024-06068-x 38565627 PMC 10987581 · doi ↗ · pubmed ↗
- 8Grandcolas P. Trewick S.A. What Is the Meaning of Extreme Phylogenetic Diversity? The Case of Phylogenetic Relict Species Biodiversity Conservation and Phylogenetic Systematics: Preserving Our Evolutionary Heritage in an Extinction Crisis Pellens R. Grandcolas P. Topics in Biodiversity and Conservation Springer International Publishing Cham, Swizterland 20169911510.1007/978-3-319-22461-9_6 · doi ↗