Nonlinear Spectroscopy in Chlorophyll Dimers Embedded in an Asymmetric Phonon Bath
Mohamad Toutounji

TL;DR
This paper studies how nonlinear spectroscopy can reveal the effects of an asymmetric phonon environment on chlorophyll dimers in photosynthetic complexes.
Contribution
A new method for modeling exciton–phonon coupling using asymmetric phonon spectral densities in photosynthetic systems.
Findings
Asymmetric phonon spectral densities influence the 1-phonon profile and absorption spectra.
The method enables fine-tuning of electron–phonon coupling in multimode photosynthetic systems.
Nonlinear optical signals reveal insights into exciton–exciton and exciton–phonon interactions.
Abstract
The electronic transition dipole moment 4-point time correlation function for a dimeric photosynthetic complex, from which nonlinear optical time-domain signals may be obtained. This 4-point time correlation function draws on an experimentally fit spectral density of the surrounding phonons of the photosynthetic protein. The spectral density of the photosynthetic phonons renders a phonon-sideband characterized by its asymmetry, caused by the unequal contribution from the photosynthetic phonons (bath) to the low- and high-energy sides of the optical signals. This spectral density manifests its asymmetry explicitly in the 1-phonon profile, due to the intimate spectral connection between them, which will in turn reflect in the entire phononic part of the absorption spectrum. The asymmetry plays an important role in characterizing the exciton–phonon coupling strength and the phonon…
Genes, proteins, chemicals, diseases, species, mutations and cell lines named across the full text — each resolved to its canonical identifier and authoritative record.
Click any figure to enlarge with its caption.
 1
1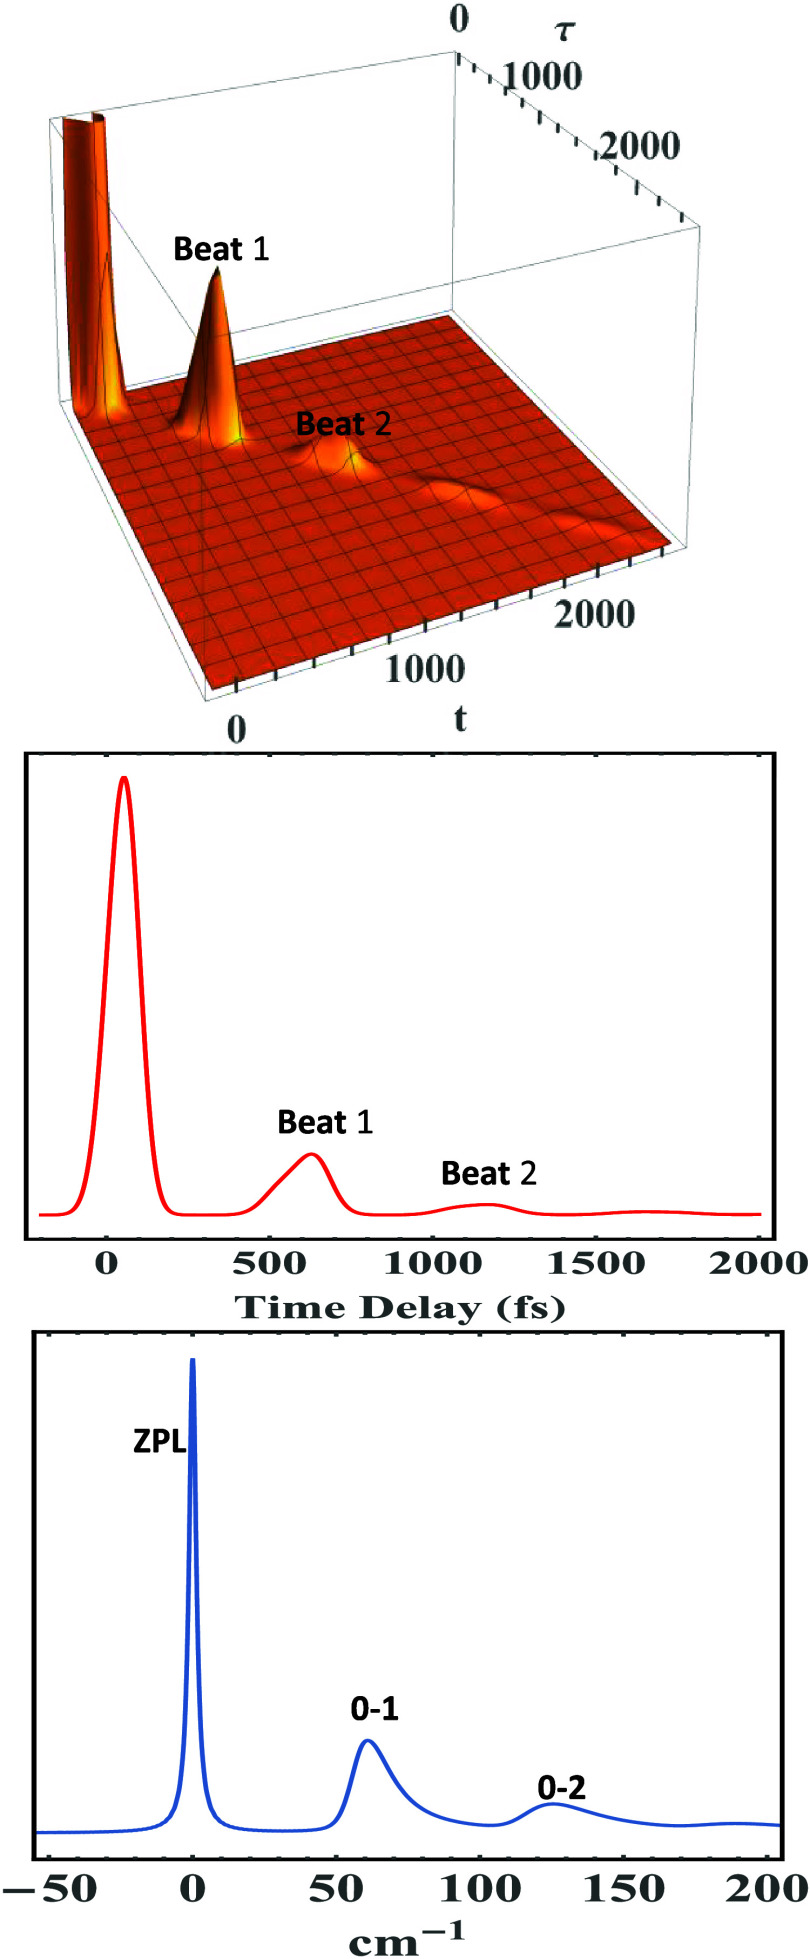 2
2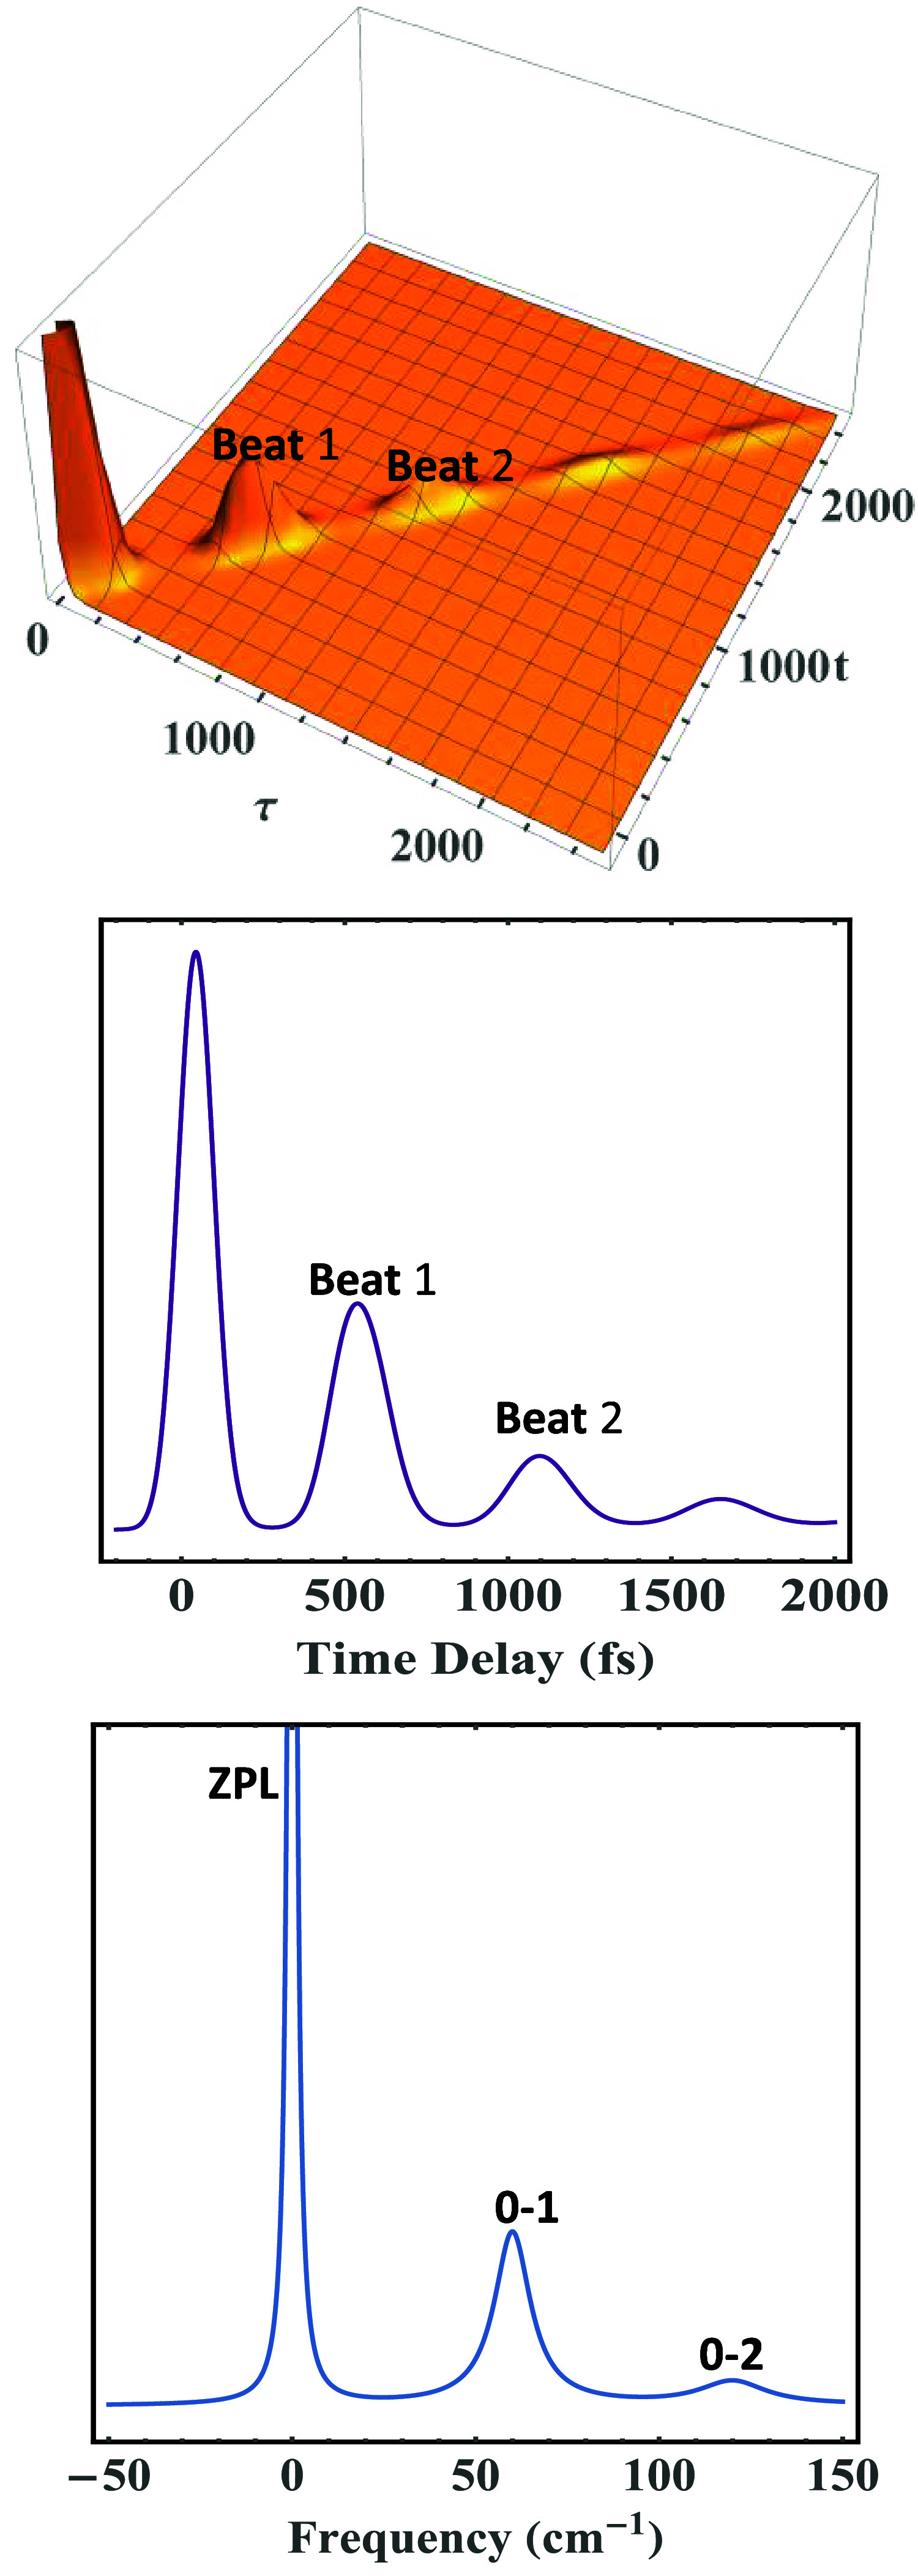 3
3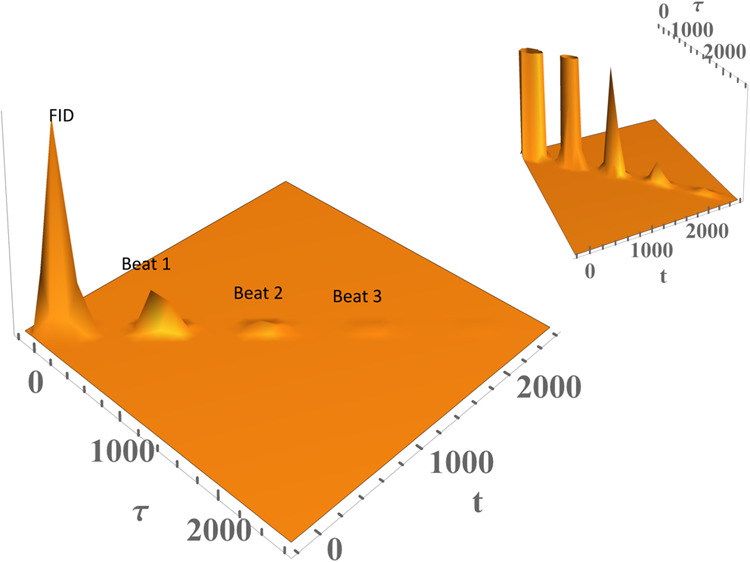 4
4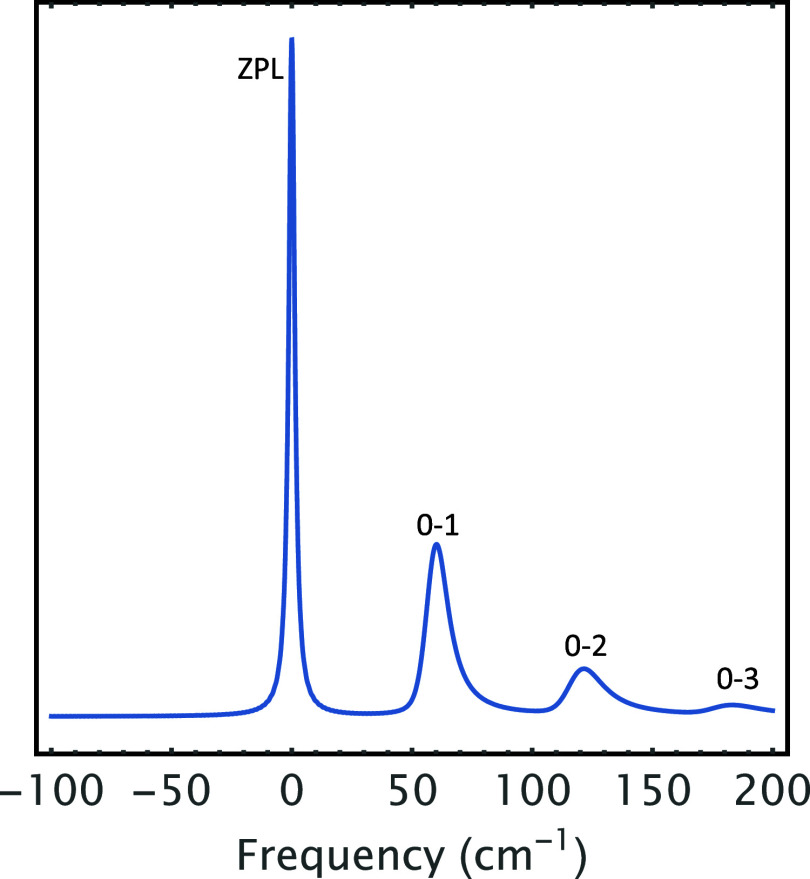 5
5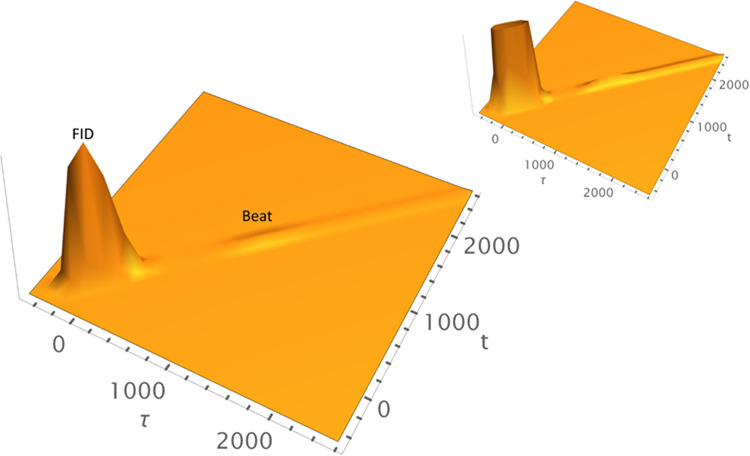 6
6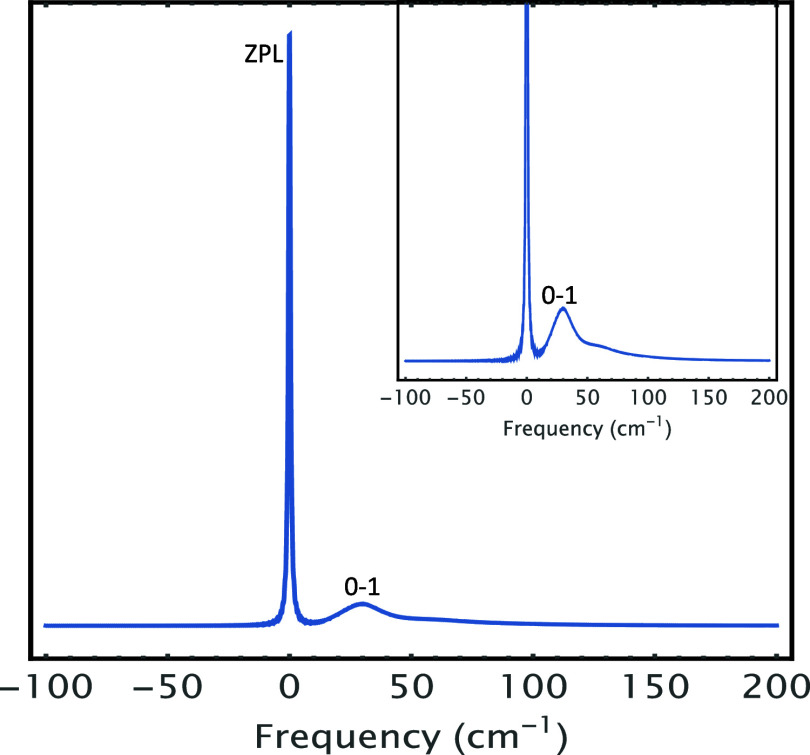 7
7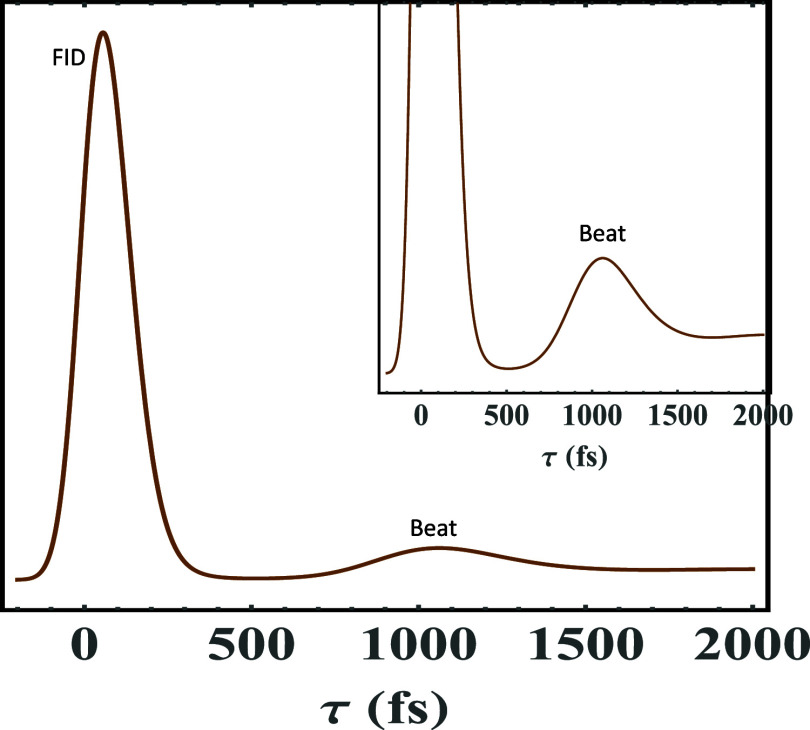 8
8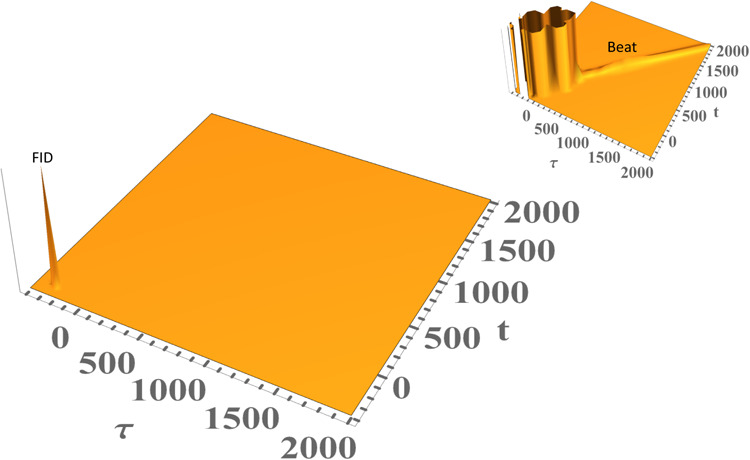 9
9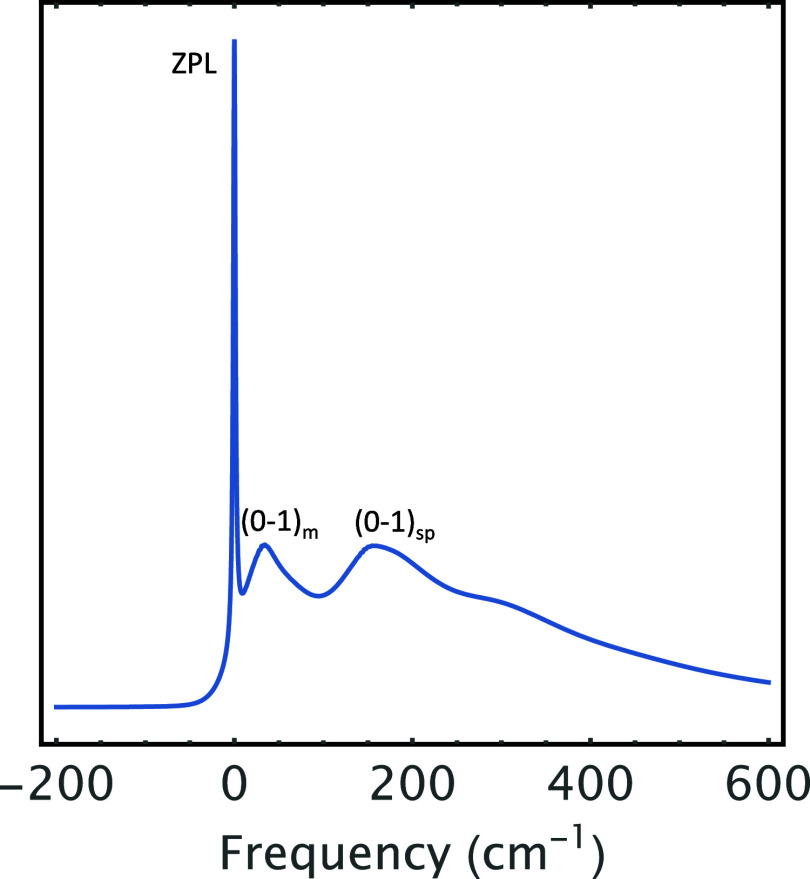 10
10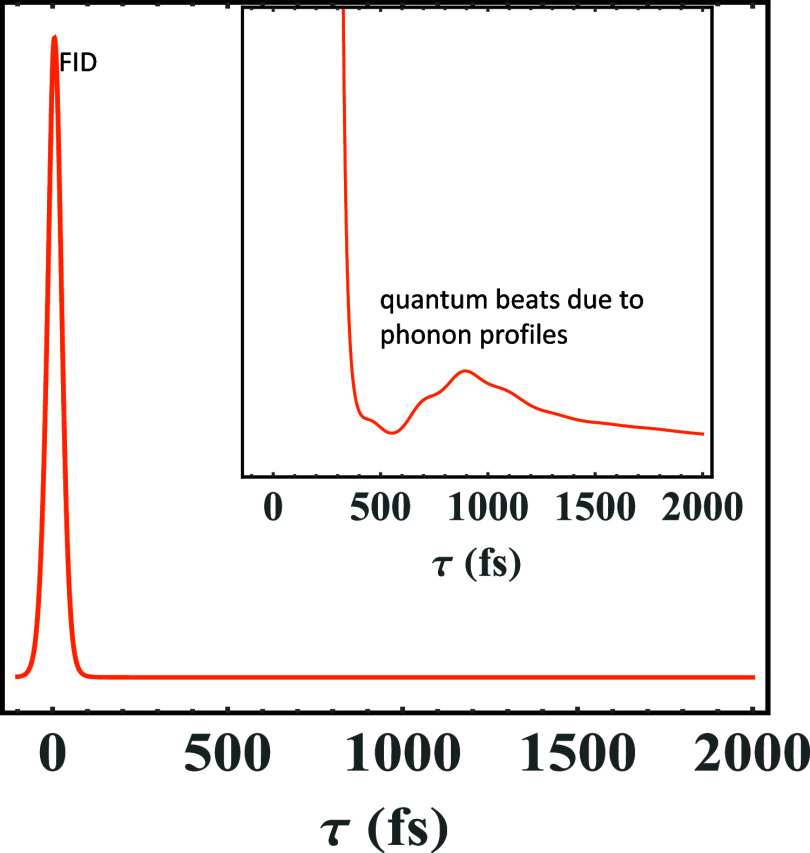 11
11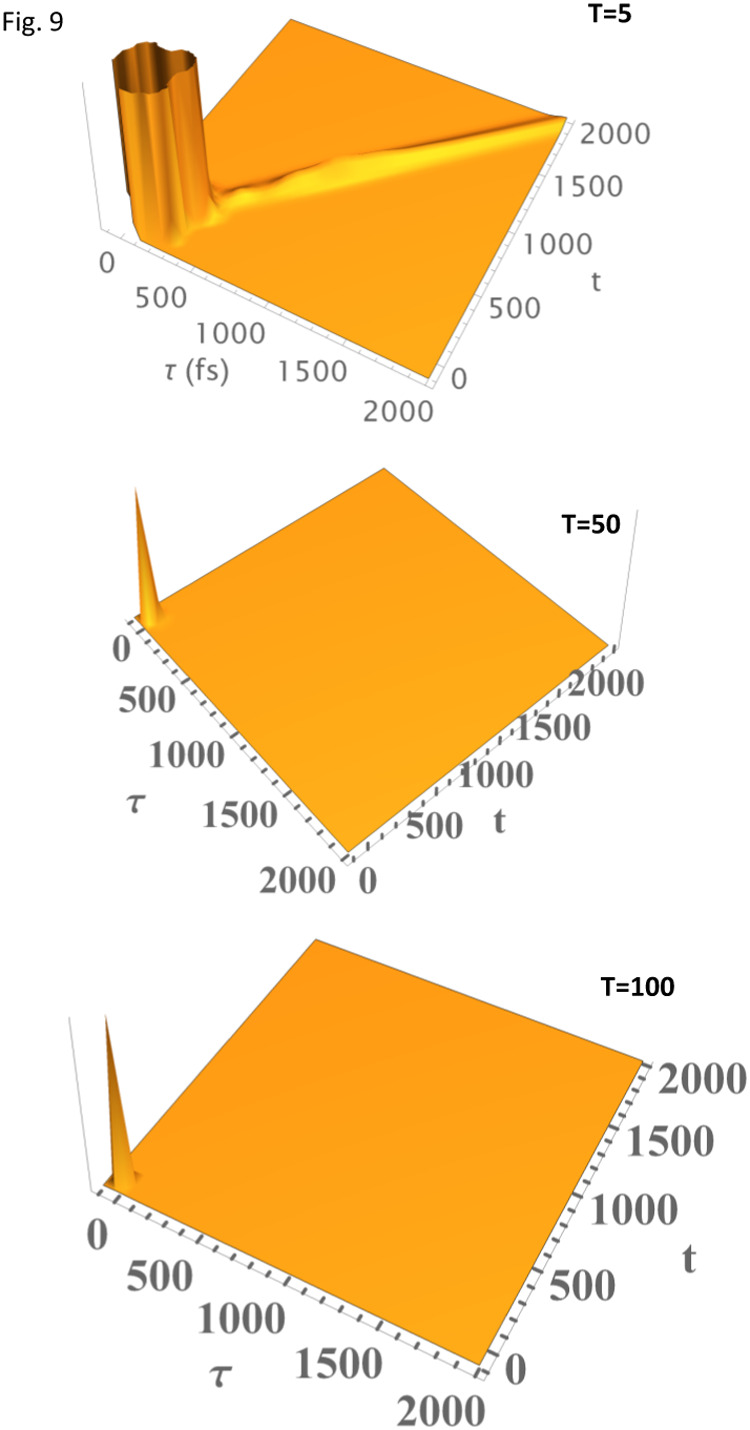 12
12- —United Arab Emirates University10.13039/501100006013
Peer Reviews
No public reviews on file for this paper yet. If you reviewed it on a platform where reviews are public (OpenReview, ICLR, NeurIPS, ICML), you can paste yours below so the community can read it here.
Videos
No videos yet. Explain this paper in a talk, walkthrough, or lecture? Add one.
Taxonomy
TopicsSpectroscopy and Quantum Chemical Studies · Photosynthetic Processes and Mechanisms · Photochemistry and Electron Transfer Studies
Introduction
I
Nonlinear optical spectra provide structural and dynamical information about the important properties of these systems in condensed media. These properties include exciton–exciton and electron–phonon couplings, electronic dephasing, phonon relaxation, echo peak shift (for extracting spectral density), and any other dynamical information. Although it is often difficult to obtain structural and dynamical information from linear spectroscopy in condensed systems, important peaks such as the zero-phonon line (ZPL) and phonon sideband (PSB) may be masked by static inhomogeneous broadening/dephasing. For this reason, more robust techniques, such as 4-wave mixing experiments, are required. ?−? ? ? ? ? ? ? ? ? The shape and width of spectral profiles of molecular aggregates, especially photosynthetic complexes, are caused by system-bath (pigment–protein) interaction, giving rise to dephasing and other dissipative forces. ?,?,?−? ? ? ? ? ? ? ? ?
The employment of a physically accurate bath spectral density leads to correct accounting for these spectral and dynamical properties. While theoretical formulation under the Markovian and Condon approximations leads to symmetric phonon profiles, the experiments performed on molecular chromophores embedded in proteins, polymers, and glasses have shown asymmetric phonon profiles, most of which are dominated by 1-phonon profile. ?−? ? ?,?−? ? ? ? Many theoretical works utilize Debye spectral density or structurally similar spectral densities (e.g., exponential, Gaussian, the Brownian oscillator model, or Lorentzian function spectral densities, etc., all of which signify symmetric phonon bath distribution). These spectral densities are inherently symmetric and, therefore, do not seem to accurately model the spectra in bacterial reaction centers (RCs) and antenna complexes, leading to inaccurate shape and symmetry of the PSB in the line shape. ?−? ?,?−? ? ? ?
Small et al. ?−? ?,? used experimental fit of hole-burned spectra at various temperatures on chlorophylls embedded in the and Rhodopseudomonas (Rps. viridis) RC protein complex to determine the strength of the linear electron–phonon coupling, defined by the Huang–Rhys factor (S), of the surrounding protein phonons in photosynthetic complexes and the associated 1-phonon profile. Hayes–Small formalism (HSF) ?−? ?,? had proposed, guided by their experimental data, that the protein phonons could be composed of a half Lorentzian function on the high-energy side and a half Gaussian function on the low-energy side in the frequency domain, as one possible way to account for the asymmetry in the phonons spectral density; hence the phonon bath distribution and 1-phonon profile. Henceforth, this asymmetric spectral density of phonons and the 1-phonon profile will be referred to as a G-L distribution. The G-L distribution will be adopted here in the time domain to account for the asymmetry in calculating nonlinear 4-wave mixing signals, e.g., photon echo. Small et al. ?−? ?,? and other research groups ?,?−? ? ? ? did experiments on chlorophylls embedded in the protein complex. They showed that their spectra may satisfactorily fit a G-L distribution in the frequency domain. Feng et al.? reported calculations using parameters typically found in photosynthetic complexes and showed that using the G-L distribution to fit their spectral data was as gratifying as the log-normal distribution.
Recently, Toutounji ?,? reported a linear electronic transition dipole moment time correlation function based on pure electronic dephasing (Γ_ZPL_), linear electron–phonon coupling, and asymmetric PSB using a G-L distribution function. This correlation function is computationally expedient, mathematically tractable, and easily applicable to multimode systems.? Finally, it resolves the discrepancies, errors, and inconsistencies arising when using HSF? in multimode systems. The Fourier transform of the linear electronic transition dipole moment time correlation function derived by Toutounji? yields an absorption line shape of one mode that is identical to that of HSF and that of Jankowiak et al.? Calculations of spectra of Rps. viridis RC protein complex special pair (the mean frequency mode and the marker mode) were presented, showing excellent agreement. It is noteworthy that while the line shape function of Toutounji, that of HSF,? and that of Jankowiak et al.? are identical for one vibrational mode, and discrepancy arises only in case of more than one-mode system where HSF falls short and that of Toutounji ?,? and Jankowiak et al.? yield identical line shape functions.? Although Jankowiak et al.? corrected the discrepancies and inconsistencies caused by HSF in the case of a multimode system, they made the line shape expression more complicated and less efficient computationally. Additionally, the expansion terms of the nested sums in their line shape expression keep growing as the pigment-complex coupling strength (S) increases, which requires more phonon progression terms, especially at high temperatures, all of which are avoided using the formalism of Toutounji. ?,? Furthermore, Jankowiak et al.? did not seem to have reported any numerical strategy for terminating these proportionally growing expansion terms, causing accuracy issues to arise.
The present work reports a linear electronic transition dipole moment time correlation function whereby Γ_ZPL_, exciton–exciton coupling, linear exciton–phonon coupling, and asymmetric PSB using a G-L distribution function are all accounted for in pigment–protein complexes. The exciton–exciton coupling manifests itself in its most basic form through blue shifting the vibronic bands: only the upper excitonic state energy shows up in the spectra in accord with the formula, E + = ε + V, where ε and V the Franck–Condon electronic energy transition and resonant pigment–pigment coupling (excitonic coupling), respectively. This excitonic coupling V is assumed to be larger than the electron–phonon coupling (through the reorganizational energy λ) in the current formulation to reflect some exciton formation to the optical signal. Note that neither disorder nor exchange coupling effects are accounted for. The dimerization shifting effect (often called energy displacement) will also be precluded in this formulation.
Additionally, this work shows how to compute nonlinear optical signals (4-wave mixing experiments) of systems embedded in an asymmetric bath of phonons of the nonlinear optical electronic transition dipole moment correlation functions (Liouville space pathways) in the time domain to probe pigment–protein complexes, in which the pure electronic dephasing (Γ_ZPL_), vibrational relaxation effects, 1-phonon profile asymmetry, exciton–exciton coupling, and exciton–phonon coupling in bacterial RCs are accurate. Although Jankowiak et al.? corrected the discrepancies and deficiencies posed by HSF, not only is the pigment–pigment interaction (V) missing, but also extending it to the time domain is infeasible due to its complexity (computationally demanding, particularly in an N-mode system), especially in case of a strong exciton–phonon coupling where S is large, which requires many terms, vide supra, rendering computational inefficiency. The nonlinear electronic transition dipole moment 4-point time correlation function for a dimeric photosynthetic complex whereby the surrounding phonons exhibit asymmetric distributions at different temperatures is derived, starting from the time domain. Although formulas for optical signals, e.g., photon echo, pump–probe, and hole-burning signals, are provided, this work only reports computations for photon-echo optical signals. Note that neither HSF nor that of Jankowiak and Reppert? would readily lead to any time-domain 4-wave mixing signals, especially for multimode systems. Additionally, the lineshaped expression of Jankowiak and Reppert? does not account for exciton–exciton coupling.
Electron–phonon coupling competes appreciably in molecular aggregates with electronic delocalization (caused by excitonic coupling). While excitonic coupling tends to drive electronic delocalization, the interaction between electronic degrees of freedom and vibrations seems to support the converse, that is, suppressing it by localizing it. This interplay between the two couplings tends to affect excitonic transport through the aggregates. The spectral density distribution of the vibrations (phonons) plays a central role in this competition. Major parts of an optical signal depend on the form and shape of the spectral density. For example, the phonons reorganizational energy, λ, is expressed in terms of the spectral density, C(ω), as λ = ∫ 0 ^∞^ C(ω)/ωdω while λ and C(ω) quantify electron–phonon coupling strength, V signifies the Coulombic pigment–pigment electronic coupling in photosynthetic pigment–protein complexes (PPCs). V and λ are two fundamental factors that play a crucial role in driving excitation transfer. While V signifies the pigment–pigment coupling, λ (the bath reorganization energy) measures pigment-phonon coupling strength through the above integral formula, vide supra. For this reason, many groups have been studying the interplay between these two them, thereby understanding quantum coherence longevity and its impact on electronic energy transfer. The case whereby V < λ leads to Förster’s theory, whereas the opposite limit (V > λ) can be treated using Redfield theory. (The former case results in fast dephasing or incoherent transfer caused by electron–phonon coupling in which exciton wave function would be incomplete). This case results in fast dephasing, which hinders exciton formation. However, the intermediate regime where V and λ are comparable is more challenging and requires different treatments. Different approaches have been developed to treat the above regimes using Redfield or modified Redfield equations and their polaron-transformed versions, including relaxing the secular and Markovian approximations.
This article is organized as follows. Section provides a brief background of the linear spectroscopic regime in the time domain to probe pigment–protein complexes, in which the pure electronic dephasing, vibrational relaxation effects, 1-phonon profile asymmetry, exciton–exciton coupling, and exciton–phonon coupling in bacterial RCs and photosynthetic PPCs. Nonlinear electronic transition dipole moment-time correlation functions are derived in Section, whereby 4-wave mixing signals may be computed. Section provides calculations of linear homogeneous spectra and photon echo signals. Section provides concluding remarks.
Theoretical Background for Linear Response
in Dimeric Complexes
II
This Section will briefly review our derivation? of linear electronic transition dipole moment time correlation function of homodimers. Starting with introducing some terms for a single monomer m, one can define B _ m _ = |gm⟩⟨em| and B _ m _ ^†^ = |em⟩⟨gm|, resulting in B _ m _ ^†^ B _ m _ = |em⟩⟨em| and B _ m _ B _ m _ ^†^ = |gm⟩⟨gm|. This leads to expressing the diagonal adiabatic electronic Hamiltonian for a monomer m
with H _ gm _ and H _ em _ being the ground and excited states nuclear Hamiltonians. For example, while the ground-state nuclear Hamiltonian of H _ gm _ may assume the form
the excited-state nuclear Hamiltonian H _ em _ of monomer m
Here, the upper linear displacement d _ jm , ω jm _ is the frequency, and b _ jm _ ^†^(b _ jm _) the creation (annihilation) boson operators of the vibrational mode j of monomer m due to linear electron–phonon coupling. Consider an excitonically coupled dimer with nuclear vibrations coupled to a bath of phonons. Assuming a homodimer in which the monomers (pigments) are coupled through the dipole–dipole effect, the Hamiltonian of the homodimer may assume the form
with
where ε_ m _ is the electronic transition energy of pigment m, B _ m _ ^†^ and B _ m _ are the electronic excitation and deexcitation Fermi operators, respectively, η_ jm _ is pigment-bath coupling constant, V _ mn _ is the Coulombic coupling between the electronic charge densities of the monomers n and m that make up the dimers (no Coulombic exchange interaction is considered here), and Q _ m _ is the collective bath coordinate coupled to monomer m. The form of the bath will not be important here, and the dynamics will be related to the spectral density C(ω) associated with each monomer m. In other words, the bath effect will be considered through the G-L distribution of the spectral density, which will be employed later.
The derivation of a linear electronic transition dipole moment time correlation function in which the exciton–phonon coupling is accounted for will be briefly sketched herein, rendering overtones that fold themselves on the fundamental transition (1-phonon profile) that has an asymmetric shape made of half Gaussian on the red side and half Lorentzian on the high-energy side, as reported by Hayes-Small and others. ?,?−? ? ? ? Starting with the definition of the linear electronic transition dipole moment time correlation function J(t)
where the electronic dipole moment is μ(t) = ∑_ m μ m (B _ m _ + B _ m _ ^†^) in which μ m _ is the dipole moment operator of the monomer m. The linear electronic transition dipole moment time correlation function in the Heisenberg representation is given by
in which the equilibrium density matrix is ρ_eq_ given by
where Z is the canonical partition function. The trace in eq is taken over electronic, nuclear, and bath degrees of freedom. Expanding eq in the electronic basis will project J(t) over in the nuclear and bath subspaces, whereas tracing over vibrations will give rise to FCFs, of a linearly coupled system, and tracing over the bath degrees of freedom will lead to the spectral profile shape and broadening.
Different research groups ?−? ? ? ? have fitted their data using a 1-phonon profile of an asymmetric shape of their photosynthetic complexes; the 1-phonon profile, whose width builds on the ZPL width (electronic dephasing), acts as the building block of the subsequent transitions, making up the PSB in the system of interest. This asymmetric 1-phonon profile may plausibly adopt this form
rendering a spectral density C(ω)= S _ j _ I 1(ω), with S _ j _ being Huang–Rhys factor, where γ_ j _ denotes the full width at half-maximum (fwhm) of the Lorentzian profile associated with mode j, whereas σ_ j _ is the corresponding standard deviation of the Gaussian distribution, yielding . While the unit step function u(ω – ω_ j ) ensures half of Lorentzian does not act earlier than ω j , takes over before the mode frequency ω j _, both of which carry different widths while composing one profile, resulting in an asymmetric shape. This asymmetry is also carried over to the spectral density C(ω). The pigments in the homodimer are assumed to have the same local C(ω), whereby fluctuations of both sites energy are uncorrelated, i.e., the spectral density is site independent. In short, C _ mn (ω) = δ mn _ C _ m _(ω) = C(ω). Performing the inverse Fourier transform of the 1-phonon profile of mode j yields the dephasing function R _ j _(t) of the protein phonons for as?
where
with
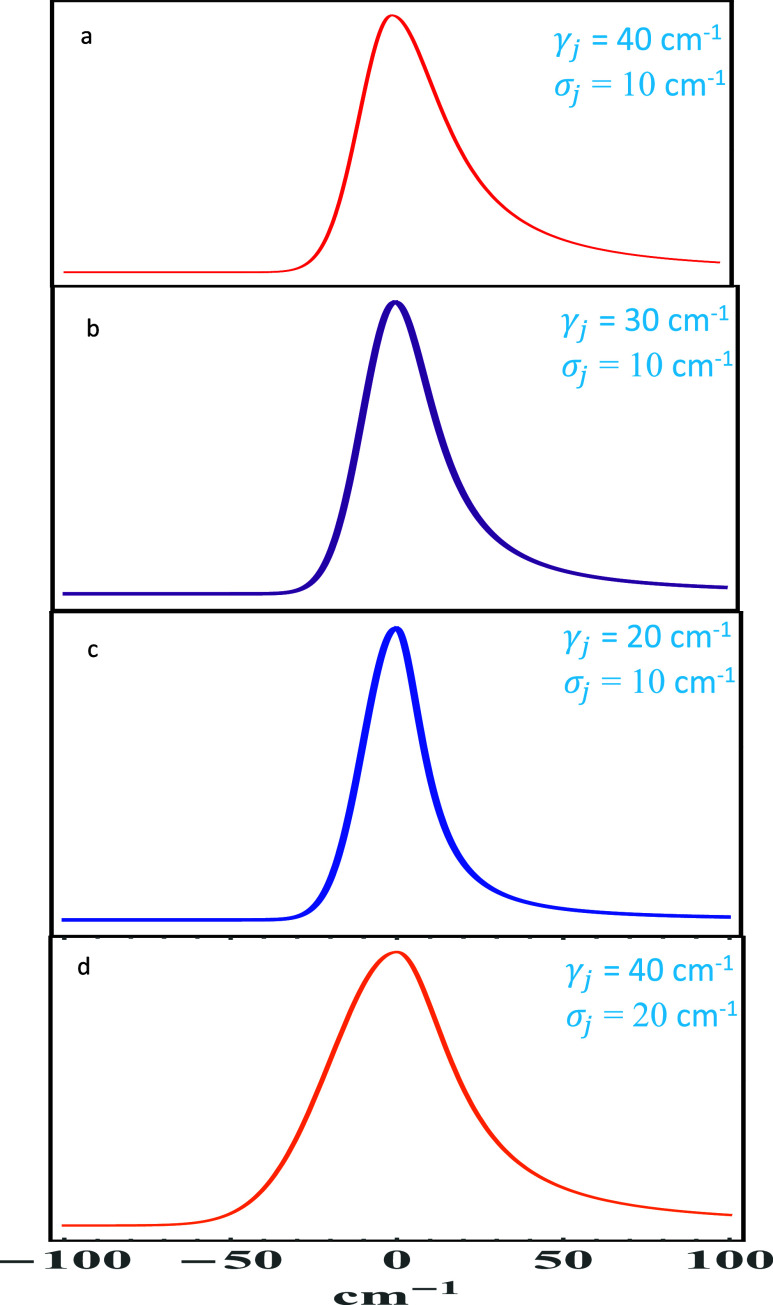
and (.) in eq is the error function. Note 1/γ_ j _ is the phonon relaxation time and such that the 1-phonon profile width (fwhm) is given by Γ_ j _ = (γ_ j _ + σ_ j )/2. Both γ j _ and σ_ j _ values, and hence Γ_ j , may be chosen to fit experimental data, as reported in ref [ ?,? ]. Figure shows the spectral density function using G-L distribution with various values of γ j _ and σ_ j _ while holding ω_ j _ and S _ j _ constant to exhibit the asymmetry. All panels a–d in Figure were calculated at ω_ j _ = 0 and S _ j _ = 1. Figure shows how the asymmetry variably changes as one goes from panel a–d, where panel a is the most asymmetric and panel d is reasonably symmetric. This degree of freedom in choosing symmetry/asymmetry is valuable in simulating open systems. Thus, this form of G-L distribution has the capability of fine-tuning the nature of electron–phonon coupling.
*Spectral density function with different asymmetric shapes calculated using G-L distribution with the shown values of γ j and σ j while holding ω j = 0 cm–1 and S
j = 1.0, rendering a width (fwhm) of the 1-phonon profile transition given by Γ j = (γ j
- σ j )/2. While panel (a) shows the most asymmetric spectral density and panel (d) represent a symmetric one, panels (b) and (c) are intermediate cases, thereby providing flexibility in modeling the degree of symmetry needed for the bath, and imparting capability of fine-tuning the nature of electron–phonon coupling caused by pigment–protein interaction.*
The linear electronic transition dipole moment time correlation function that treats the electronic dephasing and phonon relaxation processes independently in the monomers n and m of mode j is given by?
where 1/Γ_ZPL_ is the electronic pure dephasing time. The linear electronic transition dipole moment time correlation function in eq distinguishes between electronic dephasing and vibrational relaxation times. As such, it is sensitive to both electronic dephasing and vibrational relaxation processes, where the vibrational relaxation process encompasses unequal relaxation times, 1/γ_ j _ and 1/σ_ j _, where the former is exponential decay and the latter Gaussian, leading to asymmetric PSB in pigment–protein complexes. ?,? The reader is referred to refs [ ?,? ] for the dephasing function R _ j _(t) role, utility, and significance and how the 1-phonon profile is obtained in the frequency domain, which is essentially the spectral density of bath phonons. It is the spectral density, which represents coupling strength and density of states of phonons, that imparts information about broadening and dephasing effects.
The linear electronic transition dipole moment time correlation function with temperature dependence using?
for mode j is
with
The absorption line shape rendered by eq will result in a Lorentzian ZPL profile of width Γ_ZPL_ (fwhm) and multiphonon transitions making up the PSB of mode j with half-Gaussian and half-Lorentzian distributions of widths equal to σ_ j √k on the low energy side and kγ j _ on the high energy side, respectively, where k is the number of phonons associated with the transition. Finally, the linear electronic transition dipole moment time correlation function for a multimode system in which the PSB displays an asymmetry is
eq represents the final form of the linear electronic transition dipole moment time correlation function of excitonically coupled pigments at finite temperatures for a multimode system, assuming no population transfer. In light of the above, eq features (i) a homogeneous absorption spectrum that accounts for the asymmetric shape of the PSB and the symmetry of the ZPL due to electron–phonon coupling, (ii) pigment–pigment coupling interaction (excitonic coupling) for an N-mode system, (iii) the 1-phonon profile that carries its width over the overtones through folding, (iv) the elimination of all the inconsistencies, deficiencies, and difficulties associated with the theory presented by HSF, and, finally, (v) it is easily extendable to nonlinear spectroscopy, as will be demonstrated in the next Section.
Nonlinear Spectroscopy in Dimeric Complexes
III
This Section will extend the above linear spectroscopy over to nonlinear optical signals using a nonlinear dipole moment time correlation function approach whereby three subsequent laser pulses will be employed at different time intervals to polarize the molecular sample of interest. Starting with the third-order response S^(3)^(t 1,t 2,t 3)^4^
R α represents the nonlinear correlation function, each of which represents the Liouville space pathway, and t 1, t 2, and t 3 are the interaction intervals between the molecular sample and the radiation field. Using the fact that the correlation function is invariant under time translation, the correlation functions {R α(t 1,t 2,t 3)}α=1 ^4^ are given by?
where the 4-point electronic transition dipole moment time correlation function F(τ_1_,τ_2_,τ_3_,τ_4_) in the Heisenberg picture reads
Invoking the Condon approximation, eq becomes
Evaluating the trace over excitonic, nuclear, and bath degrees of freedom yields
with
Now that an expression of F(τ_1_,τ_2_,τ_3_,τ_4_) is developed at various time intervals for a complex dimer with excitonic and electron–phonon couplings, one can readily find any of {R α(t 1,t 2,t 3)}α=1 ^4^ with the aid of eq. This will allow the calculation of all nonlinear optical signals, of which examples are provided below.
For example, define the echo response function as
whereby the optical stimulated photon echo signal (SPE), assuming impulsive (infinitely short) laser pulses, can be calculated using eqs–?
where τ′ is the delay time between the first and second pulses and τ is the delay between the second and third pulses. The SPE signal is one of the tools for probing echo peak shift, which measures the strength of electron–phonon coupling. While governs the homogeneous dynamical contribution to the dephasing, χ(t 3– t 1) governs the static inhomogeneous static part. Another example is the integrated signal of the impulsive 2-pulse echo (IPE)
whereas the time-resolved IPE signal is
eqs–? play a central role in finding nonlinear signals. Figure utilizes the spectral density in eq to calculate time-resolved 2-PE signal (top panel) using eq, integrated 2-PE signal (middle panel) using eq, and the corresponding homogeneous absorption spectrum (bottom panel) with the following parameters: Γ_ZPL_ = 3 cm^–1^, T = 2 K, γ* j
- = 20 cm^–1^, σ_ j _ = 4 cm^–1^, ω_ j _ = 60 cm^–1^, and S _ j _ = 0.50. All calculations reported herein will have an inhomogeneous broadening Δ ∼ 107cm^–1^. Figure demonstrates the intimate relationship between the spectral density shape, width, and symmetry of those of both 1-phonon profile (0–1 transition) and fundamental quantum beat (labeled Beat1), thereby showing how asymmetry of the bath spectral density C(ω) manifests itself in PSB shape and phonon relaxation of the system at hand. Similarly, the 0–2 transition and Beat 2 are asymmetric as well. Figure runs the same calculation using the same parameters as in Figure but using a symmetric (Lorentzian) spectral density for contrast purposes, except the phonon Lorentzian damping was set γ_ j _ = 10 cm^–1^ for more conspicuous results. The ZPL intensity has been chopped off for better clarity of the phonon profiles. Clearly, both the 0–1 transition and Beat1 appear symmetric, as do the 0–2 transition and Beat 2; this symmetry is ascribed to the employed symmetric spectral density.
*Time-resolved 2-pulse photon echo (PE) (top panel), its integrated signal (middle panel), and corresponding absorption spectrum (bottom panel) of a model system calculated with the parameters ΓZPL = 3 cm–1, T = 2 K, Δ ∼ 107 cm–1, γ j = 20 cm–1, σ j = 4 cm–1, ω j = 60 cm–1, and S
j = 0.50 to show how PSB asymmetry manifests itself in quantum beats and phonon profiles.*
*Time-resolved 2-pulse photon echo (PE) (top panel), its integrated signal (middle panel), and corresponding absorption spectrum (bottom panel) of a model system calculated with the parameters ΓZPL = 3 cm–1, T = 2 K, Δ ∼ 107 cm–1, γ j = 10 cm–1, ω j = 60 cm–1, and S
j = 0.50 with Lorentzian (symmetric) spectral density, causing both 0–1 transition and Beat1 to appear perfectly symmetric, as do 0–2 transition and Beat 2. The ZPL intensity has been cut off for a better clarity of the phonon profiles, unlike those in Figure .*
Hole-burning signal can also be calculated using eqs–? as?
where ω_B_ is the burn frequency and ω_L_ is the light frequency. A final example of a spectral signal that may be calculated using eqs–? is the impulsive pump probe signal?
Taking into account the above, one can see how HSF or that of Jankowiak et al.? (both expressions represent eigenstate expansion) would not lend themselves to use in computing any of the nonlinear electronic transition dipole moment time correlation function except for hole-burning or fluorescence line narrowing spectra for a very limited number of modes, thereby reflecting the utility, feasibility, and efficiency of eqs and ? in calculating the above nonlinear signals. Although those of HSF and Jankowiak et al.? do not offer the capability to compute any of these nonlinear signals in the time domain, eqs and ? may readily be utilized to perform these calculations using nonlinear optical response theory, vide supra.
Calculations and Discussion
IV
The local structural heterogeneity in the surrounding environment exhibits variation from one system to another. This structural heterogeneity hides the rich homogeneous structure of the chromophore. For this reason, one must resort to nonlinear optical experiments in order to reveal this hidden structure by unmasking it. While this heterogeneous structure manifests itself in frequency-domain experiments as static inhomogeneous spectral broadening (line width), it shows up as inhomogeneous dephasing time in temporal signals such as photon echo, in which inhomogeneous broadening proportional to the width of the free induction decay component of a photon echo signal and its integrated function. This Section will provide calculations of one of the nonlinear optical techniques that eliminate inhomogeneous broadening, namely 2-pulse photon echo signal for model and real systems using eqs–?. Each photon echo signal will be followed by the corresponding linear homogeneous absorption spectrum to ratify its applicability and successful unmasking of the homogeneous vibrational structure.
The calculation presented in this Section will utilize the parameters that commonly arise in photosynthetic monomeric units, where the pigment–pigment interaction is too weak to be considered, as opposed to the exciton–phonon coupling strength, to demonstrate the accuracy and applicability of eqs–?. The subsequent calculations will involve photosynthetic dimeric complexes in which excitonic (pigment–pigment) coupling is finite and hence non-negligible as in Rps. virides bacterial RC. The forthcoming time-resolved 2-pulse photon echo signals will be computed using eq, whereas the integrated photon echo signals will be calculated using eq. However, the calculations will start with a time-resolved 2-pulse photon echo (PE) signal from a trial model system for illustrative purposes in which the following parameters are used in to calculate Figure: frequency mode j ω_ j _ = 60 cm^–1^, S _ j _ = 0.6, γ_ j _ = 10 cm^–1^ (for the Lorentzian distribution of phonons), and σ_ j _ = 3.5 cm^–1^ (for the Gaussian distribution of phonons) with a width for the ZPL Γ_ZPL_ = 3 cm^–1^ due to the electronic decay time of 1.77 ps at 1 K. Figure and the forthcoming PE signal calculations will employ an inhomogeneous broadening Δ ∼ 107 cm^–1^. Furthermore, Figure will be supplemented with the corresponding linear homogeneous absorption line shape in Figure to ratify the structure of the time-resolved PE signal of the above systems,. Figure shows that the PE signal starts with a strong free induction decay (as echo signals normally do) followed by quantum beats, each of which carries an asymmetric decay (made of a mixture of exponential and Gaussian decays, the width of each is stated above) and is centered around the period corresponding to ω_ j _, tapering off with a long decaying tail due to the electronic decay (ZPL broadening in frequency domain). This vibronic structure in Figure is composed of electronic decay (ZPL broadening) and quantum beats (asymmetric phonon profiles) appearing in the signal. The free induction decay in the inset of Figure is cut off to better reveal the vibronic quantum beats and electronic decay. While τ signifies the time delay in femtoseconds (fs) between the two ultrashort pulses the foregoing and forthcoming figures, t stands for the observed time, which is also measured in fs. Figure was calculated by taking the Fourier transform of eq using the same parameters as in Figure to show the homogeneous vibrational structure masked beneath the heterogeneous structure of amorphous proteins, thereby ratifying the vibronic structure revealed by the PE in Figure. Figure starts with a sharp peak (ZPL) at 0 cm^–1^ followed by PSB composed of 1-phonon profile (0–1 transition) and 2-phonon profile (0–2 transition) appearing at 60 and 120 cm^–1^, respectively. As such, the first beat in Figure corresponds to 1-phonon profile (0–1 transition) in Figure, whereas the second beat corresponds to 2-phonon profile (0–2 transition), and the long tail in Figure signifies the ZPL in Figure.
*Time-resolved PE signal of a model system calculated with the following parameters: ω j = 60 cm–1, S
j = 0.6, γ j = 10 cm–1 (for half Lorentzian distribution of phonons), T = 1 K, Δ ∼ 107 cm–1, and σ j = 3.5 cm–1 (for the half Gaussian distribution of phonons) with a width for the ZPL ΓZPL = 3 cm–1, caused by the electronic decay of 1.77 ps. The PE signal starts off with a sound free induction decay (FID) followed by quantum beats, each of which carries asymmetric decay (made of a mixture of exponential and Gaussian decays) and is centered at the period corresponding to 2π/ω j , tapering off with a long decaying tail, which reflects the electronic decay (ZPL broadening in frequency domain). The FID in the inset of Figure 4 is cut off to better reveal the vibrational quantum beats and electronic decay. While τ signifies the time delay in femtoseconds (fs) between the two ultrashort pulses, t stands for the observed time, which is also reported in fs. Beat 1, Beat 2, and Beat 3 represent the vibrational structure, and they would correspond progression members. These quantum beats become more pronounced as S increases. The electronic decay signifies electronic dephasing (ZPL width). This decay is long-lived in the low temperature limit.*
Linear homogeneous absorption line shape of the system in Figure , whereby the asymmetric distribution of phonons has been utilized to account for the asymmetric phonon profiles, which manifest themselves as quantum beats in Figure . Beat 1, Beat 2, and Beat 3 in Figure correspond to (0–1), (0–2), and (0–3) transitions, respectively. Note that (0–1), (0–2), and (0–3) transitions, respectively, represent 1-, 2-, and 3-phonon profiles.
Figures and ? show calculations of the PE signal and the shape of homogeneous linear absorption lines, respectively, using parameters commonly found in monomeric pigment–protein complexes,? whereby the asymmetric distribution of protein phonons is accounted for mode j ω_ j _ = 30 cm^–1^, S _ j _ = 0.5, γ_ j _ = 20 cm^–1^ (for the Lorentzian distribution of phonons), and σ_ j _ = 8.5 cm^–1^ (for the Gaussian distribution of phonons) with a width for the ZPL, Γ_ZPL_ = 3 cm^–1^. Figure exhibits the integrated PE signal of Figure to show the quantum beats better, whereas its inset is the integrated PE signal of Figure, both of which reflect a strong free induction decay, whose width is proportional to the measured inhomogeneous dephasing (often called inhomogeneous broadening in frequency domain) followed by a long electronic decay tail. The quantum beat in Figure corresponds to the 1-phonon profile shown in Figure. Figures and ? utilize the parameters Rps. virides bacterial RC (special pair) ?−? ?,? to calculate the PE signal and the corresponding linear homogeneous absorption line shape, whereby the mean frequency mode (ω_ m _ = 30 cm^–1^, S _ m _ = 2.1, and γ_ m _ = 55 cm^–1^) and the marker mode (ω_ sp _ = 145 cm^–1^, S _ sp _ = 1.0, and γ_ sp _ = 50 cm^–1^) are included with the width of Γ_ZPL_ = 3 cm^–1^ due to electronic decay at T = 1 K. The parameters used to compute the absorption spectrum in Figure are taken from the results published in ref [?]. The absorption spectrum in Figure seems to be in a good agreement with that reported by Small et al.? The inset of Figure better shows the decay of free induction and quantum beats on a different scale, reflecting the vibronic structure of the bacterial RC. Figure reveals the integrated PE signal of the photon echo in Figure and its inset, whereby the intensity of the induction decay has been cut off for a better beat appearance. The prominent feature of the inset in Figure is the close similarity between the quantum beats of the Bacterial RC and the phononic structure, both of which reflect the vibrational structure of the two modes present in the RC. This similarity was lucidly explored before? in different systems. Finally, Figure presents calculations of the Rps. virides bacterial RC PE signal at various temperatures using the excitonic coupling V_nm_ ∼ 300 cm^–1^. Evidently, as the temperature increases, the electronic decaying tail (ZPL) diminishes, and the quantum beats (vibrations) wash out in line with FCFs.
*Time-resolved PE signal calculated using parameters commonly found in monomeric pigment–protein complexes, whereby the asymmetric distribution of protein phonons is accounted for mode j ω j = 30 cm–1, S
j = 0.5, Δ ∼ 107 cm–1, γ j = 20 cm–1 (for the Lorentzian distribution of phonons), and σ j = 8.5 cm–1 (for the Gaussian distribution of phonons) with a width for the ZPL ΓZPL = 3 cm–1 at 1 K. The inset reveals the long electronic decaying tail in the time domain, which diminishes at high temperatures.*
Corresponding linear homogeneous absorption spectrum of the monomer of the PE signal in Figure . The ZPL is the sharp peak here and, therefore, has been chopped off in the inset to show the asymmetric phonon sideband better. The quantum beat in Figure corresponds to the 1-phonon profile here.
Integrated PE signal of Figure better shows the quantum beats, whereas its inset is the integrated PE signal is that of Figure , both of which reflect a strong FID, whose width is proportional to the measured inhomogeneous dephasing (often called inhomogeneous broadening in frequency domain) followed by a long electronic decaying tail. The quantum beat in the inset corresponds to the 1-phonon profile in Figure .
*Time-resolved PE signal of Rps. virides bacterial RC special pair calculated using the following parameters: mean frequency mode (ω m = 30 cm–1, S
m = 2.1, and γ m = 55 cm–1) and the marker mode (ω sp = 145 cm–1, S
sp = 1.0, and γ sp = 50 cm–1) are included with the width of ΓZPL = 3 cm–1 due to electronic decay at T = 1 K and Δ ∼ 107 cm–1. The inset better displays the free induction decay and the quantum beats on a different scale, reflecting the vibronic structure of the bacterial RC.*
Corresponding linear homogeneous absorption line shape of Rps. virides bacterial RC special pair. The fundamental transition of each mode is labeled as (0–1) m for ω m = 30 cm–1 and (0–1) sp for ω sp = 145 cm–1, whereas the combination band is not well-resolved.
Integrated PE signal of the photon echo in Figure along with its inset whereby the intensity of the FID has been chopped off for a better appearance of the quantum beats. The prominent feature of the inset is the close similarity between the quantum beats of the Bacterial RC and the phononic structure in Figure , both of which reflect the vibrational structure of the two modes present in the bacterial special pair.
*PE signal of Rps. virides bacterial RC PE signal at various temperatures using the excitonic coupling J
nm ∼ 300 cm–1. Evidently, as the temperature increases, the electronic decaying tail (ZPL broadening) diminishes, and the quantum beats (vibrations) are washed out.*
Computational Methods
V
The equations in Sections and III were coded in Mathematica to calculate the spectra and signals shown in the figures. Each relevant equation used is mentioned in the figure cation and the corresponding text.
Concluding Remarks
VI
This brief article has provided a derivation of the nonlinear electronic transition dipole moment-time correlation function in dimeric complexes, in which the phonon distribution is asymmetric for a multimode system, which distinguishes this work from other works. This work is expansive enough, starting from the time domain, to enable one to compute all nonlinear signals in both frequency- and time-domain while assuming asymmetric phonon distribution for multimode systems. The spectral density of the photosynthetic phonons leads to a phonon-sideband characterized by its asymmetry, caused by the unequal contribution from the photosynthetic phonons (bath) to the low- and high-energy sides of the optical signals. We have also shown that the spectral density manifests its asymmetry explicitly in the 1-phonon profile due to the intimate spectral connection between them, which will reflect in the entire phononic part of the absorption spectrum. This asymmetry is an essential contributing component to the exciton–phonon coupling strength and the phonon frequency distribution, thereby providing flexibility in modeling the degree of asymmetry/symmetry needed for the bath and imparting the capability of fine-tuning the nature of electron–phonon coupling caused by pigment–protein interaction.
Unlike other works,? where only hole-burning and fluorescence line narrowing signals could be calculated for one mode, as including more modes would considerably slow down the computation. Furthermore, while those of HSF and Jankowiak et al.? do not offer the capability to compute any of these nonlinear signals in the time domain, eqs and ? may readily be utilized to perform these calculations using nonlinear optical response theory, as shown in the text. As lucidly mentioned in the Introduction, our work eliminates the discrepancies and deficiencies posed by HSF and offers an alternative framework that exceeds the computational efficiency and spectroscopic probing capabilities of condensed systems. Numerical calculations have been reported to ratify the derivation in this document. These calculations have included linear homogeneous absorption spectra and 2-pulse photon echo signals with parameters of a model system, a monomer, and a dimer. Further, 2-pulse photon echo signals of the bacterial RC Rps. virides at different temperatures have also been reported to test the utility and applicability of this work further. The results are satisfactory, based on the assumptions made at the outset of this work.
The reference list from the paper itself. Each links out to its DOI / PubMed record.
- 1Yang S. J.Arsenault E. A.Orcutt K.Iwai M.Yoneda Y.Fleming G.From antenna to reaction center: Pathways of ultrafast energy and charge transfer in photosystem II Proc. Natl. Acad. Sci. U.S.A.2022119 e 220803311910.1073/pnas.220803311936215463 PMC 9586314 · doi ↗ · pubmed ↗
- 2Arsenault E. A.Schile J. A.Limmer D. T.Fleming G.Vibronic coupling in light-harvesting complex II revisited J. Chem. Phys.202115509610110.1063/5.005647834496581 · doi ↗ · pubmed ↗
- 3Toutounji M.Empirical relaxation function and spectral density for underdamped vibrations at low temperatures J. Chem. Phys.200913009450110.1063/1.308506619275403 · doi ↗ · pubmed ↗
- 4Mukamel, S. Principles Nonlinear Optical Spectroscopy; Oxford University Press: Oxford, 1995.
- 5Toutounji M.Small G. J.Mukamel S.Optical response functions for condensed systems with linear and quadratic electron–vibration coupling J. Chem. Phys.19981097949796010.1063/1.477443 · doi ↗
- 6Hayes J. M.Lyle P. A.Small C. J.A Theory for the Temperature Dependence of Hole-Burned Spectra J. Phys. Chem. A 1994987337734110.1021/j 100081 a 017 · doi ↗
- 7Lyle P. A.Kolaczkowski S. V.Small G. J.Photochemical Hole-Burned Spectra of Protonated and Deuterated Reaction Centers of Rhodobacter sphaeroides J. Phys. Chem. A 1993976924693310.1021/j 100128 a 030 · doi ↗
- 8Reddy N. R. S.Kolaczkowski S. V.Small G. J.Nonphotochemical Hole Burning of the Reaction Center of Rhodopseudomonas viridis J. Phys. Chem. A 1993976934694010.1021/j 100128 a 031 · doi ↗