Phylogenetic and evolutionary insights from 30 newly-assembled Onygenales Mitochondrial Genomes: co-evolution of introns and HEGs shapes mitogenome size variation
Héctor Antônio Assunção Romão, Thalison Rodrigues Moreira, Leonardo Carlos Jeronimo Corvalán, Amanda Alves de Melo-Ximenes, Alexandre Melo Bailão, Clayton Luiz Borges, Renata de Oliveira Dias, Rhewter Nunes

TL;DR
This study expands understanding of fungal mitochondrial genome evolution by analyzing 30 new genomes and showing how introns and HEGs influence genome size.
Contribution
The study provides new insights into the co-evolution of introns and HEGs shaping mitochondrial genome size variation in Onygenales fungi.
Findings
Mitogenomes showed conserved protein-coding content but varied in intron number and genome size.
Phylogenetic signal was significant for gene number and intron abundance.
Intron content and HEG abundance were strongly correlated, supporting coordinated evolution.
Abstract
Mitochondrial genomes (mtDNA) provide valuable resources for investigating fungal evolution; however, comprehensive mitogenomic datasets for Onygenales are still scarce. Here, we assembled and annotated 30 new mitogenomes representing 18 species across five families, substantially expanding the available resources for this order. We tested two evolutionary hypotheses: (1) that structural features of mitochondrial genomes are phylogenetically conserved and (2) that introns and homing endonuclease genes (HEGs) have co-evolved and contributed to genome size variation. All mitogenomes exhibited conserved protein-coding content, but showed considerable variation in intron number and genome size. Phylogenetic signal was significant for multiple traits, including gene number and intron abundance. Furthermore, phylogenetic regression analyses revealed a strong correlation between intron content…
Genes, proteins, chemicals, diseases, species, mutations and cell lines named across the full text — each resolved to its canonical identifier and authoritative record.
Click any figure to enlarge with its caption.
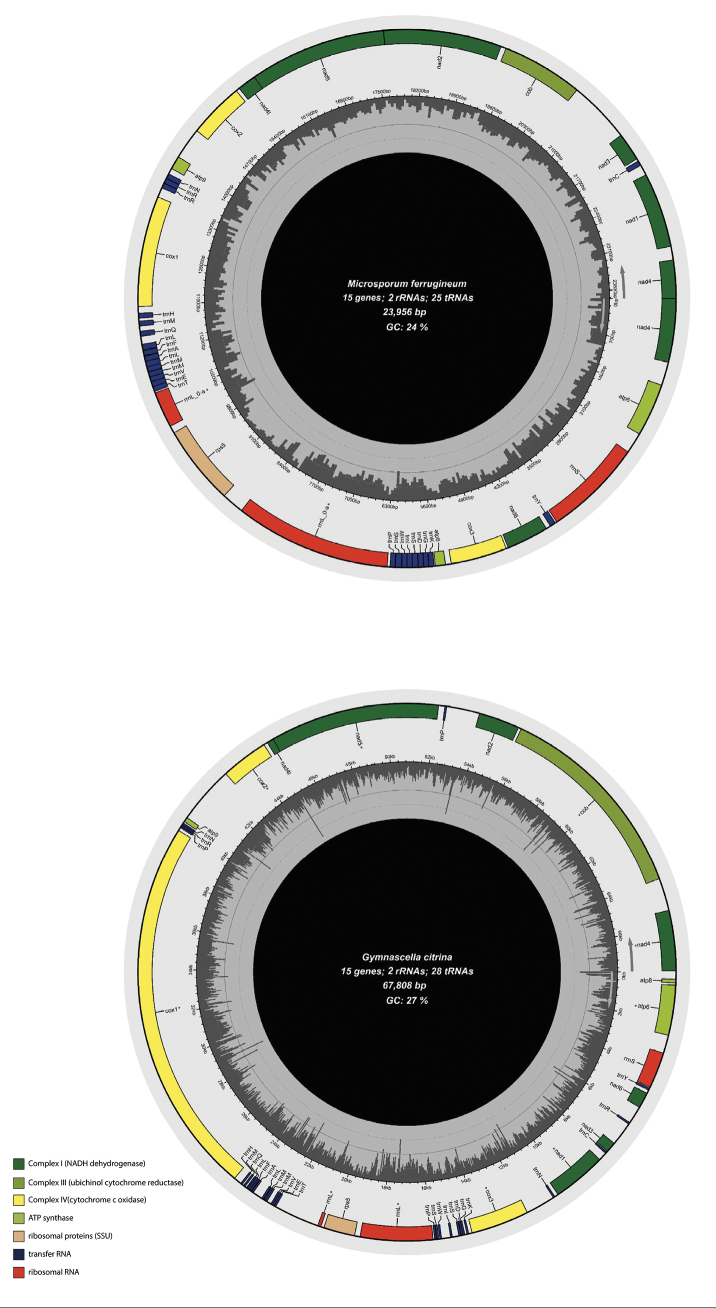 Figure 1
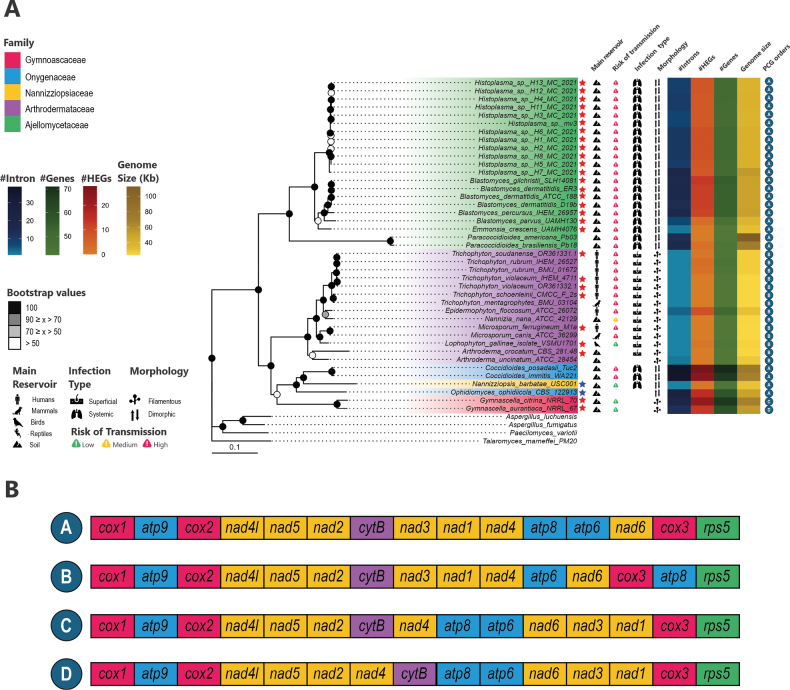 Figure 2
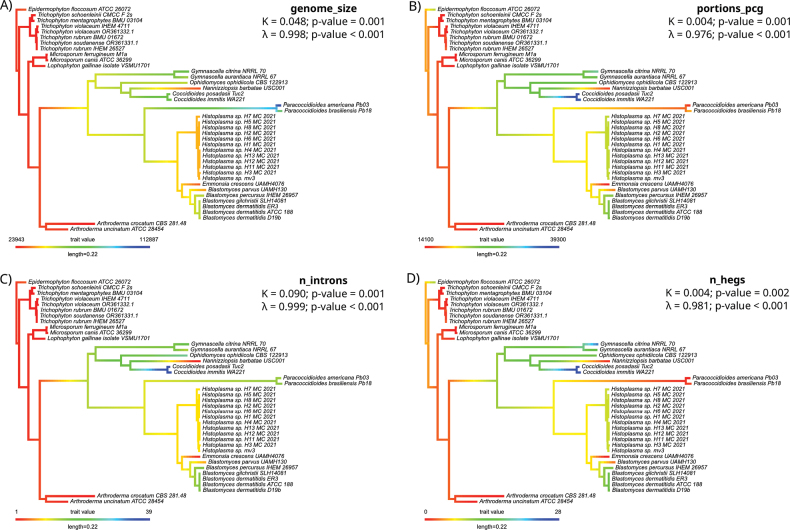 Figure 3
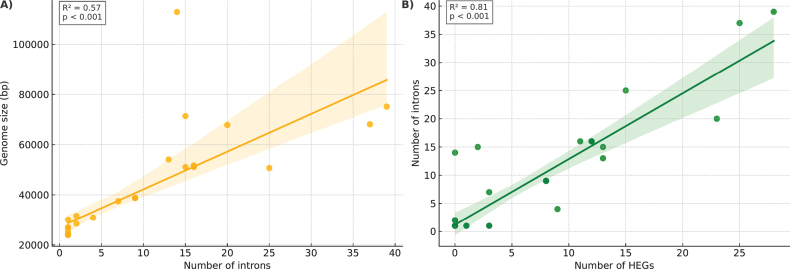 Figure 4
- —Conselho Nacional de Desenvolvimento Científico e Tecnológico 501100003593 https://ror.org/03swz6y49 http://doi.org/10.13039/501100003593
- —Fundação de Amparo à Pesquisa do Estado de Goiás 501100005285 https://ror.org/00w8cq239 http://doi.org/10.13039/501100005285
Peer Reviews
No public reviews on file for this paper yet. If you reviewed it on a platform where reviews are public (OpenReview, ICLR, NeurIPS, ICML), you can paste yours below so the community can read it here.
Videos
No videos yet. Explain this paper in a talk, walkthrough, or lecture? Add one.
Taxonomy
TopicsGenomics and Phylogenetic Studies · Mycorrhizal Fungi and Plant Interactions · Plant Pathogens and Fungal Diseases
Introduction
The order Onygenales encompasses a phylogenetically diverse assemblage of species occupying a broad range of ecological niches, including saprophytic, entomopathogenic and mammalian-associated environments. These taxa exhibit a wide range of adaptive strategies, including osmophily, thermophily, cellulolytic and keratinolytic capabilities, as well as trophic preferences spanning eutrophic and oligotrophic conditions, alongside thermal dimorphism (Kandemir et al. 2022). This remarkable diversity of morphological, ecological and physiological traits exhibited by this group presents significant challenges to taxonomic identification, complicates phylogenetic reconstruction and highlights the need to elucidate the genetic mechanisms underlying their adaptation and diversification.
Mitochondria, ubiquitous organelles found in nearly all eukaryotic cells, play a pivotal role in cellular energy production and various metabolic processes (Herst et al. 2017). These organelles are crucial for ATP production through oxidative phosphorylation and are essential in the biosynthesis of macromolecules, including nucleotides, lipids, heme and iron-sulphur clusters (Vakifahmetoglu-Norberg et al. 2017). Fungal mitochondrial genomes typically encode 15 proteins that are essential for cellular respiration, ribosomal RNA genes, 20 to 30 tRNAs, non-coding regions and mobile elements, such as introns and homing endonuclease genes (HEGs) (Aguileta et al. 2014; Sandor et al. 2018; Fonseca et al. 2020). The variation in the presence and number of these elements can significantly impact genome architecture and evolutionary patterns. The use of mitochondrial genomic data for phylogenetic studies in fungi is not novel, as it has been successfully employed to investigate evolutionary relationships within the order Onygenales (Teixeira et al. 2021). While mitogenomes effectively resolved species-level relationships in this group, they proved insufficient for delineating intraspecific dynamics within the Coccidioides genus. Similarly, in Eurotiomycetes, mitochondrial protein-coding genes yielded well-supported topologies for Eurotiales in both Bayesian and Maximum Likelihood analyses (Zhang et al. 2024). Collectively, these studies underscore the utility of mitogenomes as a valuable resource for resolving intraordinal phylogenetic relationships. Furthermore, recent studies, such as Megarioti and Kouvelis (2020), have proposed that introns and HEGs may co-evolve and that this functional association contributes to mitochondrial genome expansion in fungi. However, this hypothesis was based on only four Onygenales mitogenomes, limiting its generalisability within the order. This study addresses this gap by assembling, curating and comparatively analysing 30 mitochondrial genomes from this fungal order. The objective is to identify the factors that shape mitochondrial genome evolution and to test hypotheses related to structural conservation and intron–HEG co-evolution.
This extensive array of unique features inherent to fungal mitochondrial genomes provides a valuable framework for comparative genomic analyses. The objective of this study is twofold: (i) to expand and curate the available mitochondrial genomic resources for the Onygenales order by leveraging underexplored public datasets and (ii) to investigate which genomic features have shaped the evolutionary trajectories of mitochondrial genomes within Onygenales.
To guide this investigation, we formulated two complementary evolutionary hypotheses. The first hypothesis focuses on structural conservation and proposes that certain genomic traits (e.g. the number of protein-coding genes and the number of tRNAs) are phylogenetically conserved across Onygenales lineages. This leads to the following questions: Which structural traits exhibit the strongest phylogenetic signal (as measured by Blomberg’s K and Pagel’s λ)? Are these traits conserved across major clades within Onygenales? Is mitochondrial genome size associated with the stability of these structural features?
The second hypothesis addresses functional expansion and postulates that the accumulation of introns and homing endonuclease genes (HEGs) underlies mitochondrial genome expansion in Onygenales. It is hypothesised that these elements have co-evolved in a phylogenetically structured, though evolutionarily labile, pattern. In light of these observations, the central question guiding this study is as follows: Is there a significant correlation between the number of introns and HEGs when phylogenetic relationships are accounted for? Does intron content, HEG abundance or intron-rich regions explain the observed variation in mitochondrial genome size? Additionally, are these traits randomly distributed or do they follow phylogenetically structured patterns across lineages?
Materials and methods
Mitochondrial genome assembly and annotation
The raw Illumina paired-end reads utilised in this study were obtained from the National Center for Biotechnological Information (NCBI) Sequence Read Archive (SRA) database (https://www.ncbi.nlm.nih.gov/sra), in a search performed in March of 2023, retrieving only sequences from species with no complete mitochondrial record in GenBank database (Suppl. material 1). The collected raw data underwent a selection process that prioritised the largest dataset from each strain, based on the total base sizes of the experiments. The mitochondrial genome assembly was performed using NOVOPlasty 4.3.1 software (Dierckxsens et al. 2017), employing both forward and reverse reads. For the beginning of the assembly process, the complete protein-coding sequences (CDS) of the cytochrome oxidase subunit (COX1) gene for the species Trichophytonrubrum (syn. T. kuryangei IHEM 26527) (MW464866.1), Epidermophytonfloccosum (NC_007394.1), Microsporumcanis (NC_012832.1), Coccidioidesposadasii strain Tuc2 (NC_058290.1) and Coccidioidesimmitis strain WA221 (NC_058291.1) were used as seed. The sequences utilised for each assembly are described in Suppl. material 2. All the parameters were standardised to k-mer values of 33 and both read and insert sizes were adjusted, based on the dataset in the SRA Experiments database for each species. Following the genome assembly, AWA (Machado et al. 2018) was employed to evaluate the circularisation integrality of the obtained complete genomes. Genomes were classified as correctly circularised if the match score exceeded 95% and had a minimum alignment score of -2. The AWA results for all assemblies are described in Suppl. material 3.
The fungal complete mitogenome was annotated using the MITOS2 web server (Bernt et al. 2013; Donath et al. 2019), according to RefSeq 89 standards. Additionally, the MFannot pipeline (https://megasun.bch.umontreal.ca/apps/mfannot/) was employed to improve the intron boundaries annotation. For both methods, the annotators followed the genetic code for Mold, Protozoan and Coelenterate Mitochondrial (NCBI transl_table=4) for codon usage. Hypothetical open reading frames (ORFs) were identified using the ORF finder tool (https://www.ncbi.nlm.nih.gov/orffinder/). All tRNA gene annotations were refined using tRNAscan-SE 2.0 (Chan and Lowe 2019). In addition, we manually established boundaries of ribosomal genes and determined start and stop codon positions for protein-coding genes (PCGs) using Ugene (Okonechnikov et al. 2012), guided by a sequence alignment against reference genomes retrieved from the RefSeq database. The largest and smallest mitogenomes were selected from the assembled mitochondrial genomes to create graphical representations, plotted using the Chloroplot package version 0.2.4 (Zheng et al. 2020).
Genomic comparison
A comparative analysis was conducted on the 30 new mitochondrial genomes and 11 Onygenales mitogenomes obtained from the NCBI RefSeq database. The sizes of the coding and non-coding regions and the entire mitogenome were quantitatively compared, as were the number of genes, introns and homing endonuclease-like elements. Nucleotide characterisation was also performed by calculating the AT and GC skew according to the formula: AT-skew = (A - T) / (A + T) and GC-skew = (G - C) / (G + C) for the genome and genetic elements.
To identify the mutation hotspots, the complete sequences of the 15 protein-coding genes (CDS) were extracted from the 41 Onygenales genomes analysed and then individually aligned using the multiple sequence aligner MAFFT v.7 (Katoh and Standley 2013). The aligned CDSs were concatenated using SequenceMatrix (Vaidya et al. 2011). The degree of nucleotide diversity between these sequences was estimated using DnaSP v.6.12.0, of which reports the most diverse regions by analysing the positions in the alignment with greatest polymorphism of nucleotide composition (Rozas et al. 2017) and then graphically visualised using the ggplot2 package in R.
Phylogenetic analysis
The 41 Onygenales mitogenomes and four outgroup species from the order Eurotiales, namely Aspergillusfumigatus (NC_017016.1), Aspergillusluchuensis (NC_040166.1), Paecilomycesvariotii (NC_068093.1) and Talaromycesmarneffei (NC_005256.1), were used in the phylogenetic analysis. The amino-acid sequences of the PCGs were collected and individually aligned using MAFFT v.7 under the L-INS-i strategy (Katoh and Standley 2013). The amino-acid alignment was then used as a guide for codon alignment using the Pal2Nal v. 14 software (Suyama et al. 2006). Subsequently, all non-informative positions were removed from the codon alignments using trimAL v.1.4 with the -automated1 option (Capella-Gutiérrez et al. 2009). The resulting PCG codon alignments were finally concatenated using the catfasta2phyml script (https://github.com/nylander/catfasta2phyml).
Phylogenetic reconstruction was performed by Maximum Likelihood using the IQtree v. 1.6.12 software with 1,000 bootstrap replicates (Nguyen et al. 2015). To determine the most suitable nucleotide substitution model, we used the built-in ModelFinder parameter (Kalyaanamoorthy et al. 2017). The biological information related to host, morphology and infection was researched from scientific publications as listed in Suppl. material 4. The tree topology, genomic composition and this biological feature of the species were visualised using the ggtree package available in R (Yu et al. 2017).
Comparative phylogenetic analyses
The phylogenetic signal in mitochondrial genome traits was evaluated using Blomberg’s K (Blomberg et al. 2003) and Pagel’s λ (Pagel 1999), applying both statistics to a mitochondrial phylogeny of Onygenales. Analyses were conducted in R using the packages phytools (Revell 2012), picante (Kembel et al. 2010) and geiger (Pennell et al. 2014). The traits analysed included total mitochondrial genome size (genome_size), number of protein-coding genes (n_pcg), number of tRNAs (n_trna), number of rRNAs (n_rrna), number of total genes (n_genes), number of introns (n_introns), number of homing endonuclease genes (n_hegs) and the following genomic proportions: coding portion, non-coding portion, portion of protein-coding regions (portion_pcg), portion of tRNAs (portion_trna), portion of rRNAs (portion_rrna) and portion of intronic regions (portion_intron). These values were derived using a custom Python script that parses annotated GenBank files using Biopython libraries (Bio.SeqIO, Bio.SeqUtils, pandas). The script systematically iterates over GenBank entries, categorising annotated features by type (e.g. CDS, tRNA, rRNA, intron) and sums their lengths. The non-coding portion was calculated as the remainder of the genome not annotated as any of the above features.
To assess the evolutionary relationships amongst the aforementioned traits, we performed Phylogenetic Generalised Least Squares (PGLS) regressions using the caper package (Orme et al. 2013), incorporating the phylogenetic co-variance structure derived from the mitogenome tree. PGLS regressions were used to test associations between structural traits of the mitochondrial genomes while accounting for phylogenetic relatedness. In each model, one trait was specified as the response variable and another as the predictor. For example, genome size was modelled as a function of the number of introns and the number of introns was modelled as a function of the number of homing endonuclease genes (HEGs). All PGLS models were fitted using the caper package in R and Pagel’s λ was estimated via Maximum Likelihood for each regression. This approach allows the residual error structure to reflect the degree of phylogenetic signal in the traits being modelled. R² values and p-values for each model are reported in the respective figure panels to indicate model fit and statistical significance. In addition, we applied Mantel tests to evaluate the correlation between pairwise phylogenetic distances (co-phenetic matrix) and trait-based Euclidean distances, using the vegan package (Oksanen et al. 2022). Prior to analysis, all trait values were standardised and traits with zero variance were excluded. Standardisation of trait values prior to multivariate analyses was conducted to homogenise scales and variances across different genomic metrics. This prevents dominance of high-magnitude traits and ensures balanced contributions to distance calculations and ordination axes. For Mantel tests, Euclidean distance matrices were constructed, based on standardised (z-score transformed) trait values across species. The distance matrix reflects a multivariate comparison of all traits considered and was compared against patristic distances extracted from the mitochondrial tree using the ape package in R. Detailed results of phylogenetic signal, PGLS regressions and Mantel tests are provided in Suppl. material 9.
Gene selection and mitochondrial gene re-arrangements
The selective pressure for each PCG was calculated using the ratio of non-synonymous mutations (Dn) to synonymous mutations (Ds), such that ω = Dn/Ds. This ratio indicates positive selection when ω > 1, negative selection when ω < 1 and neutrality when ω = 1. The same dataset used in the phylogenetic analysis was used for this analysis, except by the outgroup. The ω was calculated using the null model considering the phylogenetic tree (runmode = 0; model = 0; NSsites = 0) and for the paired relationships using only the null model (runmode = − 2; model = 0; NSsites = 0), both using the PAML 4.9 software (Yang 2007).
Due to the variation in gene numbers, only protein-coding genes were used to analyse gene re-arrangements amongst the 41 Onygenales mitochondrial genomes using TreeRex v.1.85 (Bernt et al. 2008). The software was then employed to identify the ancestral gene order and the transposition, inverse transposition, inversion and tandem duplication random loss (TDRL) using the 15 protein-coding genes conserved in all the genomes.
Results
The characteristics of the 30 newly-assembled Onygenales mitogenomes
The complete circular mitochondrial genome of 30 unprecedented representatives of Onygenales was obtained. These mitogenomes included two species that other groups had assembled, but we did not find a reference annotation in the NCBI database. The assemblies ranged from 23,956 (Microsporumcanis strain ATCC 36299) to 67,808 bp (Gymnascellacitrina strain NRRL 5970) and their GC content varied from 23 to 27% (Fig. 1). Quantitative aspects of the 41 Onygenales mitogenomes analysed in this work are described in Suppl. material 5. The data collected includes 18 species: Blastomycesdermatitidis (3 strains), Blastomycesgilchristii, Blastomycesparvus, Blastomycespercursus, Emmonsiacrescens, Gymnascellaaurantiaca NRRL 5967, Gymnascellacitrina NRRL 5970, Histoplasma sp. (12 strains), Lophophytongallinae (syn. Microsporum vanbreuseghemii), Microsporumferrugineum (syn. Trichophytonferrugineum), Nannizziopsisbarbatae, Arthrodermacrocatum (syn. Onygenacorvina), Ophidiomycesophidiicola, Trichophytonschoenleinii, Trichophytonsoudanense and Trichophytonviolaceum (syn. T.yaoundei). All mitogenomes showed a conserved gene composition with 15 PCGs, two rRNAs and 22 to 26 tRNAs, except for G.citrina and G.aurantiaca, which showed 28 and 29 tRNAs, respectively.
Comparative schematic maps of the assembled mitochondrial genomes of Microsporumferrugineum (shortest assembled mitogenome) and Gymnascellacitrina (largest assembled mitogenome). The central graphical panel displays GC content distribution across both mitogenomes, with a concentric circle indicating the 50% compositional baseline. Annotated structural features include asterisks () denoting intron-containing genes.*
The frequency of introns and open reading frames (ORF) related to putative HE elements within the newly-assembled mitogenomes also varied amongst species, ranging from 1–25 and 1–23, respectively (Suppl. material 3). The predicted intronic elements harbour completed or truncated ORFs, which are highly similar to homing endonucleases (HEG) of the LD and GIY families. The mitogenome nucleotide characterisation revealed a high bias towards the presence of A and T nucleotides, with values ranging from 72.96% in Gymnascellacitrina strain NRRL 5970 to 80.84% in Paracoccidioidesamericana strain Pb03 (Suppl. material 6).
Genomic comparison amongst the newly- and previously-assembled Onygenales mitogenomes
The length of all 41 Onygenales mitochondrial genomes analysed ranged from 112,887 bp (Paracoccidioidesamericana strain Pb03) to 23,943 bp (Microsporumcanis strain ATCC 36299), both previously published (Wu et al. 2009; Misas et al. 2020). Amongst the five families analysed, the family Gymnoascaceae has the largest average length (60,950 ± 12,568.42 bp), considering only one representative genome per species (Suppl. material 7). The family Ajellomycetaceae has the most variable genome length (56,088.13 ± 25,880.74 bp), ranging from 31,579 bp (Emmonsiacrescens strain UAMH4076) to 112,887 bp (Paracoccidioidesamericana). A similar pattern was observed for intron total length, with the family Onygenaceae exhibiting the largest average (43,213.33 ± 10,432.96 bp) and Ajellomycetaceae the most variable size (27,286.12 ± 24,630.23 bp).
The mitogenomes coding portion (PCG + tRNA + rRNA) showed no variation in number of genes and length for the PCG and rRNA and a variation of the number of tRNAs ranging from 25 to 28 (Suppl. material 5). The intron size and the non-coding portion showed high variation in their length, providing evidence for their association with genome size. The mitogenomes were also characterised by a high AT content in all parts of the genome, with values greater than 70% (Suppl. material 6). Amongst the genomic regions, only tRNA and rRNA showed AT content values lower than 70%, although these values did not go below 60%.
Mitochondrial gene re-arrangements
We evaluate re-arrangements in the PCG order, as all these genes are located on the same DNA strand. Amongst the four types of gene re-arrangements (transposition, inverse transposition, inversion tandem duplication random loss), only transpositions were observed in Onygenales (Fig. 2B). This resulted in identifying four distinct PCG orders (Fig. 2B), with the A conformation shared by families Ajellomycetaceae, Onygenaceae and Nannizziopsiaceae. The Arthrodermataceae family underwent a transposition involving ATP8 and ATP6-NAD6-COX3, resulting in conformation B. The family Gymnoascaceae exhibited two different conformations, labelled as conformation C and D. Our results yielded consistent confidence values for all nodes, except the Onygenales rooted node and the Gymnascella genera node.
Onygenales phylogenetic proposition and its mitogenome conservation. A. Maximum Likelihood phylogenetic proposition using the codon alignment of the 15 mitochondrial PCGs. The number on the nodes represents the bootstrap values for 1,000 replicates. Each species possible hosts (general mammals - dog icon, humans - human icon, birds - bird icon, reptiles - lizard icon and soil - mountain icon), infection (cutaneous - skin icon or pulmonary/disseminated - lungs icon), morphology type are described using icons and risk of transmission from natural reservoirs are described using icons. The red stars mark the novel mitogenomes assembled herein and the blue stars mark the genomes assembled by Ladner et al. (2022) and Powell et al. (2023), which were also re-assembled and re-annotated in the present study; B. Synteny analysis of the 15 mitochondrial protein-coding genes (PCGs) identifies four distinct genomic configurations amongst the studied species. Colour-coded annotations demarcate the category of the genes as follows: red boxes correspond to genes encoding components of Complex IV (cytochrome c oxidase), blue to Complex V (ATP synthase), yellow to Complex I (NADH dehydrogenase), purple to Complex III (ubiquinol-cytochrome c reductase) and green to ribosomal protein genes.
Onygenales phylogenetic proposition
The Maximum Likelihood phylogenetic tree proposed using the mitochondrial PCGs dataset recovered the monophyly of the Ajellomycetaceae and Gymnoascaceae families (Fig. 2A), with both branches receiving 100% bootstrap support. Notably, within the Ajellomycetaceae family, the Paracoccidioides branch yielded a branch length of 0.21.
The Arthrodermataceae family was included in a clade with Onygenacorvina strain CBS 281.48 (Onygenaceae). However, we hypothesise that the SRA data (NCBI Accession: SRR1705618) used to assemble this genome may be misidentified, as other studies have already described NCBI data annotated as Onygenacorvina that are, in fact, from Arthrodermacrocatum (Kandemir et al. 2022). Fungal species misidentification in public databases seems to be a common event, as can be exemplified by the NCBI Reference Sequence: NC_012830.1, which has the description as: Arthrodermaobtusum ATCC 42129, which is not accepted as the current name is described as Nannizzianana. Our analysis further confirms the representation as N.nana, as this species is grouped as the sister group of Epidermophytonfloccosum ATCC 26072 (as seen in Kandemir et al. (2022) and is distant from the other Arthroderma species.
A non-monophyletic clade containing three species from the Onygenaceae family (Coccidioidesimmitis, Coccidioidesposadasii and Ophidiomycesophiodiicola) and one species from the Nannizziopsiaceae family (Nannizziopsisbarbatae) was also recovered. Of particular interest is the observation that this clade grouped two species from different families that have reptiles as hosts and that have the same morphology (Yeast), O.ophiodiicola and N.barbatae, as sister species. The family Nannizziopsiaceae has previously been described as forming a cluster within Onygenaceae, thus representing a possible group of Onygenaceae rather than a separate family (Kandemir et al. 2022).
The analysis of the biological information within the phylogenetic tree reveals a relationship between the infectiousness and the species’ evolutionary development, as the inner groups showed a wider range of hosts, including humans as susceptible hosts. Similarly, the morphological type of the species is also in line with the evolutionary landscape. For instance, the dimorphic morphology has been described exclusively in the family Ajellomycetaceae and the genus Coccidioides, which is part of the family Onygenaceae.
The heat maps describing the genetic composition of the genomes indicate a phylogenetic signal in these characteristics, as closely-related species tend to resemble each other. The phylogenetic clusters have species with similar genetic patterns, such as the number of introns, HEGs and genes. However, the species of the genus Paracoccidioides constitute an exception to this pattern, as their large number of introns is not accomplished by a large number of HEGs in the genome. However, it is hypothesised that this discrepancy may be attributed to a misannotation issue. This assertion is supported by the observation that six ORFs were identified in the P.brasiliensis strain Pb18 and four ORFs were identified in the Paracoccidioidesamericana strain Pb03, both of which were not previously annotated in the NCBI genome database. These ORFs exhibited a relative similarity to elements previously identified in other fungal organisms (Suppl. material 8).
Onygenales mitochondrial genome evolution patterns
We analysed 13 structural traits from the mitochondrial genomes of 41 Onygenales species, including total genome size, gene counts (PCGs, tRNAs, rRNAs), intron and HEG numbers and genomic proportions (coding, non-coding and intronic regions). Phylogenetic signal analyses revealed that genome size, total gene number, intron number, HEG number and intronic proportion exhibited significant phylogenetic structure. Values of Blomberg’s K and Pagel’s λ were significantly greater than zero and often near one, indicating a moderate to strong phylogenetic signal with some evolutionary lability (Fig. 3).
Phylogenetic distribution of mitogenomic traits across Onygenales species. A. Mitochondrial genome size; B. Proportion of protein-coding bases; C. Number of introns; D. Number of homing endonuclease genes (HEGs). Trait values are mapped on to the species tree using a heat-map gradient, revealing lineage-specific trends and phylogenetic structuring in mitochondrial genome architecture.
Phylogenetic Generalised Least Squares (PGLS) regressions revealed a strong and significant positive correlation between intron count and HEG number (R² = 0.64, p < 0.001), providing statistical support for a hypothesis of coordinated evolution between these two genomic features (Fig. 4). In addition, both the proportion of intronic regions and the number of HEGs exhibited a significant correlation with total mitochondrial genome size, suggesting that these components are major contributors to genome expansion in Onygenales.
Correlation between intron number and HEG abundance in Onygenales mitogenomes. A. Scatterplot showing the relationship between the number of introns and number of HEGs, with regression line and confidence interval estimated via Phylogenetic Generalised Least Squares (PGLS); B. Statistical summary of the regression model, including coefficient of determination (R²) and p-value, indicating significant positive correlation and supporting the hypothesis of intron–HEG co-evolution as a driver of mitogenome expansion.
The Mantel test, comparing phylogenetic distances with Euclidean distances, based on trait data, yielded a significant result (p = 0.004), indicating that closely-related species tend to share similar mitogenomic structural profiles. This supports the hypothesis that mitochondrial genomic architecture is non-randomly distributed and phylogenetically structured. Notably, exceptions to these patterns were found in the genus Paracoccidioides, which harbours large mitochondrial genomes with high intron content, but relatively few annotated HEGs.
Nucleotide diversity and gene selection
The mean nucleotide diversity value of all 15 PCGs for the 41 Onygenales mitogenomes analysed in this work was 0.140, ranging from 0.059 to 0.325 (Suppl. material 10). Two PCGs showed nucleotide diversity values higher than twice the median value of the overall diversity: NAD6 and RPS5 (Suppl. material 10). Furthermore, the omega (ratio of non-synonymous per synonymous substitutions) values of all PCGs ranged from 0.022 (NAD4l) to 0.0904 (RPS5), indicating an overall pattern of negative selection (Suppl. material 10).
Discussion
This study contributes to the expansion of the mitochondrial genomic landscape of Onygenales by providing 30 newly-assembled mitogenomes and applying comparative phylogenetic approaches to test two central hypotheses: (1) that structural traits of fungal mitogenomes are phylogenetically conserved within the order and (2) that introns and homing endonuclease genes (HEGs) have co-evolved, driving mitochondrial genome expansion in Onygenales.
Our analyses revealed strong phylogenetic signals for several mitogenomic traits, including total genome size, gene number, intron count, HEG abundance and the proportion of intronic regions. These findings support the hypothesis that certain genomic features are phylogenetically conserved across Onygenales. Blomberg’s K and Pagel’s λ values consistently indicated that closely-related species share similar mitogenomic architectures. This finding suggests that evolutionary history plays a central role in shaping mitochondrial genome composition. Importantly, the Mantel test further confirmed that species with lower phylogenetic distances exhibit greater overall genomic similarity (p = 0.004), thereby reinforcing the presence of phylogenetically structured variation. A similar set of results has been reported in other fungal groups, such as Eurotiales and Hypocreales (Aguileta et al. 2014; Korovesi et al. 2018). In these cases, the conservation of gene content and organisation was observed within families.
The stability of protein-coding gene content across the 41 Onygenales mitogenomes analysed here, including the presence of 15 core PCGs and two rRNAs, reflects a conserved mitochondrial core function essential for oxidative phosphorylation and metabolic regulation (Herst et al. 2017; Fonseca et al. 2020). However, variation in non-coding and intronic regions was substantial and this variation was not randomly distributed, but instead reflected phylogenetic structure. For instance, the Gymnoascaceae family showed the highest intron and HEG counts, while the Ajellomycetaceae family exhibited the widest range of genome sizes, suggesting lineage-specific expansions. These results align with earlier work by Burger et al. (2003) and Liu et al. (2020), which emphasised the dynamic nature of fungal mitogenomes, particularly in non-coding regions. Collectively, these results robustly confirm our first hypothesis. We show for the first time in Onygenales that multiple structural features of the mitogenome exhibit statistically significant phylogenetic signals, indicating vertical inheritance and evolutionary constraint.
Our study provides empirical evidence supporting the coordinated evolution of group I introns and their associated homing endonuclease genes (HEGs) in Onygenales, as previously hypothesised in the “aenaon” model proposed by Megarioti and Kouvelis (2020). According to this model, the relationship between introns and HEGs is not merely functional or incidental, but reflects a perpetual and dynamic co-evolution involving recombination, gene fusion and horizontal gene transfer (HGT). These composite elements, self-splicing introns harbouring endonuclease-encoding ORFs, form mobile units that have shaped fungal mitochondrial genome architecture over evolutionary timescales.
In Onygenales, a robust and statistically-significant positive correlation was observed between the number of introns and the number of HEGs (R² = 0.64; p < 0.001), consistent with the premise that HEGs contribute to the retention and spread of introns (Goddard and Burt 1999; Belfort et al. 2002). This pattern persisted even after controlling for phylogenetic relatedness using PGLS, reinforcing the hypothesis of co-evolution rather than coincidental co-occurrence. Moreover, traits, such as genome size and intronic proportion, were tightly linked to both intron and HEG abundance, suggesting that their proliferation has been a major force in mitochondrial genome expansion within this particular fungal order.
Our data resonate with several aspects of the “aenaon” model. Initially, it was determined that HEGs are consistently embedded within intronic loops that do not interfere with catalytic splicing functions, an arrangement that allows cis-acting mobility with minimal host cost (Megarioti and Kouvelis 2020). Secondly, the clear phylogenetic structuring of these traits across Onygenales species, alongside outlier cases (e.g. Paracoccidioides spp.), suggests that episodic intron-HEG invasions have occurred throughout the evolution of Onygenales. This finding is consistent with both “intron-early” and “intron-late” processes described in the mitochondrial history of fungi (Lang et al. 2007; Zubaer et al. 2018).
Notably, the intron types most commonly harbouring HEGs in Onygenales, such as group IB and ID, are also identified in Megarioti and Kouvelis (2020) as ancestral insertion targets, further supporting the hypothesis that these subtypes represent conserved hotspots for composite element integration. The variability we observed in intron and HEG presence across families, especially within Gymnoascaceae and Ajellomycetaceae, suggests that lineage-specific events, including HEG degeneration, intron loss or recombination-mediated re-arrangements, continue to shape mitochondrial genome diversity even within this order. Altogether, these findings provide a compelling validation of our second hypothesis: that introns and HEGs have evolved in a coordinated fashion and act as major contributors to mitogenome expansion in Onygenales. The statistical and comparative evidence presented here places Onygenales within the broader evolutionary framework described by the “aenaon” model.
The mitochondrial phylogeny inferred from protein-coding genes provided a well-supported framework that largely agrees with previous nuclear-based phylogenies for Onygenales (Kandemir et al. 2022). Previous studies have also employed mitogenomes for resolving phylogenetic relationships within Onygenales. However, these investigations were either focused on intraspecific relationships within the Coccidioides genus (Teixeira et al. 2021) or utilised a limited taxonomic sampling of Onygenales representatives (Zhang et al. 2024). In both studies, mtDNA proved effective in delimiting intra-genus relationships, though it failed to provide consistent resolution amongst intraspecific strains of Coccidioides, possibly due the admixture events from hybridisation or interspecies introgression, which was also observed in Paracoccidioides. Notably, mtDNA successfully resolved relationships within the Arthrodermataceae family in Zhang et al. (2024). These findings suggest that mitochondrial genomes hold promise for resolving intra-ordinal phylogenetic relationships, a conclusion further supported by our results using an expanded dataset. Our tree recovered the monophyly of Ajellomycetaceae and Gymnoascaceae with strong bootstrap support, while indicating non-monophyly for Onygenaceae and Arthrodermataceae. Notably, Onygenacorvina (strain CBS 281.48), placed within Arthrodermataceae in our reconstruction, is likely misidentified, making the Arthrodermataceae also monophyletic. Prior studies have revealed inconsistencies in its NCBI assignment, with several sequences labelled as O.corvina later re-assigned to Arthrodermacrocatum (Kandemir et al. 2022). Similarly, Arthrodermaobtusum (NC_012830.1) appears better supported as Nannizzianana, forming a clade with Epidermophytonfloccosum.
These findings reinforce the efficacy of mitogenomic data in identifying taxonomic inconsistencies and refining species-level assignments. The placement of Nannizziopsisbarbatae within Onygenaceae also corroborates previous proposals to subsume Nannizziopsiaceae into Onygenaceae (Stchigel et al. 2013; Kandemir et al. 2022). Interestingly, the close relationship between N.barbatae and Ophidiomycesophiodiicola, both reptile-associated yeast-like fungi, may reflect shared ecological adaptations, though such patterns must be interpreted cautiously given the limited sampling.
The tree topology also highlighted phylogenetic structuring of ecological traits. For instance, dimorphic morphology was restricted to Ajellomycetaceae and Coccidioides, supporting the independent evolution of this trait. The placing anthropophilic and zoophilic Trichophyton species in distinct clades echoes previous nuclear reconstructions (Cornet et al. 2021; Kabtani and Ranque 2023), although the Trichophyton clade has already been presented as a polyphyletic group composed of four species series recognised (A1-4) by molecular studies and expanded sampling of isolated and species, with no determinants of anthropophilic and zoophilic species, of which it should be carefully addressed with updated clinical data for more precise description (de Hoog et al. 2017). Here, a similar structure was also found, with the T.mentagrophytes BMU 03104 clustered with T.schoenleinii CMCC F2S. Furthermore, the Trichophytonsoudanense mitogenome assembled here provides the first mitochondrial resource for this species and shows clear differentiation from T.violaceum and T.rubrum, further validating its species-level status. This highlights the potential of mitochondrial phylogenomic data to resolve complex taxonomic questions, especially when paired with ecological and morphological traits.
By increasing the number of available Onygenales mitogenomes by over 270%, this study provides a foundation for future evolutionary, ecological and molecular investigations in the group. The identification of NAD6 and RPS5 as intron-free, highly variable genes also opens avenues for their use as complementary mitochondrial barcodes, especially given the limitations of COX1 due to extensive intron content (Santamaria et al. 2009; Schoch et al. 2012). The consistent phylogenetic structure exhibited by these traits highlights their utility in evolutionary inferences and species delimitation.
Future studies could further refine the mechanistic understanding of intron and HEG propagation, explore the role of recombination in gene order re-arrangements and assess the ecological correlates of mitogenomic expansion. Furthermore, expanding the taxon sampling, particularly amongst under-represented Onygenales families, will enhance the resolution of phylogenetic and functional inferences.
Conclusions
This study contributes to the expansion of available mitogenomic resources for Onygenales and provides new insights into the evolutionary dynamics of fungal mitochondrial genomes. Our analyses demonstrate that key structural traits, such as gene content, genome size, intron abundance and HEG presence, exhibit significant phylogenetic signals, supporting their evolutionary conservation across lineages. Furthermore, evidence is presented demonstrating that introns and homing endonuclease genes have co-evolved in a correlated manner, contributing to genome size variation, a pattern consistent with the “aenaon” model of intron-HEG co-evolution. In addition, our phylogenetic reconstruction, based on mitochondrial genes, clarified taxonomic inconsistencies and corroborated established ecological and morphological patterns. Collectively, these findings establish a genomic and evolutionary framework for further studies on mitochondrial function, mobility and diversity within Onygenales.
The reference list from the paper itself. Each links out to its DOI / PubMed record.
- 1Aguileta Gde Vienne DM (2014) High variability of mitochondrial gene order among fungi.Genome Biology and Evolution 6: 451–465. 10.1093/gbe/evu 02824504088 PMC 3942027 · doi ↗ · pubmed ↗
- 2Belfort M Derbyshire V (2002) Mobile introns: pathways and proteins. In: Craig NL Craigie R Gellert M Lambowitz AM (Eds) Mobile DNA II.ASM Press, Washington, DC, 761–783.
- 3Bernt M Donath A (2013) MITOS: improved de novo metazoan mitochondrial genome annotation.Molecular Phylogenetics and Evolution 69: 313–319. 10.1016/j.ympev.2012.08.02322982435 · doi ↗ · pubmed ↗
- 4Bernt M Merkle D Middendorf M (2008) An algorithm for inferring mitogenome rearrangements in a phylogenetic tree.Lecture Notes in Computer Science 5267: 143–157. 10.1007/978-3-540-87989-3_11 · doi ↗
- 5Blomberg SP Garland T Ives AR (2003) Testing for phylogenetic signal in comparative data: behavioral traits are more labile.Evolution 57: 717–745. 10.1111/j.0014-3820.2003.tb 00285.x 12778543 · doi ↗ · pubmed ↗
- 6Burger G Gray MW Lang BF (2003) Mitochondrial genomes: anything goes.Trends in Genetics 19: 709–716. 10.1016/j.tig.2003.10.01214642752 · doi ↗ · pubmed ↗
- 7Capella-Gutiérrez S Silla-Martínez JM Gabaldón T (2009) trim Al: a tool for automated alignment trimming in large-scale phylogenetic analyses.Bioinformatics 25: 1972–1973. 10.1093/bioinformatics/btp 34819505945 PMC 2712344 · doi ↗ · pubmed ↗
- 8Chan PP Lowe TM (2019) t RN Ascan-SE: searching for t RNA genes in genomic sequences.Methods in Molecular Biology 1962: 1–14. 10.1007/978-1-4939-9173-0_131020551 PMC 6768409 · doi ↗ · pubmed ↗