Glucose alters the evolutionary response to gentamicin in uropathogenic Escherichia coli
Shalini Choudhary, Jacob A. Smith, Alan McNally, Rebecca J. Hall

TL;DR
Glucose exposure changes how uropathogenic E. coli evolves in response to the antibiotic gentamicin, which could affect UTI treatment in people with diabetes.
Contribution
The study reveals that glucose alters UPEC's evolutionary response to gentamicin, uncovering new mutation patterns and treatment implications.
Findings
Long-term glucose exposure leads to mutations in the rpoS gene in UPEC.
Gentamicin exposure causes mutations in trkH and hyxB genes.
Combining glucose and gentamicin prevents these mutations, suggesting glucose influences survival of gentamicin-resistant mutants.
Abstract
Urinary tract infections (UTI) are a major health and economic concern. Uropathogenic Escherichia coli (UPEC) are the leading cause of UTI, and antibiotic-resistant UPEC are increasingly common. The microenvironment of the urinary tract is metabolically distinct, and there is growing interest in understanding the extent to which metabolism may influence UPEC infection and response to antibiotics, and how this varies between individuals. Diabetes, characterized in part by glycosuria, is a known risk factor for UTI and is associated with more severe infections. The role that glucose plays in driving UPEC evolution remains unclear. Through experimental evolution with a single UPEC isolate, we identified mutations in the RNA polymerase sigma factor rpoS associated with long-term glucose exposure. We found that the presence of the antibiotic gentamicin resulted in mutations in genes…
Genes, proteins, chemicals, diseases, species, mutations and cell lines named across the full text — each resolved to its canonical identifier and authoritative record.
Click any figure to enlarge with its caption.
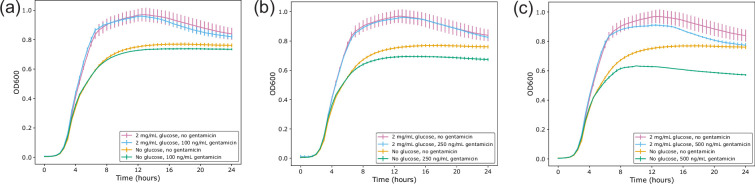 Fig. 1
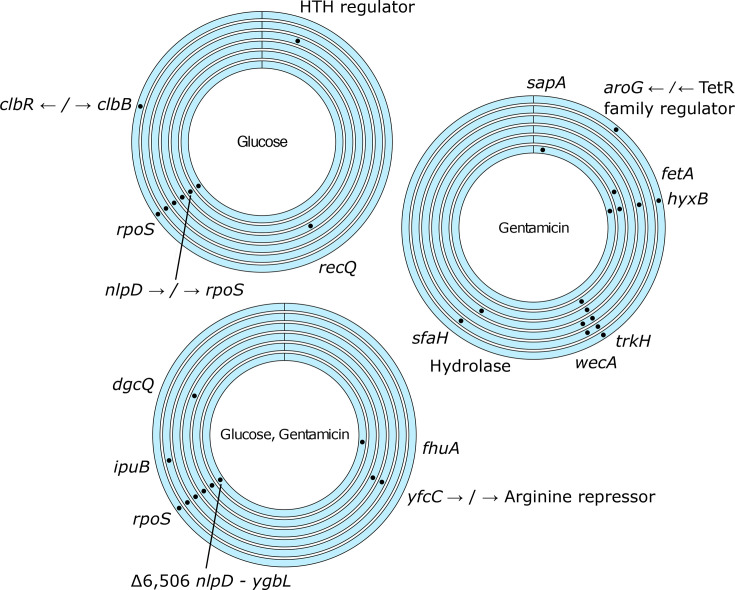 Fig. 2
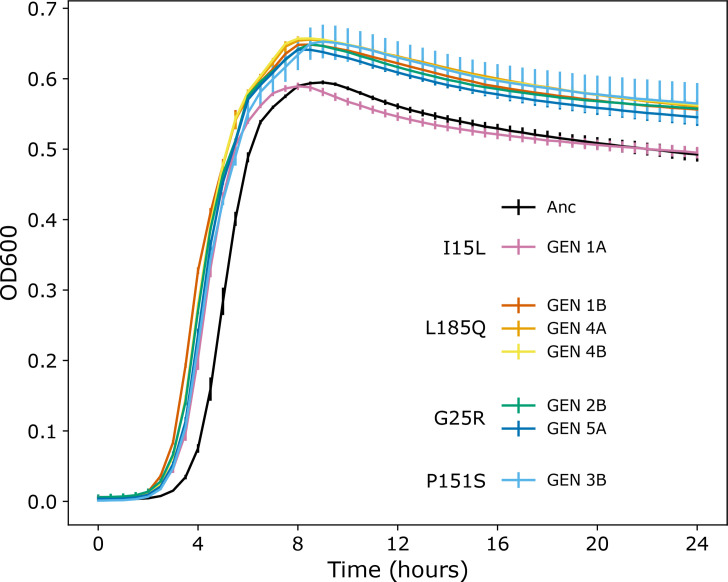 Fig. 3
- —http://dx.doi.org/10.13039/501100000268 Biotechnology and Biological Sciences Research Council
Peer Reviews
No public reviews on file for this paper yet. If you reviewed it on a platform where reviews are public (OpenReview, ICLR, NeurIPS, ICML), you can paste yours below so the community can read it here.
Videos
No videos yet. Explain this paper in a talk, walkthrough, or lecture? Add one.
Taxonomy
TopicsUrinary Tract Infections Management · Gut microbiota and health · Escherichia coli research studies
Data availability
The DNA dataset generated and analysed during the current study is available from NCBI with BioProject accession PRJNA1178604. Individual accession numbers are provided in Table S1, available in the online version of this article.
Introduction
Urinary tract infections (UTI) are a major cause of morbidity and mortality globally [12]. Certain demographics are disproportionately affected, including women and individuals with indwelling catheters or diabetes [36], and recurrent infections are common [3]. UTI are treated by a panel of antibiotics depending on the acuteness and severity of infection, and whether it has progressed to the bloodstream causing urosepsis [78]. Uropathogenic Escherichia coli (UPEC) are the leading cause of UTI, with antibiotic and multidrug-resistant UPEC strains increasingly common [7,911].
While virulence factors are known to contribute to UPEC pathogenicity [2,1214], less is known about the extent to which other genes and pathways influence infection, evolution and antibiotic resistance. The urinary tract is uniquely composed of metabolites including urea, uric acid, ammonia and creatinine, thereby creating a distinct metabolic microenvironment to which UPEC are exposed [1516]. The concentration of glucose in urine can also become elevated (glycosuria, defined as greater than 0.25 mg ml^−1^ [17]) as a result of conditions including diabetes mellitus and gestational diabetes. Genes involved in glucose transport and metabolism have been shown to be important for UPEC colonization of the urinary tract, including ptsG (a component of a glucose-specific phosphotransferase system) and pgi (catalyses the reversible reaction between glucose 6-phosphate and fructose 6-phosphate) [16,1820]. Glucose has also been found to alter virulence gene expression in UPEC strains [21]. Given the increased risk of UTI amongst this demographic [22], it is important to understand the extent to which glucose might influence antibiotic susceptibility or drive the evolution of resistance in UPEC.
Using a clinical UPEC strain, we identified that the presence of glucose reduced the impact on the growth of a sub-inhibitory (25% MIC) concentration of gentamicin, an aminoglycoside used in the UK to treat severe UTI or urosepsis [78]. We then experimentally evolved the UPEC strain in the presence of either glucose, gentamicin or both glucose and gentamicin. Analysis of short read sequences of strains from the evolved populations showed that glucose exposure led to mutations in the RNA polymerase sigma factor rpoS, gentamicin to mutations in the autotransporter hyxB and the potassium ion uptake system trkH. Crucially, no mutations in trkH nor hyxB were identified in the populations that evolved in both glucose and gentamicin. While this study uses only a single UPEC isolate, our data suggest that metabolism may play a role in the treatment and evolution of UPEC-associated UTI.
Methods
Strains and growth conditions
E. coli USVAST002, originally isolated from a human urine sample [23], was used throughout the study. Long and short reads for USVAST002, plus short reads of all evolved strains, are available from NCBI with BioProject accession PRJNA1178604. Individual accession numbers are provided in Table S1. Strains were grown in Luria Bertani (LB) broth (E and O Laboratories) unless specified.
Bacterial growth assays
To measure the potential effect of glucose on antibiotic sensitivity, USVAST002 was first streaked from a glycerol stock onto an LB agar plate and incubated overnight at 37 °C. A single colony was used to inoculate 5 ml LB broth in a 30 ml universal before overnight incubation at 37 °C with 180 r.p.m. agitation. The culture was then diluted 1:1,000 in LB. Two times final concentrations of glucose (2 mg ml^−1^) and gentamicin (500, 250 and 100 ng ml^−1^) were added to LB, 50 µl of which was then added to each test well of a 96-well plate in technical triplicate, followed by 50 µl of the dilute cell suspension to a final volume of 100 µl per well. Glucose- and gentamicin-free conditions were also included. Once candidate evolution concentrations were selected, the assay was repeated with five independent colonies per condition in a fresh batch of LB with a randomized plate layout. Plates were incubated for 24 h in a microplate reader (Tecan) at 37 °C with continuous shaking at 162 r.p.m., with absorbance measurements (OD600) taken every 30 min.
Minimum inhibitory concentration assays
MIC of the ancestral and each of the sequenced evolved strains were estimated in U-bottom 96-well plates [24]. For this, overnight cultures were diluted 1:2,000 in Iso-Sensitest broth (ISB) (Thermo Fisher Scientific) and incubated in triplicate in seven different concentrations of gentamicin ranging from 16 µg ml^−1^ to 250 ng ml^−1^, including a non-antibiotic control. MICs were recorded following an 18 h incubation at 37 °C, with significance considered if results were two doubling dilutions away from the ancestor.
Experimental evolution
The ancestral E. coli USVAST002 isolate was streaked from a glycerol stock onto an LB agar plate and incubated overnight at 37 °C. Microcosms were made in 30 ml universals with 5 ml LB, each inoculated with a single colony from the ancestor plate. There were six independent biological replicates per condition: LB no antibiotic (henceforth ‘control’); LB+2 mg ml^−1^ added glucose (‘Glc’); LB+500 ng ml^−1^ gentamicin (‘GEN’); LB+2 mg ml^−1^ glucose+500 ng ml^−1^ gentamicin (‘Glc+GEN’). Microcosms were incubated for 24 h at 37 °C with 180 r.p.m. agitation, before a 1% transfer of cell suspension into fresh media. This 1% transfer was repeated every 24 h for 21 days. Every seventh day, the whole population was centrifuged at 3,600 r.p.m. (Thermo Scientific Megafuge 40 R TX-1000) for 5 min, resuspended in 1 ml 50% glycerol and stored at −80 °C.
Genome sequencing
Sequencing of the ancestor (hybrid) and evolved (short read) strains was performed by MicrobesNG (UK). A single colony of the ancestral strain was sequenced from pure culture. For the six control populations, a single colony was randomly selected. To select colonies for sequencing from the Glc, GEN and GLC+GEN populations, the populations were first grown to single colonies on an LB agar plate before 16 colonies per population were added directly to 100 µl of 1 µg ml^−1^ gentamicin in LB in individual wells of a 96-well plate. The plate was then incubated for 24 h at 37 °C with 162 r.p.m. agitation and the resulting kinetics were plotted. From this assay, three strains per population were selected for sequencing to represent the range of growth curve profiles, aiming to capture greater genetic diversity within the population than could be observed from a single colony. The growth assay was then repeated in triplicate for each of the selected strains, and these strains were used in all subsequent assays. Full details of each of the sequenced strains, including accession numbers, are provided in Table S1.
Bioinformatics
The ancestor hybrid assembly was generated using Flye (v2.8.1-b1676) [25], polished using Polypolish (v0.5.0) [26] and annotated with Bakta (v1.8.2) [27]. Genes of interest that were assigned a function but not a gene name were confirmed by BLASTn queries. Variants were called against the assembled ancestor using breseq (v0.36.0) [28] with a consensus minimum variant coverage of ten and a minimum mapping quality of 20. Genes with variants that were present in the control populations were discounted from the test populations. Resistance genes in the ancestral strain were predicted using ABRicate (v0.8) to query the ResFinder database, and sequence type was ascertained using mlst (v2.23.0) [29].
Statistical analyses
All analyses were conducted in Python (v3.9.10). Area under the curve measurements were calculated using numpy.trapz (v1.22.3). Significance testing was conducted using pair-wise one-way ANOVA tests with the SciPy (v1.8.0) f_oneway function. The Bonferroni correction was used to adjust for multiple comparisons. All P-values are provided in Supplementary Data sheet 1.
Results
Glucose reduces the effect of sub-inhibitory gentamicin on growth
USVAST002 (ST73) was selected for its status as a UPEC strain with no predicted functional resistance genes. The MIC of gentamicin in ISB against USVAST002 in the absence of added glucose was 2 µg ml^−1^. To assess how the action of gentamicin is affected by the presence of glucose [30], USVAST002 was grown in 2 mg ml^−1^ glucose plus subinhibitory gentamicin [100 ng ml^−1^ (5% MIC), 250 ng ml^−1^ (12.5% MIC) or 500 ng ml^−1^ (25% MIC)]. In the absence of glucose, at increasing concentrations of gentamicin, there was a corresponding reduction in growth (Fig. 1). In the absence of gentamicin, the addition of glucose increased growth significantly (Figs 1, S1 and S2, available in the online Supplementary Material; one-way ANOVA, Bonferroni corrected). The reduction in growth caused by gentamicin in the presence of glucose was smaller than the effect in the absence of glucose. This suggests that glucose acts to reduce the effect of gentamicin.
Growth kinetics of USVAST002 in the presence or absence of 2 mg ml−1 added glucose plus (a) 100 ng ml−1, (b) 250 ng ml−1 or (c) 500 ng ml−1 gentamicin. Curves for LB only and LB+glucose are the same for each plot and are shown on each for ease of comparison. Measurements in technical triplicate, error bars standard deviation. Corresponding area under the curve plots are provided in Fig. S1. Repeats of (c) with five independent biological replicates per condition are provided in Fig. S2.
Phenotypic changes following prolonged gentamicin exposure
To assess how glucose might affect the evolution of gentamicin resistance, we performed a 21 day evolution experiment in conditions of 2 mg ml^−1^ glucose (Glc), 500 ng ml^−1^ gentamicin (GEN) and both glucose and gentamicin (Glc+GEN). We then screened the growth kinetics of three colonies from each of the evolved populations in LB only and in 1 µg ml^−1^ gentamicin, as well as performing MIC assays in a gradient of gentamicin. In these conditions, the majority of the strains from the Glc and the Glc+GEN populations had comparably worse growth than the ancestor (Figs S3 and S4). In contrast, with the exception of strain GEN 4C, most of the strains from the GEN populations grew comparably to the ancestor in LB only, but six strains grew significantly better in 1 µg ml^−1^ gentamicin (one-way ANOVA, Bonferroni corrected). GEN 4C also grew more poorly than the ancestor in the presence of antibiotics. No strain had an MIC that was significantly different from the ancestor (Table S1).
Long-term exposure to glucose causes significant genetic changes
The extent to which glucose may act as a selective pressure is not understood fully. To investigate this, we performed short-read sequencing of the three individual colonies from each of the evolved populations and analysed the significant genetic changes. The changes were pooled for each replicate to gain a representative understanding of mutations that were present in the population as a whole (Fig. 2) but are provided at an individual strain level in Table S1. Mutations in the RNA polymerase sigma factor rpoS were identified in five of the six replicate populations in both the Glc and the Glc+GEN conditions. This included five different non-synonymous SNPs that introduced premature stop codons (Glc P1 Q59*, and Glc +GEN P1 Q251*, P3 Q257*, P4 L30*) (Table S1). In the sixth Glc population, there was an intergenic SNP between nlpD and rpoS, and in the sixth Glc+GEN, a 6506 bp deletion spanned the same region. No changes were observed in this region in any of the control or GEN populations, indicating that they may have arisen as a result of glucose exposure.
Genetic changes identified in response to Glc, GEN or both Glc+GEN. Each ring represents pooled changes from three individual colonies from each replicate population. Changes also identified in any control population are not presented here.
Glucose alters the evolutionary response to gentamicin
We then analysed the populations that evolved in the presence of gentamicin to identify any significant genetic changes arising as a result of antibiotic exposure. We identified SNPs in trkH, encoding a potassium ion uptake system, in five of the six GEN populations (Fig. 2). There were four different non-synonymous mutations identified across the replicates (I15L, L185Q, G25R and P151S), with one GEN population carrying at least two different mutations (GEN 1A I15L and GEN 1B L185Q) (Table S1). We also found mutations in hyxB, an autotransporter, in four of the six populations, and two in wecA (involved in enterobacterial common antigen and O-antigen biosynthesis). Strains with three of these trkH mutations reached a higher maximum OD than the ancestor in the presence of 1 µg ml^−1^ gentamicin (Fig. 3). In contrast, none of the strains carrying mutations in hyxB (GEN 1C, 3A, 3C, 5B, 5C, 6C) had better growth than the ancestor in 1 µg ml^−1^ gentamicin (Fig. S3). Even though mutations in trkH and hyxB were found within the same GEN population reproducibly, to the resolution of our sequencing (three colonies per population), we did not find any instances of both trkH and hyxB variants within the same sequenced strain (Table S1). Strikingly, none of the mutations identified in any of the strains from the GEN populations were found in any strains from the Glc+GEN populations. This suggests that the presence of glucose alters the evolutionary response of UPEC to gentamicin.
Growth kinetics in 1 µg ml−1 gentamicin for the ancestor (Anc) and the strains with mutations in trkH. The amino acid change as a result of the mutation in each strain is provided to the left of the key. All curves are presented in Fig. S3, and area under the curve values are presented in Fig. S4. Measurements in technical triplicate, error bars standard deviation.
Discussion
Given the distinct metabolic microenvironment of the urinary tract and the extent to which it varies as a result of factors including diabetes mellitus and gestational diabetes, very little is known about how the concentration of different metabolites may drive UPEC evolution and response to antibiotics. Here, we discovered that glucose alters the evolutionary response of a UPEC strain to gentamicin.
We identified several genes that were mutated in the presence of gentamicin only, including trkH and hyxB. The trkH gene encodes a potassium ion uptake system [31], and mutations in this gene have been observed in E. coli populations adapted to aminoglycosides, resulting in decreased aminoglycoside susceptibility accompanied by increased susceptibility to nalidixic acid and tetracycline [32]. This is in contrast to what we have observed here, whereby strains with mutations in trkH did not have significantly different gentamicin susceptibility compared with the ancestor. Indeed, we found that no evolved strain had a significantly different gentamicin MIC compared with the ancestral strain. It is, however, important to note that the evolution medium (LB) differs from the MIC medium (ISB). The initial inoculum size was also smaller in the MIC assays compared with the growth assays, which may impact our conclusions. The hyxB gene (also called upaB [33]) encodes a virulence-associated autotransporter that mediates adherence to extracellular matrix proteins [3335]. It has been identified across E. coli pathotypes [34], with reports suggesting it is disrupted or absent in diarrhoeagenic E. coli but present in nosocomial, but not community, UPEC strains [3638]. The presence of both trkH and hyxB mutations in the same populations but, to the resolution of our sampling, never the same genome suggests that there may be selection for only one variant per strain.
Variations within or around the rpoS gene were identified in all 12 of the Glc and Glc+GEN populations, and not in either the control or the GEN populations. RpoS is a general stress sigma factor that is known to be induced during glucose starvation [39], with a role in osmotolerance [40]. RpoS also has a role in carbon metabolism, including in the uptake of glucose [4143]. The lack of rpoS mutations in the GEN condition supports a recent study that found that expressing high levels of rpoS had minimal impact on antibiotic resistance [44]. From our observations, we could speculate that these mutations in rpoS might be in response to a glucose-induced stress, or may work to influence glucose uptake or metabolism. Mutations in rpoS have been identified in other evolution experiments, including those investigating the impact of multidrug resistance plasmids on E. coli [45] and other clinical enterobacteria [46], as well as on Pseudomonas aeruginosa biofilms exposed to imipenem [47]. This may indicate a more generalized stress response.
Our data suggest that glucose may impact the emergence of mutations linked to resistance, possibly due to increased efflux activity reducing the internal antibiotic concentration. AcrD is thought to efflux aminoglycosides in E. coli [4849], but analysis of a highly similar AcrD in Salmonella was found to not efflux gentamicin [50]. More research is, therefore, needed to understand the mechanism underpinning these results, including characterizing the effect of trkH, hyxB and rpoS mutations. Our study also used only a single E. coli strain which does not account for variations in genetic background, and so further work encompassing the phylogenetic diversity of UPEC should also be considered.
Supplementary material
10.1099/mic.0.001548Supplementary Material 1.
10.1099/mic.0.001548Supplementary Material 2.
The reference list from the paper itself. Each links out to its DOI / PubMed record.
- 1Stamm WE Norrby SR Urinary tract infections: disease panorama and challenges J Infect Dis 2001183 Suppl 1S 1410.1086/31885011171002 · doi ↗ · pubmed ↗
- 2Timm MR Russell SK Hultgren SJ Urinary tract infections: pathogenesis, host susceptibility and emerging therapeutics Nat Rev Microbiol 202523728610.1038/s 41579-024-01092-439251839 · doi ↗ · pubmed ↗
- 3Foxman B Epidemiology of urinary tract infections: incidence, morbidity, and economic costs Am J Med 2002113 Suppl 1A 5S 13S 10.1016/s 0002-9343(02)01054-912113866 · doi ↗ · pubmed ↗
- 4Foxman B The epidemiology of urinary tract infection Nat Rev Urol 2010765366010.1038/nrurol.2010.19021139641 · doi ↗ · pubmed ↗
- 5Werneburg GT Catheter-associated urinary tract infections: current challenges and future prospects Res Rep Urol 20221410913310.2147/RRU.S 27366335402319 PMC 8992741 · doi ↗ · pubmed ↗
- 6Salari N Karami MM Bokaee S Chaleshgar M Shohaimi S et al The prevalence of urinary tract infections in type 2 diabetic patients: a systematic review and meta-analysis Eur J Med Res 2022272010.1186/s 40001-022-00644-935123565 PMC 8817604 · doi ↗ · pubmed ↗
- 7Whelan S Lucey B Finn K Uropathogenic Escherichia coli (UPEC) associated urinary tract infections: the molecular basis for challenges to effective treatment Microorganisms 202311216910.3390/microorganisms 1109216937764013 PMC 10537683 · doi ↗ · pubmed ↗
- 8Bonkat G Cai T Veeratterapillay R Bruyère F Bartoletti R et al Management of Urosepsis in 2018 Eur Urol Focus 201955910.1016/j.euf.2018.11.00330448051 · doi ↗ · pubmed ↗