Prescription Medication Expenditures for Patients With Diabetes in the United States: 2012–2021
Shanshan Li, Shaoxi Pan, Nan Xiao, Shaoxiang Jiang, Gorden G. Liu, Beini Lyu

Abstract
Glucose‐lowering medication expenditures per user by different payers among patients with diabetes.
Genes, proteins, chemicals, diseases, species, mutations and cell lines named across the full text — each resolved to its canonical identifier and authoritative record.
Click any figure to enlarge with its caption.
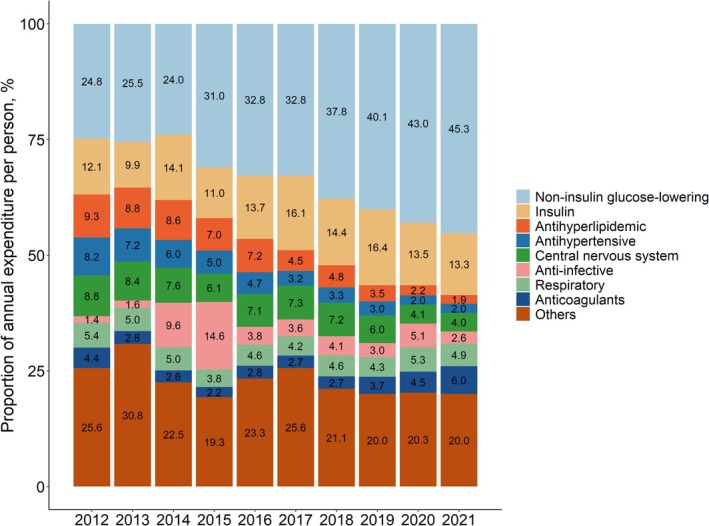 FIGURE 1
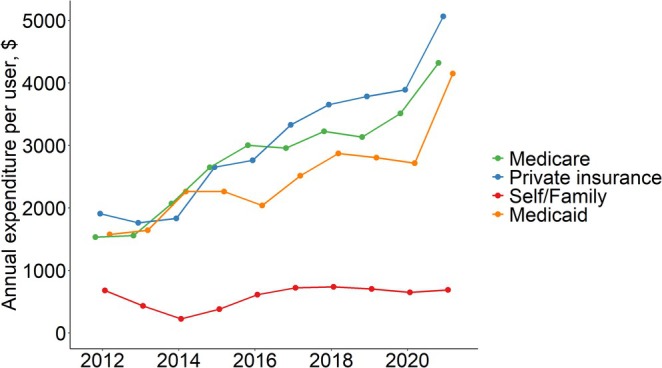 FIGURE 2
- —National Natural Science Foundation of China10.13039/501100001809
Peer Reviews
No public reviews on file for this paper yet. If you reviewed it on a platform where reviews are public (OpenReview, ICLR, NeurIPS, ICML), you can paste yours below so the community can read it here.
Videos
No videos yet. Explain this paper in a talk, walkthrough, or lecture? Add one.
Taxonomy
TopicsMedication Adherence and Compliance · Pharmaceutical Economics and Policy · Health Systems, Economic Evaluations, Quality of Life
1
Summary
- Annual prescription medication expenditures per person increased from 6397 in 2021 for patients with diabetes, driven primarily by increased spending on insulin and non‐insulin glucose‐lowering drugs.
- The majority of prescription medication expenditures were borne by Medicare and private insurance.
- These findings emphasize the need for policies to control the rising costs of medications, especially glucose‐lowering medications.
To the Editor,
Diabetes imposes an enormous medical and economic burden on individuals and society, particularly regarding prescription medications [1, 2]. As the number and complexity of medications grow markedly [3], a systematic examination of medication expenditures is essential. However, previous studies on medication expenditures among patients with diabetes have mainly focused on glucose‐lowering medications, and few have incorporated non‐glucose‐lowering medications. Such an analysis is needed to provide a comprehensive understanding of medication expenditures, to reveal opportunities to alleviate the economic burdens, and to guide resource allocation. We aimed to examine overall prescription medication expenditures, as well as by therapeutic class and payment sources for patients with diabetes in the United States.
Methods
1
We utilized data from the Medical Expenditure Panel Survey (MEPS), a nationally representative survey in the United States [4]. We included patients ≥ 18 years and reported being diagnosed with diabetes (both Types 1 and 2) from 2012 to 2021. Prescription medication expenditures were the amount that pharmacy received during the survey year for all prescription medication [5]. Expenditures were categorized by therapeutic class and payment sources (including Medicare, Medicaid, private insurance, and out‐of‐pocket [OOP] payments). We calculated annual medication expenditures per person, expenditures per user, overall and by payment sources, expenditures among different insurance beneficiaries, and the proportion of expenditures attributed to a certain therapeutic class. Please see detailed methods in Item S1.
Results
2
The study included 30 146 patients with diabetes (mean [95% confidence interval] age 62.4 [54.0–72.0] years, Figure S1 and Table S1). Annual prescription medication expenditures per person increased from 6397 in 2021, with Medicare being the largest source of payment (2948 in 2021), followed by private insurance (1951 in 2021) and Medicaid (877 in 2021, Figure S2), while OOP cost decreased from 415 in 2021. Similar patterns were found among insurance beneficiaries (Figure S3). Expenditures were highest among Medicare beneficiaries (6170 in 2021), followed by those covered by private insurance and Medicaid.
Glucose‐lowering medications contributed the largest proportion of expenditures (36.9% in 2012 to 58.6% in 2021, Figure 1), with a substantial increase attributed to non‐insulin glucose‐lowering medications (24.8% in 2012 to 45.3% in 2021). The proportion attributed to insulin remained stable (12.1% in 2012 to 13.3% in 2021). Expenditures attributed to non‐glucose‐lowering medications decreased over time and accounted for 41.4% in 2021.
Proportion of annual medication expenditures per person attributed to different therapeutic classes.
For annual cost per user, the cost was highest for glucose‐lowering medications (from 4393 in 2021), with a substantial increase for insulin (6618, a 100.5% increase) and non‐insulin drugs (3765, a 180.0% increase). Medicare and private insurance were the main payment sources, and both increased substantially over time (Figure 2). We found similar patterns among various insurance beneficiaries (Figure S4).
Glucose‐lowering medication expenditures per user by different payers among patients with diabetes.
Comment
3
In summary, prescription medication expenditures increased substantially over the past decade among patients with diabetes, with the majority of expenditures attributed to glucose‐lowering medication and borne by Medicare and private insurance.
Consistent with studies in the United States and outside of the United States [6, 7, 8, 9, 10], medication costs increased among patients with diabetes, especially for glucose‐lowering medications. The increasing use of newer and more expensive medications such as sodium‐glucose cotransporter‐2 inhibitors and greater use of costly insulin analogs rather than cheaper human insulin likely contributes to this surge [10, 11]. Non‐glucose‐lowering medications also constituted a substantial portion of medication expenditures. The use of these medications, such as central nervous system, anti‐infective, and respiratory medications, is prevalent in patients with diabetes, consistent with the increasing burden of comorbidities among these patients [3, 12, 13].
We found decreasing OOP medication expenditures over time. Policy reforms such as the Medicare Part D, the Affordable Care Act (ACA), and Medicaid expansion could have contributed to OOP costs decrease [14, 15]. In contrast, medication expenditures borne by insurance increased substantially, especially among beneficiaries. The untransparent discounts and rebates between the pharmacy and insurance in the United States likely complicate the calculation of costs [16, 17, 18]. Nonetheless, the increasing spending by insurance may lead to higher premiums and increase patients' financial burden [19]. Policies such as the Inflation Reduction Act allow price negotiation and rebates for several non‐insulin glucose‐lowering medications in Medicare and cap Medicare Parts B and D insulin cost‐sharing [20, 21]. This is expected to reduce Medicare prescription drug spending [22].
Our study had several limitations. First, the diagnosis of diabetes and comorbidities were based on self‐report. Second, over‐the‐counter medications were not accounted for in the MEPS. Third, expenditures were measured as the total amount paid by insurers and patients, and it might differ from the amount received by manufacturers due to discounts and rebates.
In summary, prescription medication expenditure increased substantially for patients with diabetes, especially for glucose‐lowering medications. With ongoing policies to reduce medication costs, future studies are needed to evaluate policy impact on medication costs and patient outcomes among patients with diabetes.
Author Contributions
S. Li, S. Pan, N. Xiao, S. Jiang, G.G. Liu, and B. Lyu were involved in the conception, design, and conduct of the study and the analysis. All authors were involved in the interpretation of the results. S. Li and B. Lyu wrote the first draft of the manuscript, and all authors edited, reviewed, and approved the final version of the manuscript. S. Li and B. Lyu are the guarantors of this work and, as such, had full access to all the data in the study and take responsibility for the integrity of the data and the accuracy of the data analysis.
Disclosure
The authors have nothing to report.
Conflicts of Interest
The authors declare no conflicts of interest.
Supporting information
Data S1.
The reference list from the paper itself. Each links out to its DOI / PubMed record.
- 1E. D. Parker , J. Lin , T. Mahoney , et al., “Economic Costs of Diabetes in the U.S. in 2022,” Diabetes Care 47, no. 1 (2024): 26–43, 10.2337/dci 23-0085.37909353 · doi ↗ · pubmed ↗
- 2X. Zhuo , P. Zhang , H. S. Kahn , B. H. Bardenheier , R. Li , and E. W. Gregg , “Change in Medical Spending Attributable to Diabetes: National Data From 1987 to 2011,” Diabetes Care 38, no. 4 (2015): 581–587, 10.2337/dc 14-1687.25592194 · doi ↗ · pubmed ↗
- 3S. Li , S. Pan , S. Jiang , J. Shin , G. G. Liu , and B. Lyu , “Prescription Medication Use Among Patients With Type 2 Diabetes in the United States: 1999–2020,” Diabetes, Obesity and Metabolism 26, no. 7 (2024): 2933–2944, 10.1111/dom.15619.38695210 · doi ↗ · pubmed ↗
- 4Medical Expenditure Panel Survey (MEPS) , accessed May 21, 2024, https://www.ahrq.gov/cpi/about/otherwebsites/meps.ahrq.gov/index.html.
- 5MEPS HC‐220A: 2020 Prescribed Medicines File, accessed May 21, 2024, https://meps.ahrq.gov/data_stats/download_data/pufs/h 220a/h 220adoc.shtml#Data 25.
- 6X. Hua , N. Carvalho , M. Tew , E. S. Huang , W. H. Herman , and P. Clarke , “Expenditures and Prices of Antihyperglycemic Medications in the United States: 2002–2013,” Journal of the American Medical Association 315, no. 13 (2016): 1400–1402, 10.1001/jama.2016.0126.27046369 PMC 4886177 · doi ↗ · pubmed ↗
- 7K. J. Lipska , J. S. Ross , H. K. Van Houten , D. Beran , J. S. Yudkin , and N. D. Shah , “Use and Out‐of‐Pocket Costs of Insulin for Type 2 Diabetes Mellitus From 2000 Through 2010,” Journal of the American Medical Association 311, no. 22 (2014): 2331–2333, 10.1001/jama.2014.6316.24915266 PMC 4133975 · doi ↗ · pubmed ↗
- 8K. S. Johansson , E. Jimenez‐Solem , T. S. Petersen , and M. B. Christensen , “Rational Pharmacotherapy in Type 2 Diabetes: Danish Data From 2002 to 2020 on Mortality, Diabetes‐ Related Outcomes, Adverse Events, and Medication Expenses,” Diabetes Care 47, no. 9 (2024): 1656–1663, 10.2337/dc 24-0619.38995637 · doi ↗ · pubmed ↗