Integrated machine learning identifies disulfidptosis-related and ferroptosis-related genes to evaluate survival prognosis and treatment efficacy in kidney renal clear cell carcinoma
Yuan Xiang, Zijian Zhou, Tong Mu, Shunyao Zhang, Lei Xie, Yajie Zhou, Wenxiong Zhang, Liuxiang Fu

TL;DR
This study combines two cell death pathways to build a new model for predicting survival and treatment response in kidney cancer.
Contribution
First integrated model using disulfidptosis and ferroptosis genes for kidney cancer prognosis and treatment guidance.
Findings
A 5-gene signature and nomogram improved survival prediction in kidney cancer patients.
High-risk patients showed distinct immune profiles and drug sensitivity patterns.
RT-qPCR confirmed the expression of key genes in kidney cancer cell lines.
Abstract
Ferroptosis and disulfidptosis, two programmed cell death pathways, critically drive tumor growth by affecting metastasis. Although the prognostic value of disulfidptosis and ferroptosis had been separately validated in kidney renal clear cell carcinoma (KIRC), prognostic effect of integrating two programmed death genes remains unclear in KIRC. Our objective is to establish an innovative prognostic model for KIRC. We sourced KIRC patients’ information that contains clinical and genomic from The Cancer Genome Atlas (TCGA) database. We selected disulfidptosis-related and ferroptosis-related genes (DRFs) to construct a prognostic model. By combining clinical features and prognostic models, we developed the nomogram. Additionally, the mechanism of DRF was explored in KIRC, including tumor immune dysfunction and exclusion (TIDE), Kaplan-Meier (K-M) analysis, tumor microenvironment (TME)…
Genes, proteins, chemicals, diseases, species, mutations and cell lines named across the full text — each resolved to its canonical identifier and authoritative record.
Click any figure to enlarge with its caption.
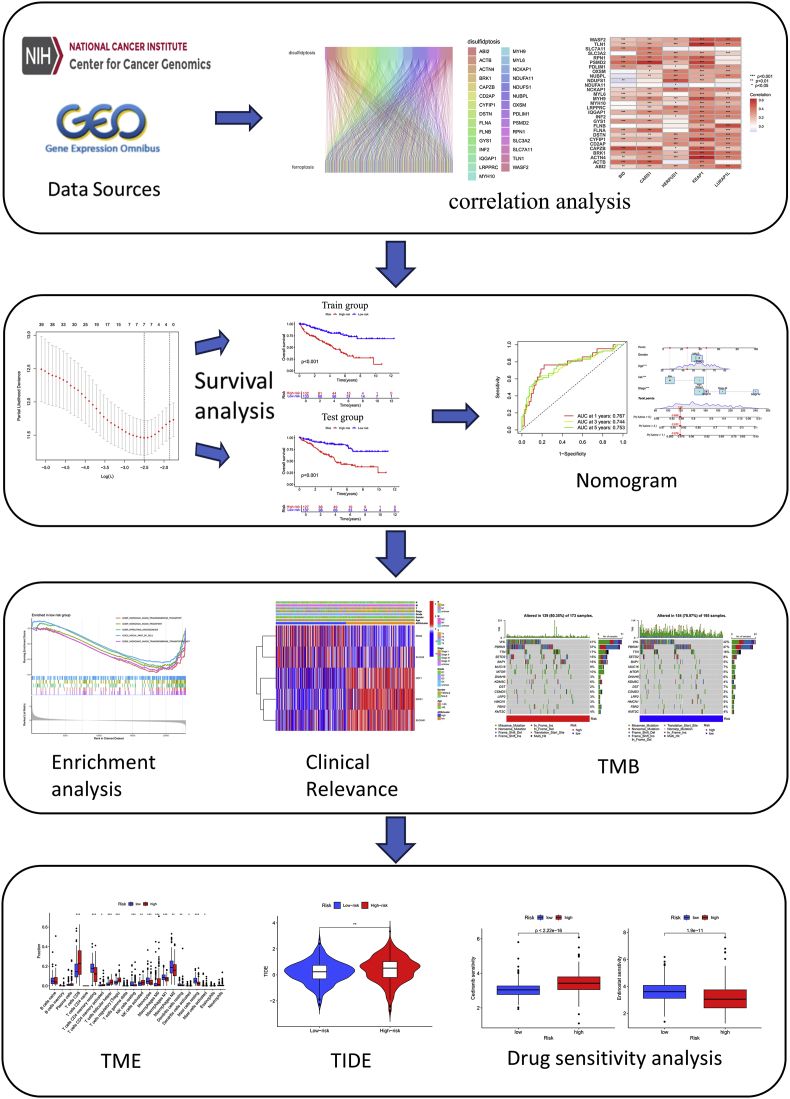 Figure 1
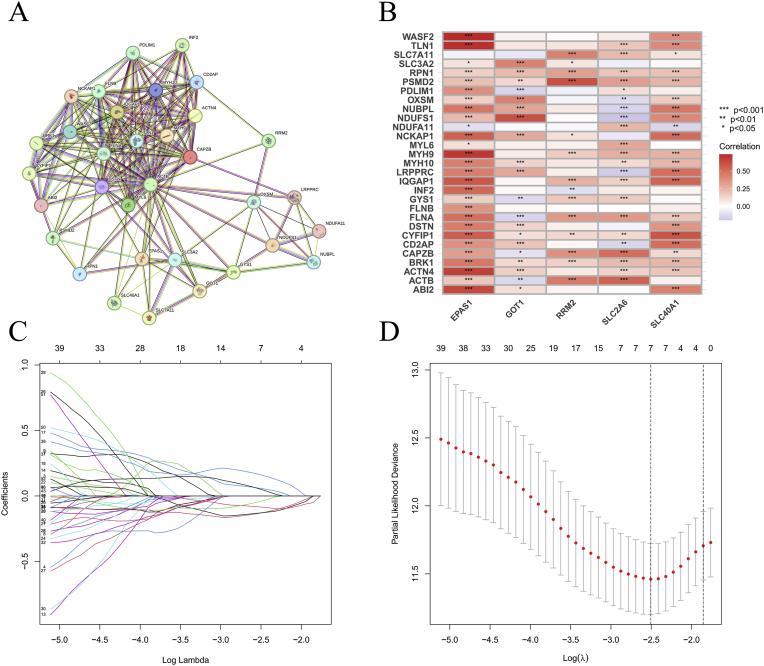 Figure 2
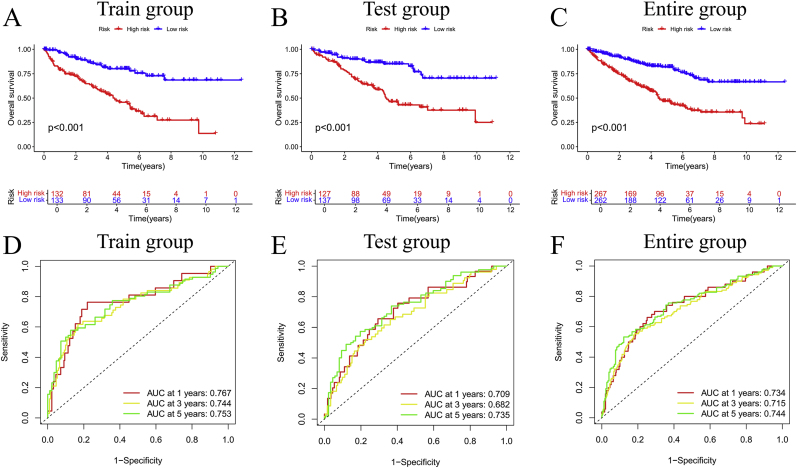 Figure 3
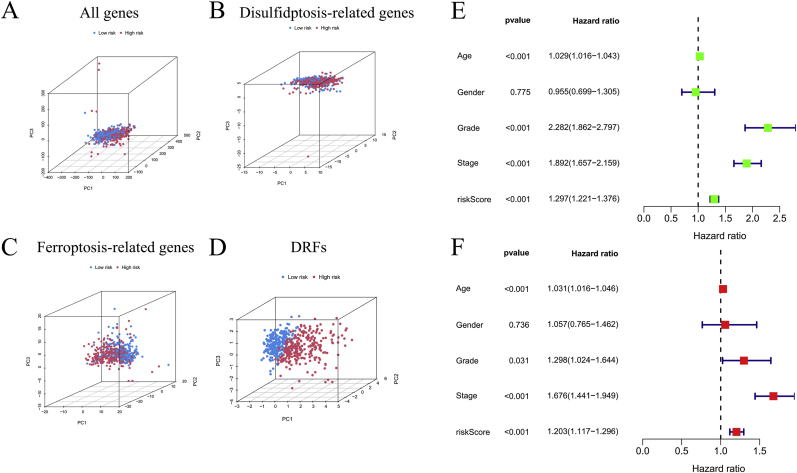 Figure 4
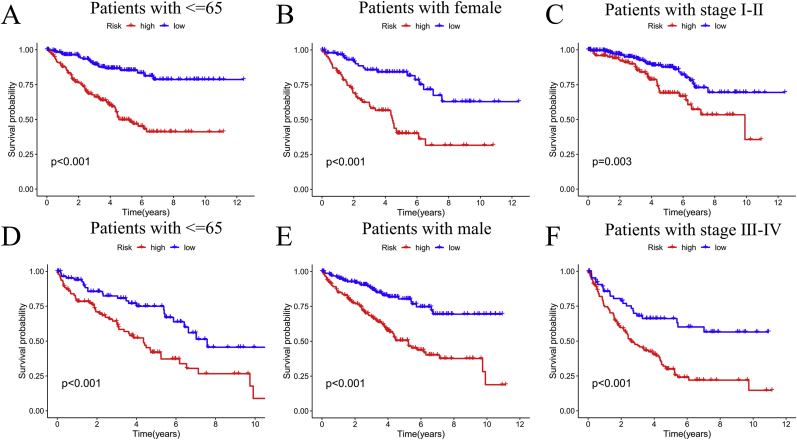 Figure 5
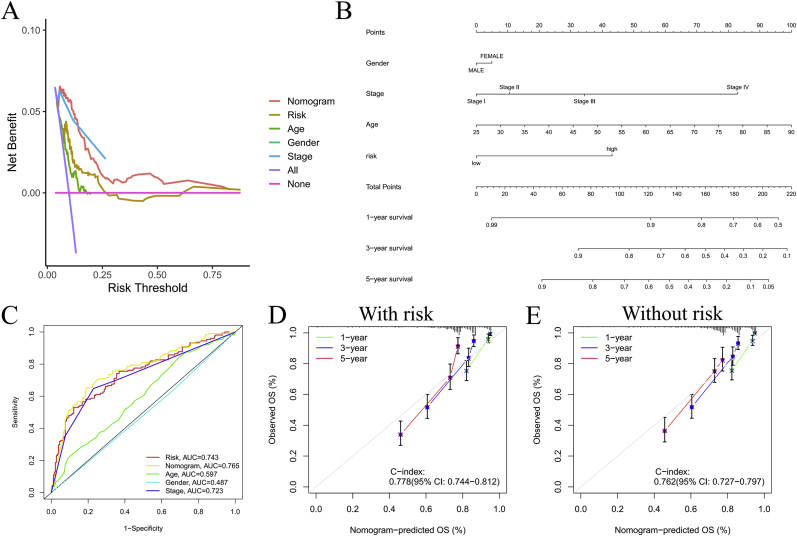 Figure 6
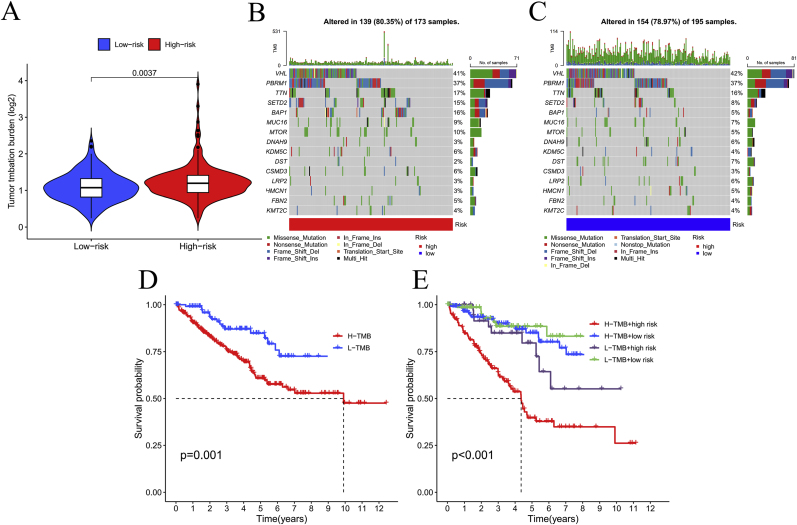 Figure 7
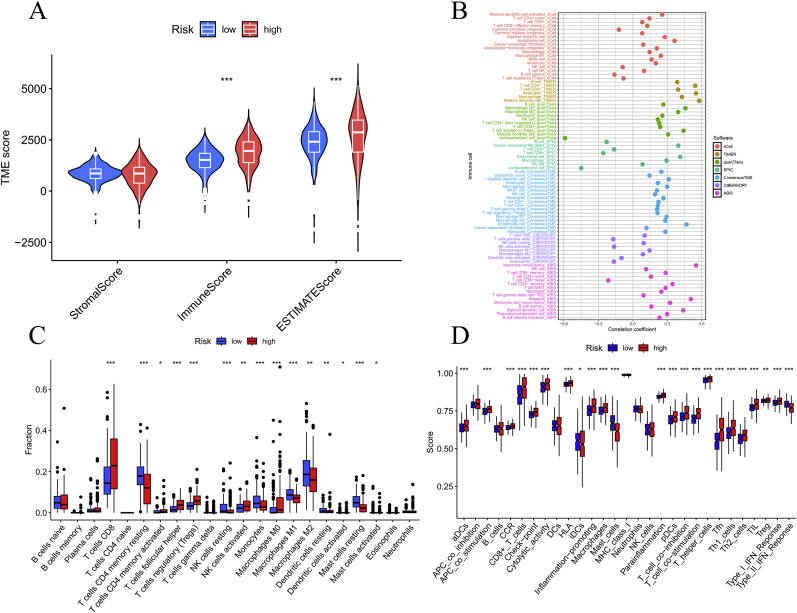 Figure 8
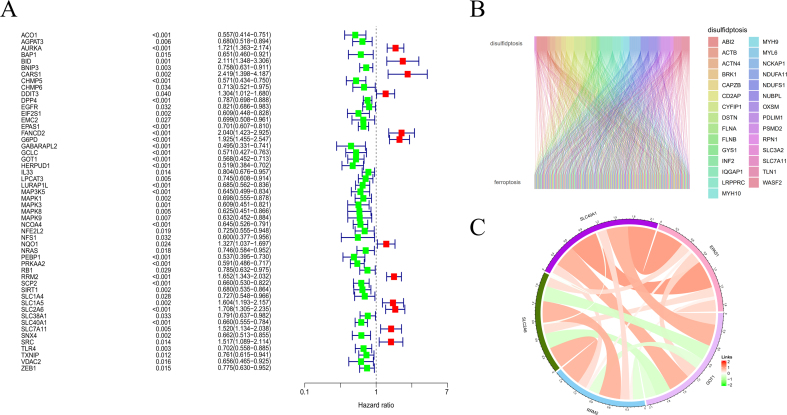 Figure 9
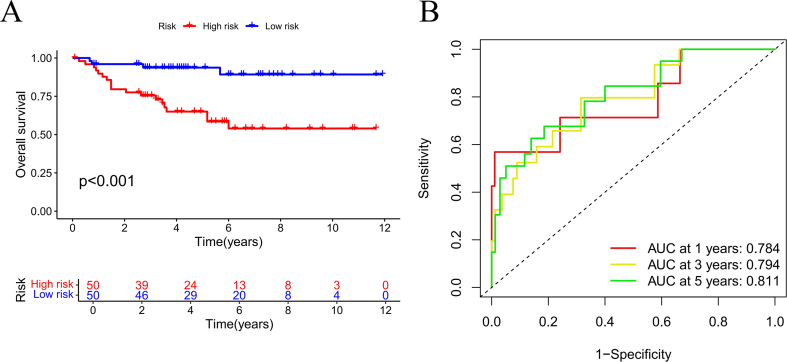 Figure 10
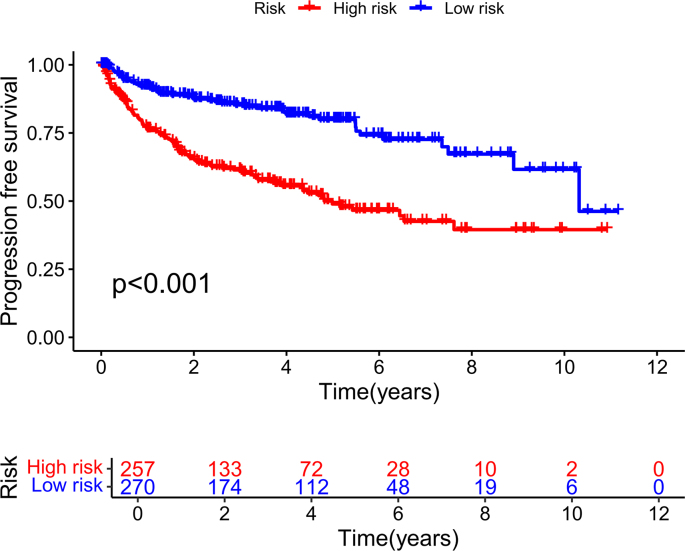 Figure 11
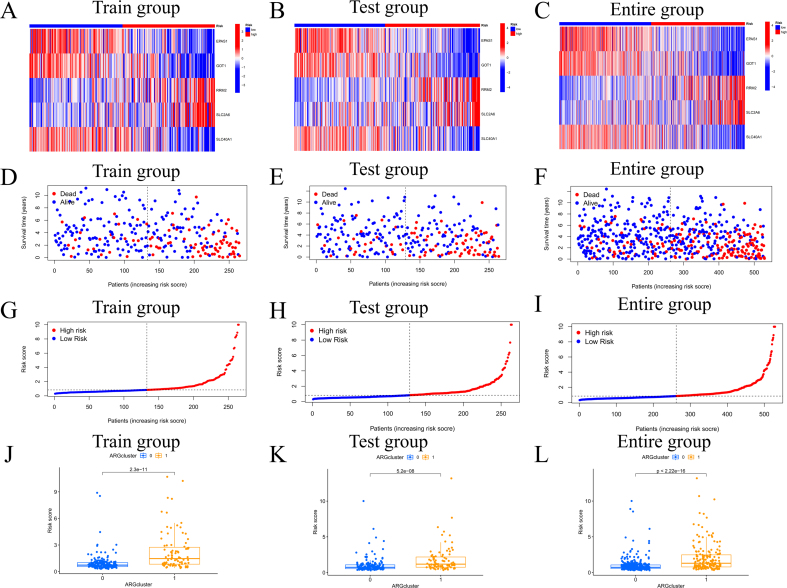 Figure 12
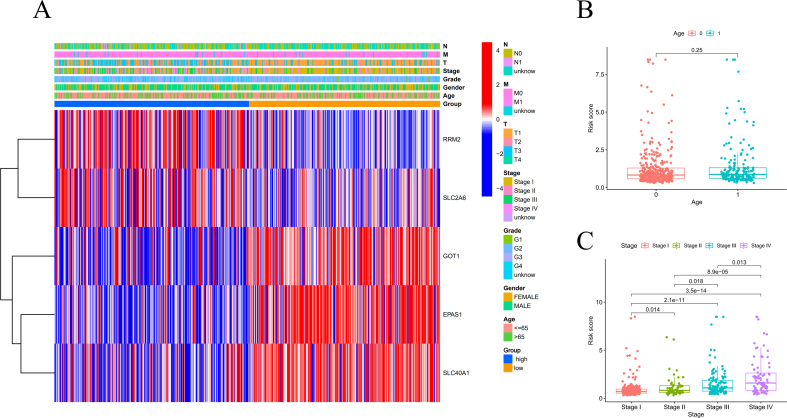 Figure 13
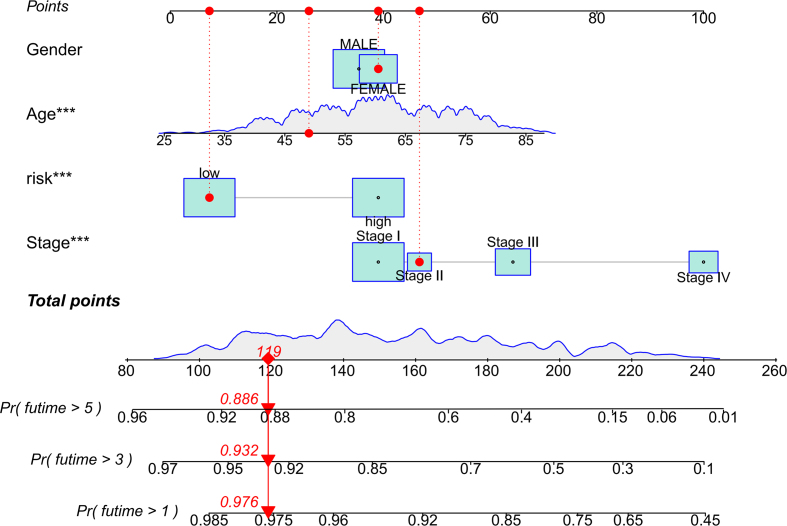 Figure 14
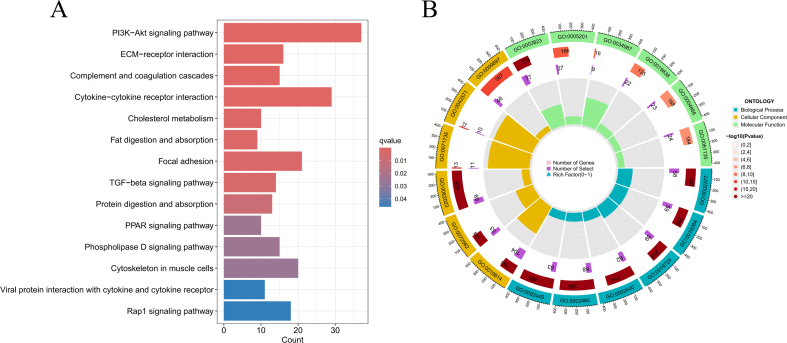 Figure 15
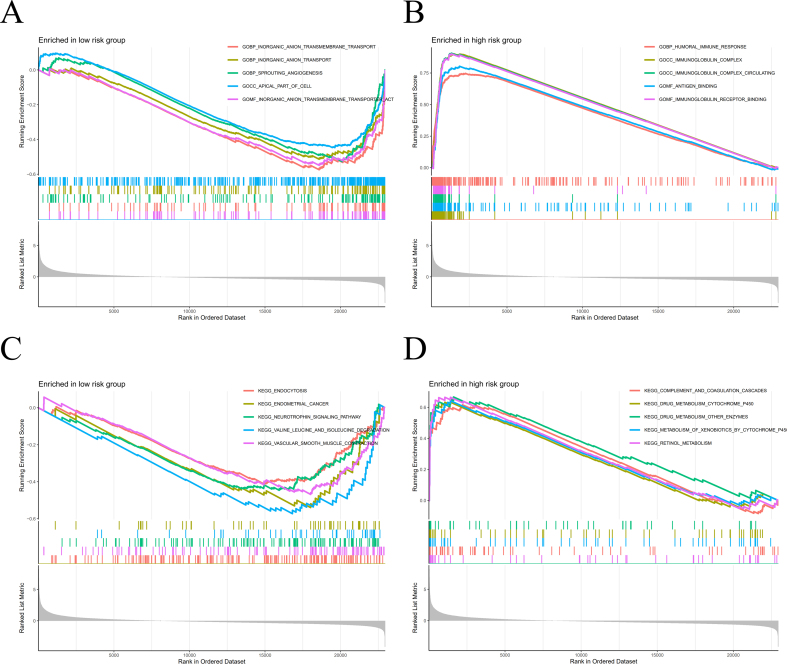 Figure 16
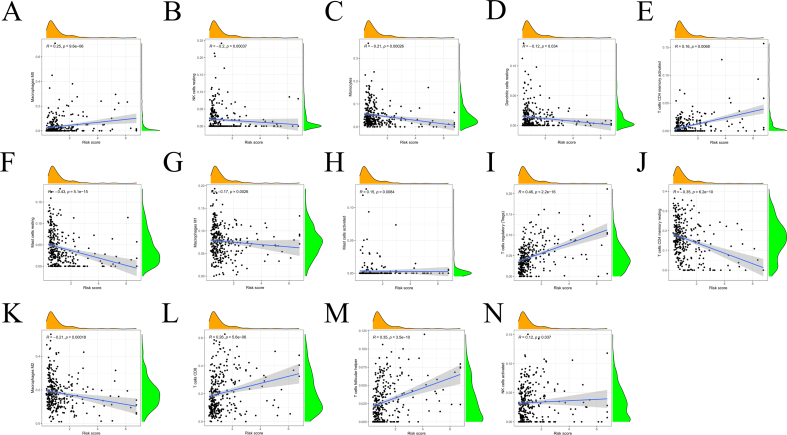 Figure 17
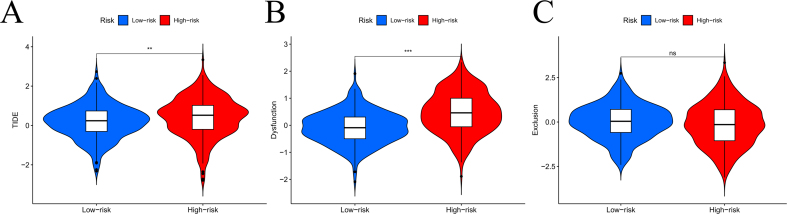 Figure 18
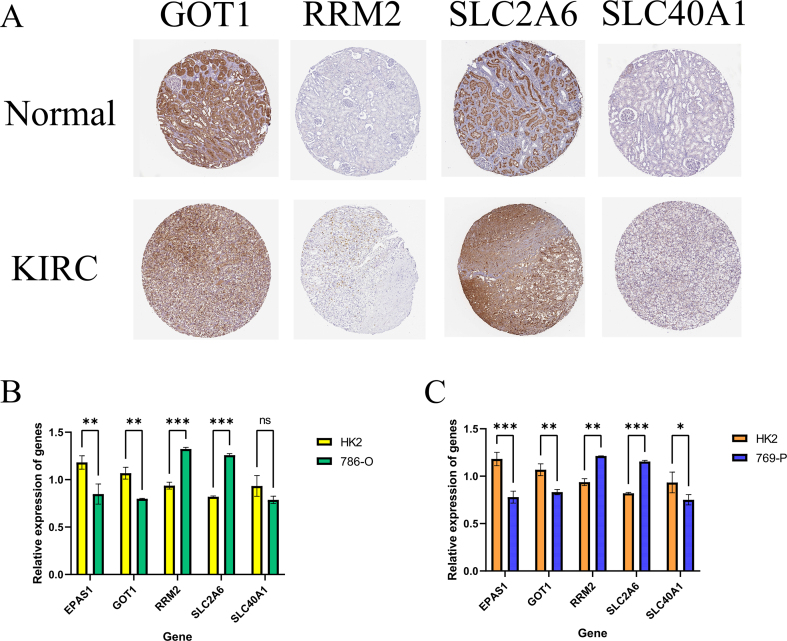 Figure 19
Peer Reviews
No public reviews on file for this paper yet. If you reviewed it on a platform where reviews are public (OpenReview, ICLR, NeurIPS, ICML), you can paste yours below so the community can read it here.
Videos
No videos yet. Explain this paper in a talk, walkthrough, or lecture? Add one.
Taxonomy
TopicsFerroptosis and cancer prognosis · Renal cell carcinoma treatment · Cancer, Lipids, and Metabolism
Introduction
1
As the most common renal parenchymal neoplasm, Clear cell renal cell carcinoma (ccRCC) demonstrates distinct molecular profiles including VHL gene mutations and aberrant HIF pathway activation, with incidence rates 2–3 times higher than papillary and chromophobe subtypes combined [1]. According to NCCN 2023 Guidelines (Version 2), the TNM classification framework stratifies ccRCC into four progressive stages (I-IV), with corresponding 5-year survival rates ranging from 93 % (Stage I) to 8 % (Stage IV) as documented in the SEER-22 registry [2]. However, since many kidney cancer cases are detected incidentally, prognosis predictions based on clinical staging alone are often unreliable [3]. This underscores the need for a more accurate diagnostic and prognostic approach. Recently, advances in molecular mechanism research have led to the development of biomarker-based prognostic models, which show great promise in predicting cancer patient outcomes.
Disulfidptosis involves redox imbalance (NADPH depletion and disulfide stress), while ferroptosis features iron-dependent lipid peroxidation, both contributing to tumorigenic microenvironments through differential metabolic disruptions [4,5]. The combined model of ferroptosis and disulfidptosis developed by Ma et al. has been validated for prognostic assessment in lung adenocarcinoma patients [6]. A similar prognostic model developed by Zhang C et al. has been validated for prognosis in patients with hepatocellular cells [7]. Zhang X et al. reviewed the contribution of DRFs in the treatment of bladder cancer [8]. However, we found that no one has used DRFs to construct a prognostic model of KIRC.
Consequently, we used DRFs to developed a prognostic model. The clinical utility of this model was evaluated using enrichment analysis, drug sensitivity analysis, TME analysis, TIDE analysis and TMB analysis.
Methods
2
Source of data
2.1
The original cohort data were derived from TCGA database (https://portal.gdc.cancer.gov/repository), which included transcriptome sequencing data of 537 patients and clinical annotation information (survival time, stage, grade, etc.) of 614 patients. We used transcription data in HTSeq-Counts and HTSeq-FPKM formats, each serving different analytical purposes. We selected patients with comprehensive transcriptomic and clinical data, ensuring they were present in both datasets. Consequently, this study included 529 cancer samples and 86 normal samples. For independent verification of the analytical model's generalizability, the research team employed the publicly accessible E-MTAB-1980 genomic dataset, which was obtained through the ArrayExpress (https://www.ebi.ac.uk/arrayexpress/) - a well-established bioinformatics platform maintained by the European Bioinformatics Institute for disseminating functional genomics experiments.
Ferroptosis-associated genes (n = 383) and disulfidptosis regulators (n = 29) were systematically identified using FerrDb (http://www.zhounan.org/ferrdb/current/) and literature-based screening. These genes were selected based on their established roles in ferroptosis and disulfidptosis, which are critical processes in tumor progression [9,10].
Select DRFs genes
2.2
DRFs were assessed using Pearson's correlation with stringent significance thresholds (|r| > 0.4, p < 0.001). This cohort was subsequently partitioned via stratified random sampling into derivation and validation subsets at a 1:1 ratio. Within the derivation cohort, prognostic feature selection employed a three-stage analytical pipeline: (1) preliminary screening through univariate Cox proportional hazards regression; (2) dimensional reduction via LASSO (Least Absolute Shrinkage and Selection Operator); (3) multivariate Cox modeling to identify independent prognostic determinants, controlling for potential confounders.
KIRC DRFs prognostic model
2.3
Model Development and Risk Stratification. The model was constructed using risk scores derived from the formula:
Risk score = .
A midpoint risk threshold (median-derived) was used to classify patients into HG and LG. To assess survival outcomes, OS differences across training, validation, and pooled datasets were evaluated with the "survival" package in R. For genomic profiling, principal component analysis (PCA) dimensionality reduction was implemented across four distinct genomic groupings: pan-transcriptome genes, signature-defined prognostic genes, disulfidptosis-associated markers, and ferroptosis pathway regulators, thereby validating intergroup heterogeneity. Finally, survival outcomes in the HG and LG groups were examined across diverse clinical subgroups (e.g., age, stage) to identify factors influencing prognosis.
Nomogram development for patient survival prediction
2.4
Using the "RMS" package in R software, we constructed a prognostic nomogram that integrates key clinical factors, including age, risk group, and tumor stage. This nomogram serves as a comprehensive and practical tool to predict patient outcomes, providing a visual representation of the combined impact of these clinical variables on survival. By quantifying the contribution of each factor, the nomogram offers a personalized approach for assessing prognosis in clinical settings [11]. Using the " survival " and " survminer "package in R software, we constructed Progression-Free Survival (PFS).
Enrichment analysis
2.5
Under the model constructed with 5 DRFs, we categorized the cases into HG and LG. We used the GSEA_4.3.2 software [12] to filter pathways with a p-value of <0.05 and a false discovery rate (FDR) of <0.25. Using the 5 DRFs, patients were classified into HG and LG. Pathway enrichment was conducted with GSEA against the Hallmark gene sets, identifying significantly dysregulated pathways (nominal P < 0.05, FDR<0.25). Additionally, we applied KEGG enrichment assays and GESA enrichment assays to investigate potential functions and pathways that correlate with gene sets.
Tumor mutational burden and prognostic assessment
2.6
TMB is a crucial factor in evaluating tumor prognosis. We retrieved somatic mutation data with the "TCGAbiolinks" package. Somatic variant analysis was performed using the maftools package (v2.6.05) with mutation annotation format (MAF) files processed through a standardized bioinformatic pipeline, and calculated the corresponding TMB values [13,14]. Additionally, we further explored the survival outcomes of patients under different mutation conditions to reflect the impact of various mutations on patient prognosis.
Immune microenvironment profiling
2.7
ESTIMATE scores were computed using the “ESTIMATE” package, followed by comparative analysis between HG and LG. To enhance immune landscape characterization, additional tumor microenvironment data were sourced from TIMER 2.0 platform (http://timer.cistrome.org) [15]. Immune ecosystem profiling through an integrated multi-algorithm framework (CIBERSORT, xCell, etc.) demonstrated significant risk score-immunome correlations, validated by deconvolution concordance analysis across all seven platforms. Finally, immune infiltration dynamics were quantified across 22 functionally distinct cell types to comprehensively map shifts in immune cell proportions.
Comparing the DRFs in immunotherapy and chemotherapy
2.8
To explore tumor Immunotherapy across risk groups, TIDE scores were acquired from the database (http://tide.dfci.harvard.edu/) [16]. GSVA was executed using the R package (v1.46.0) to systematically characterize immune microenvironment heterogeneity and delineate risk-stratified immunological fingerprints. Drug Sensitivity Prediction. Antimicrobial susceptibility profiling was conducted to pinpoint chemotherapeutic agents with differential efficacy between risk groups. Therapeutic responsiveness was quantified through estimation of half-maximal inhibitory potency (IC50) for common anticancer agents via the "oncoPredict" algorithm [17], leveraging transcriptomic profiles to predict drug efficacy. Comparative analysis of these metrics across HG and LG subgroups facilitated risk-adapted treatment planning.
Validation by RT-qPCR
2.9
Total RNA isolation from KIRC cell line models was conducted employing TRIzol reagent (Life Technologies, CA, USA), with subsequent random sampling for quantitative reverse transcription PCR validation. The amplification reactions were executed on the Applied Biosystems 7500 Fast platform using BlazeTaq SYBR Green qPCR master mix (GeneCopoeia, Guangzhou, China), following standardized thermal cycling protocols. Each RNA sample was evaluated in three independent experiments. For the study, the HK2 cell line served as the normal control, while 769-P and 786-O represented the tumor cell lines. Primer sequences for the DRFs are provided in Table S1, and their relative expression levels were determined using the 2ˆ(-ΔΔCt) method.
We examined the protein expression of DRFs by comparing KIRC tumor tissues with normal tissues. Data for this comparison was accessed from the HPA database (https://www.proteinatlas.org/).
Results
3
Selection of DRFs signature in KIRC patients
3.1
The framework is summarized in Fig. 1. Pearson correlation analysis identified 341 DRFs (Fig. 2B), followed by the generation of protein-protein interaction (PPI) network to map functional relationships among these DRFs (Fig. 2A). patients’ information is detailed in Table 1. Through univariate Cox regression, 52 DRFs were further screened as prognostically significant (Table S2). The hazard ratio of these 52 DRFs are displayed in Fig. S1A. Subsequent LASSO analysis revealed 8 DRFs (Fig. 2C–D), and we further refined our selection using multivariate Cox regression analysis, ultimately identifying 5 of the most significant DRFs (Table S3). Subsequently, we examined the correlation of these 5 DRFs (Fig. S1C).Fig. 1. Flowchart of the entire study design.Fig. 1. Fig. 2Screening for DRFs. PPI network of DRFs (A); Correlation between ferroptosis-related genes and disulfidptosis genes (B); Genes were screened using the LASSO algorithm (C–D).Fig. 2. Table 1Clinical information of the patients in the test and training groups.Table 1. CharacteristicsTrain cohort (n = 265)Test cohort (n = 264)Entire cohort (n = 529)n%n%n%Age ≤6517264.9117666.6734865.78 >659335.098833.3318134.22Status Alive17465.6618268.9435667.3 Dead9134.348231.0617332.7Gender Female9435.479134.4718534.97 Male17164.5317365.5334465.03Stage Stage I13049.0613350.3826349.72 Stage II2810.572910.985710.78 Stage III6022.646323.8612323.25 Stage IV4617.353714.028315.68Unknow10.3820.7630.57T stage T113350.1913651.5226950.85 T23412.833513.266913.04 T39234.728833.3318034.03 T462.2651.89112.08M stage M020276.2321882.5842079.4 M14617.363312.57914.93 Unknow176.41134.92305.67N stage N011643.7712346.5923945.18 N141.51124.55163.02 Unknow14554.7212948.8627451.8Race White22986.4223187.546086.96 Black or African American2810.57269.855410.21 Asian51.8931.1481.51 Unknow31.1241.5171.32Abbreviations: T stage: Tumor stage; N stage: Node stage; M stage: metastasis stage.
Building and validating the prognostic model
3.2
Using the expression levels of five DRFs, we computed individual risk scores. Risk score = coefficient (EPAS1) × expression (EPAS1) + coefficient (GOT1) × expression (GOT1) + coefficient (RRM2) × expression (RRM2) + coefficient (SLC2A6) × expression (SLC2A6) + coefficient (SLC40A1) × expression (SLC40A1). Table 2 presents the patient information for both the HG and LG. We tested the survival rates of the HG and LG across different cohorts. High-risk patients showed markedly worse survival versus low-risk group with robust predictive accuracy (Fig. 3A–C).Table 2. Clinical information for 529 patients in different risk categories.Table 2. CharacteristicsHigh-risk group (n = 267)Low-risk group (n = 262)n%n%Age ≤6517264.4217667.18 >659535.588632.82Status Alive14152.8121582.06 Dead12647.194717.94Gender Female8832.969737.02 Male17967.0416562.98Stage Stage I9635.9616763.74 Stage II2810.492911.07 Stage III8130.344216.03 Stage IV6022.46238.78 Unknow20.7510.38T stage T19937.0817064.89 T23713.863212.21 T312245.695822.14 T493.3720.76M stage M019673.4122485.5 M15721.35228.4 Unknow145.24166.1N stage N013048.6910941.5 N1134.8731.15 Unknow12446.4415057.25Race White23588.0122585.88 Black or African American259.362911.07 Asian41.541.53 Unknow31.1341.52Abbreviations: T stage: Tumor stage; N stage: Node stage; M stage: metastasis stage.Fig. 3. The prognostic effect was validated in three groups. Survival curves in high-risk and low-risk groups (A–C) and ROC between high-risk and low-risk groups (D–F).Fig. 3
Time-dependent ROC analysis demonstrated robust prognostic performance across all cohorts. In the training group, the model achieved AUC values of 0.767 (1-year), 0.744 (3-year), and 0.753 (5-year). Comparable predictive accuracy was observed in the test group, with 1-year, 3-year, and 5-year AUCs of 0.709, 0.682, and 0.735, respectively. When analyzed as a combined cohort, the integrated AUCs remained stable at 0.734 (1-year), 0.715 (3-year), and 0.744 (5-year), underscoring the model generalizability (Fig. 3D–F). Additionally, various visualizations-including DRFs expression profiles (Fig. S2A–C), risk curves (Fig. S2D–F), risk distribution maps (Fig. S2G–I), and scatter plots (Fig. S2J–L)-The combinatorial signature demonstrated robust prognostic value across validation phases.
Univariable cox regression identified four independent factors with statistical significance: age (HR = 1.08, P = 0.008), disease stage (HR = 2.34, P < 0.001), risk score (HR = 1.92, P = 0.002), and tumor grade (HR = 1.55, P = 0.019). Intriguingly, gender showed no significant association with survival outcomes (P = 0.432) (Fig. 4E). Importantly, multivariable analysis confirmed that age (HR = 1.05, P = 0.038), disease stage (HR = 2.17, P = 0.003), and risk score (HR = 1.76, P = 0.011) retained their statistical significance after adjusting for confounding variables (Fig. 4F).Fig. 4PCA and independent prognostic analysis of biomarkers. PCA based on all genes (A), disulfidptosis-related genes (B), ferroptosis-related genes (C), and DRFs signature (D); Univariate (E) and multivariate (F) independent prognostic analyses.Fig. 4
The heatmap related to the clinical data and risk group (Fig. S3A), as well as the survival curves of patients under various clinical conditions (Fig. 5), demonstrate the importance of predictive ability. PFS analysis demonstrated significantly prolonged progression-free survival in the low-risk group compared to the high-risk cohort (Fig. S11).Fig. 5. Model validation under other clinical features. Survival analysis based on different clinical characteristics (A–F).Fig. 5
Overall survival prediction nomogram
3.3
A scatterplot (Fig. S3C) demonstrated the correlation between tumor stage and risk score. Although age appears to contribute to an increased risk score, its association was not statistically significant (P = 0.25) (Fig. S3B). Both DCA (Fig. 6A) curve and ROC showed good predictive ability of the model. Risk AUC, nomogram AUC, age AUC, gender AUC, and stage AUC in the ROC curve were 0.743, 0.765, 0.597, 0.487, and 0.723, respectively (Fig. 6C). Additionally, we developed a risk estimator for tumor patients incorporating age, risk score, gender, and tumor stage (Fig. 6B), which was validated with patient data and showed robust performance (Fig. S4). The nomogram with risk score (Fig. 6D) demonstrated significant predictive value than nomogram without the risk score (Fig. 6E).Fig. 6. Build a nomogram. Decision curve analysis across different clinical characteristics (A); A nomogram that combines gender, age, period, and risk (B); ROC curves for various clinical features (C); Nomograms for patients with and without risk factors (D–E).Fig. 6
KEGG and GSEA enrichment analysis
3.4
We use KEGG analysis to revealed that DRFs are linked to several key pathways, including cytokine–cytokine receptor interactions, the TGF–beta pathway, the PI3K–Akt pathway, coagulation cascades, and interactions between viral proteins and cytokine receptors (Fig. S5). Meanwhile, GSEA indicated that various gene sets are enriched in different pathways. Specifically, in the HG, KEGG analysis showed important enrichment in pathways such as cytokine receptor interactions, complement and coagulation cascades, cytochrome P450-mediated drug metabolism, and lupus erythematosus (Fig. S6). Detailed pathway information is provided in Table S4.
TMB analysis
3.4.1
Mutational Landscape and Survival Implications. TMB was elevated in the HG compared to the LG (P = 0.0037) (Fig. 7A). Analysis of the top 15 mutated genes across risk subgroups (Fig. 7B–C) revealed distinct mutational profiles: HG: SETD2 (15 %), VHL (41 %), TTN (17 %), PBRM1 (37 %) and BAP1 (16 %).LG: VHL (42 %), PBRM1 (37 %), TTN (16 %), SETD2 (8 %), and MUC16 (7 %).Kaplan-Meier survival curves stratified by mutational burden (Fig. 7D–E) demonstrated that elevated TMB correlated with reduced survival outcomes (P < 0.05).Fig. 7. Tumor mutation burden across different risk groups. Mutational burden in different groups (A); Mutations in the high-risk group (B); Mutations in the low-risk group (C); Survival analysis of varying mutation burdens in high and low-risk groups (D); Survival analysis of different mutation groups (E).Fig. 7
TME analysis
3.4.2
We calculated three immunization scores using TME analysis and found that the HG scored higher than the LG in both the immune score and the estimate core and was statistically significant (Fig. 8A). Multi-algorithm deconvolution revealed significant risk score-immunocyte correlations (Fig. 8B). Distinct immune microenvironment patterns were observed between risk stratifications (Fig. 8C). The high-risk cohort demonstrated significant enrichment of cytotoxic (CD8^+^ T cells, P < 0.05) and pro-inflammatory lymphocyte subsets, including activated CD4^+^ memory T cells (P < 0.01), follicular helper T cells (P < 0.001), along with immunosuppressive components (Tregs, P < 0.001; M0 macrophages, P < 0.001). In comparison, LG showed predominant infiltration of immune surveillance effectors: resting CD4^+^ memory T cells (P < 0.001) and NK cells (P < 0.01), complemented by anti-inflammatory myeloid populations (M1 macrophages and monocytes, both P < 0.01) alongside quiescent dendritic (P < 0.01). Fig. S7 illustrates the associations among immune cell profiles and prognostic risk stratification.Fig. 8. For the analysis of the immune microenvironment. Violin plots showing the differences in immune scores, stromal scores, and ESTIMATE scores among different risk subgroups (A); the correlation between immune cells and risk scores (B); the proportions of 22 immune cell types in the two subgroups as determined by the CIBERSORT algorithm (C); single-sample gene set enrichment analysis (D). ∗p < 0.05, ∗∗p < 0.01, ∗∗∗p < 0.001.Fig. 8
High-risk KIRC patients exhibited a functionally paradoxical immune microenvironment characterized by concurrent activation of antitumor mechanisms and adaptive immunosuppression (Fig. 8D). These cases demonstrated enhanced antigen presentation through activated dendritic cells (aDCs, P < 0.001) and amplified APC co-stimulation (P < 0.05), coupled with elevated cytolytic activity (P < 0.001) and CCR-mediated chemotaxis (P < 0.001). Paradoxically, this pro-inflammatory state - marked by heightened HLA expression (P < 0.05), type I IFN responses (P < 0.01), and Th1/Th2/Tfh cell infiltration (P < 0.001) - coexisted with T cell exhaustion signatures, evidenced by co-elevated co-stimulatory/inhibitory checkpoints (P < 0.001). Simultaneously, critical immunoregulatory functions were suppressed, including impaired iDC maturation (P < 0.01), attenuated type II IFN signaling (P < 0.001), and mast cell dysfunction (P < 0.001). This dual activation/suppression pattern suggests evolved immune evasion through macrophage-driven chronic inflammation (IL-6/IL-1β axis) and PD-1/STAT1-mediated TIL exhaustion, while compromised antiviral responses facilitate tumor immunoediting.
Benefits of model in the treatment of KIRC
3.5
HG with DRFs exhibit persistent T cell dysfunction and consistently high TIDE scores (Fig. S8). This may indicate that tumors in the HG are more likely to demonstrate immune evasion, making treatment more challenging. In the HG, the anti-tumor drugs to which tumors are sensitive are listed in Table S5. In LG, tumors exhibit sensitivity to a range of anti-tumor drugs that operate through diverse mechanisms of action, as detailed in Table S6. Anti-tumor drugs with no significant sensitivity differences between groups are presented in Table S7.
Discussion
4
Renal malignancies constitute a major global health concern, representing a leading contributor to cancer-related morbidity worldwide. Given its high mortality rate, it is crucial to continue exploring new treatment strategies for kidney cancer to improve patient outcomes and survival rates. Emerging research suggests that disulfidptosis and ferroptosis are crucial in the progression of tumors, influencing various aspects of tumor biology and development [4,5]. Despite their significance, no prognostic model incorporating these mechanisms has been established for KIRC. Our findings reveal that the nomogram derived from this model demonstrates robust predictive performance, while drug sensitivity analysis provides valuable insights for tailoring tumor treatments.
The disulfidptosis-related genes and ferroptosis-related genes selected for our model construction were derived from validated gene sets, which screened out genes associated with other forms of cell death. The resulting model demonstrated superior prognostic accuracy compared to traditional clinical staging systems. In our study, we employed a range of algorithms, including LASSO, to identify key biomarkers. The results of the model revealed that HG had lower survival rates than the LG. We developed a nomogram, which proved to be an effective and reliable tool for predicting patient survival outcomes. Ma X et al. created the prognostic model using disulfidptosis and ferroptosis-related genes, which was validated for its prognostic value in lung adenocarcinoma [6]. Similarly, Xu L et al. developed a prognostic model incorporating disulfidptosis and ferroptosis, which yielded promising results in breast cancer [18]. These findings, along with others, highlight the strong predictive potential of prognostic models based on disulfidptosis and ferroptosis, demonstrating their valuable role in cancer prognosis.
Among DRFs that we selected to build the prognostic model, EPAS1 expression is influenced by super-enhancers [19]. In breast cancer treatment, RRM2 is upregulated and contributes to resistance against GTI-2040, tamoxifen, Adriamycin, and cisplatin [20]. Kremer DM et al. have demonstrated that exogenous cysteine can selectively exploit GOT1-knockdown cells and tumors. This metabolic reprogramming can be leveraged through dietary means, which has significant implications for the nutrient landscape within pancreatic tumors [21]. Role of SLC40A1 in Iron Homeostasis and HCC Pathogenesis. As the primary cellular iron exporter, SLC40A1 critically regulates intracellular iron homeostasis, a process implicated in tumorigenesis across multiple cancer types. In hepatocellular carcinoma (HCC), iron overload is a recognized oncogenic driver: excess hepatic iron accumulation drives oxidative damage and genomic instability via iron-dependent enzyme dysregulation (e.g., mitochondrial respiration, lipid metabolism) [22]. This mechanistic link positions SLC40A1 as a potential modulator of HCC progression through iron efflux capacity. Our DRFs prognostic model demonstrated robust prognostic accuracy in patient cohorts, outperforming traditional clinicopathological metrics. This improvement underscores its translational potential for risk-stratified clinical management. The GSEA results can also provide clues about the mechanisms by which DRFs exert their effects on KIRC. The coagulation cascades may promote cancer growth and metastasis [23]. Recent evidence suggests that a hypercoagulable state is not merely a secondary effect caused by the presence of a tumor, but rather actively promotes the development and dissemination of the tumor. Epigenetic regulation angle Emerging evidence indicates that CYP1B1 overexpression is mechanistically involved in RCC tumorigenesis [24]. Analysis of the TME in KIRC patients demonstrated that infiltration of CD8^+^ T cells in high-risk samples correlates with poorer prognosis. This suggests that CD8^+^ T cells could serve as a promising target for immunotherapy, offering a potential therapeutic approach for improving patient outcomes. This finding offers valuable insights for identifying future immunotherapy targets in KIRC.
Drug sensitivity profiling pinpointed PI3K and cell cycle pathways as key vulnerability nodes, critical for regulating oncogenic proliferation-metabolism coupling. They represent potential targets for developing personalized treatment for KIRC. The mTOR pathway is often hyperactivated in cancer cells, making the inhibition of mTOR signaling a promising and effective approach for molecular targeted therapy in human cancers. The PI3K/mTOR and cell cycle pathways are crucial regulators of KIRC cell biology. Targeting these pathways could offer new opportunities for personalized treatment strategies.
Our study presents several notable strengths. First and foremost, we introduced a novel predictive model-a method that has not been reported before—which distinguishes our work from previous studies. For instance, while Feng X et al. constructed a robust model to forecast lymph node metastasis in kidney cancer [25], their study did not incorporate TMB analysis or investigate anticancer drug selection. In contrast, our research not only includes TMB analysis but also provides a detailed classification of anticancer drugs deemed critical for both HG and LG. Moreover, unlike the KIRC model presented by Li L et al. [26], we validated the key genes expression to construct our risk score via RT-qPCR-a step they did not undertake. Similarly, compared to the copper poisoning-related gene model from Mei W et al. [27], our risk score underwent more extensive validation using an external dataset, thereby yielding more reliable results. Moreover, our model demonstrated good predictive value, with an AUC of 0.765, surpassing the 0.750 AUC reported by Zhang L et al. [28]. However, we should acknowledge notable limitations in this study. While RT-PCR validation confirmed differential expression of signature genes between tumor and normal cell lines, further experimental validation of the model's biological mechanisms remains essential. Additionally, independent validation in prospective clinical cohorts is required to establish its clinical utility.
Conclusion
5
Overall, we combined the genes of dual-stream death and ferroptosis to construct a risk model and a nomogram. It has good predictive power and guidance for treatment. Worse outcomes in the HG may be linked to transmembrane transport functions and a higher TMB. However, due to various limitations, more clinical controlled studies are needed to clarify the model's value in drug sensitivity. Although clinical trials are planned to validate the model's predictive robustness, confirmatory bench experiments are critically needed to decipher its underlying biological mechanisms governing patient outcomes.
Informed consent
For this type of study formal consent is not required.
Ethics approval and consent
This article does not contain any studies with human participants or animals performed by any of the authors.
Availability of data and material
Data is provided within the manuscript or supplementary information files.
Funding
This study was Project supported by 10.13039/501100004479Jiangxi Provincial Natural Science Foundation (Grant number: 20212BAB206050), and Science and Technology Plan of Jiangxi Provincial Administration of Traditional Chinese Medicine (Grant number: 2022A360). Role of the Funding: The funding had no role in the design and conduct of the study; collection, management, analysis, and interpretation of the data; preparation, review, or approval of the manuscript; and decision to submit the manuscript for publication.
Declaration of competing interest
The authors declare that they have no known competing financial interests or personal relationships that could have appeared to influence the work reported in this paper.
The reference list from the paper itself. Each links out to its DOI / PubMed record.
- 1Siegel R.L.Kratzer T.B.Giaquinto A.N.Sung H.Jemal A.Cancer statistics, 2025 CA Cancer J. Clin.751202510453981767910.3322/caac.21871 PMC 11745215 · doi ↗ · pubmed ↗
- 2Motzer R.J.Jonasch E.Agarwal N.Alva A.Bagshaw H.Baine NCCN guidelines® insights: Kidney cancer, version 2.2024 J. Natl. Compr. Cancer Netw.221202441610.6004/jnccn.2024.000838394781 · doi ↗ · pubmed ↗
- 3Klatte T.Rossi S.H.Stewart G.D.Prognostic factors and prognostic models for renal cell carcinoma: a literature review World J. Urol.36122018194319522971375510.1007/s 00345-018-2309-4 · doi ↗ · pubmed ↗
- 4Liu X.Nie L.Zhang Y.Yan Y.Wang C.Colic M.Actin cytoskeleton vulnerability to disulfide stress mediates disulfidptosis Nat. Cell Biol.25320234044143674708210.1038/s 41556-023-01091-2PMC 10027392 · doi ↗ · pubmed ↗
- 5Jiang X.Stockwell B.R.Conrad M.Ferroptosis: mechanisms, biology and role in disease Nat. Rev. Mol. Cell Biol.22420212662823349565110.1038/s 41580-020-00324-8PMC 8142022 · doi ↗ · pubmed ↗
- 6Ma X.Deng Z.Li Z.Ma T.Li G.Zhang C.Leveraging a disulfidptosis/ferroptosis-based signature to predict the prognosis of lung adenocarcinoma Cancer Cell Int.23120232673794618110.1186/s 12935-023-03125-z PMC 10634118 · doi ↗ · pubmed ↗
- 7Zhang C.Xu T.Ji K.Cao S.Ai J.Pan J.Development and experimental validation of a machine learning-based disulfidptosis-related ferroptosis score for hepatocellular carcinoma Apoptosis 291–220241031203787564710.1007/s 10495-023-01900-x · doi ↗ · pubmed ↗
- 8Zhang X.Hong B.Li H.Sun Z.Zhao J.Li M.Disulfidptosis and ferroptosis related genes define the immune microenvironment and NUBPL serves as a potential biomarker for predicting prognosis and immunotherapy response in bladder cancer Heliyon 10172024 e 3763810.1016/j.heliyon.2024.e 37638 PMC 1140708839290277 · doi ↗ · pubmed ↗