Gut Microbiota Mediate Periampullary Cancer Through Extracellular Matrix Proteins: A Causal Relationship Study
Zeying Cheng, Liqian Du, Hongxia Zhang, Zhongkun Zhou, Yunhao Ma, Baizhuo Zhang, Lixue Tu, Tong Gong, Zhenzhen Si, Hong Fang, Jianfang Zhao, Peng Chen

TL;DR
This study shows that gut bacteria may cause periampullary cancer through extracellular matrix proteins and identifies potential new drugs for treatment.
Contribution
The study establishes a causal link between gut microbiota and periampullary cancer via extracellular matrix proteins.
Findings
Nine gut microbial taxa were found to be associated with periampullary cancer risk.
Extracellular matrix proteins like Collagen alpha-1(I) chain and Laminin may mediate the microbiota-cancer link.
27 potential therapeutic drugs for periampullary cancer were identified using the Connectivity Map.
Abstract
Recent studies have reported that gut microbiota may play a role in the occurrence and development of digestive system cancers. Periampullary cancer is a relatively rare digestive system cancer which lacks effective targeted therapy and specific drugs. The purpose of this study is to elucidate the relationship between periampullary cancer and gut microbiota. This work collected public genome‐wide association study (GWAS) data from 211 gut microbial taxa and three types of cancer related to periampullary cancer, which were used for two‐sample Mendelian randomisation (MR) analysis. Based on the analysis of differentially expressed genes between periampullary cancer and adjacent normal tissue, extracellular matrix proteins were selected for further multivariable MR analysis. Finally, the Connectivity Map was used to screen potential therapeutic drugs for periampullary cancer. Two‐sample MR…
Genes, proteins, chemicals, diseases, species, mutations and cell lines named across the full text — each resolved to its canonical identifier and authoritative record.
Click any figure to enlarge with its caption.
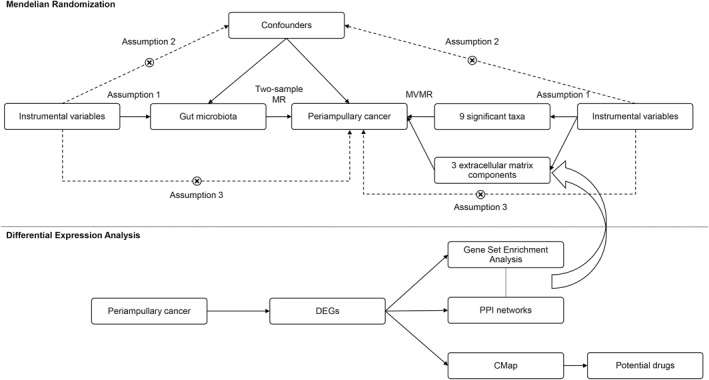 FIGURE 1
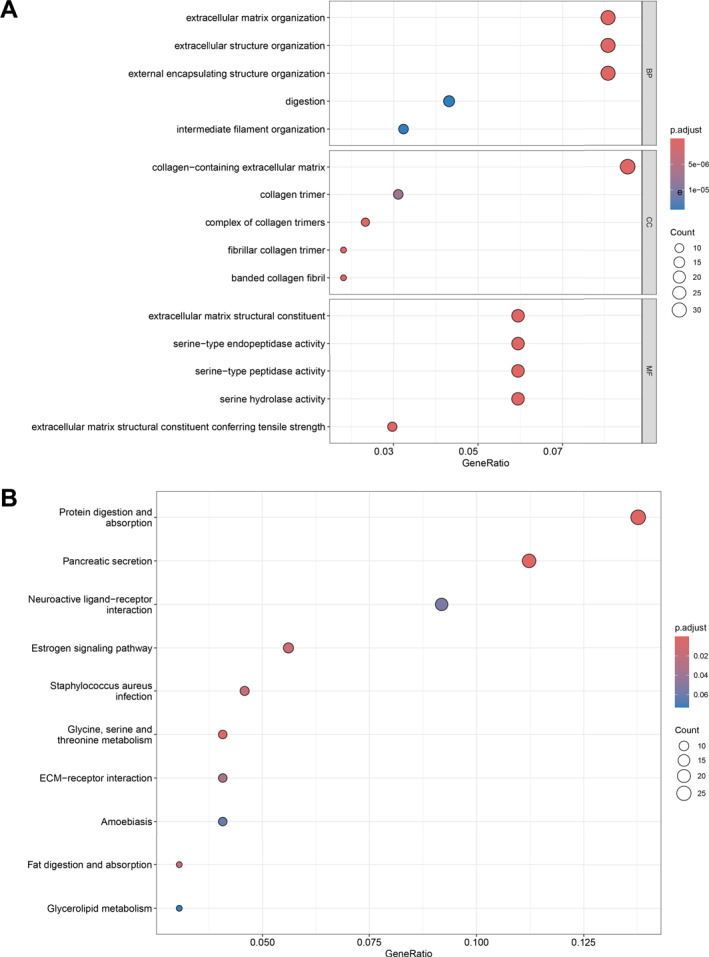 FIGURE 2
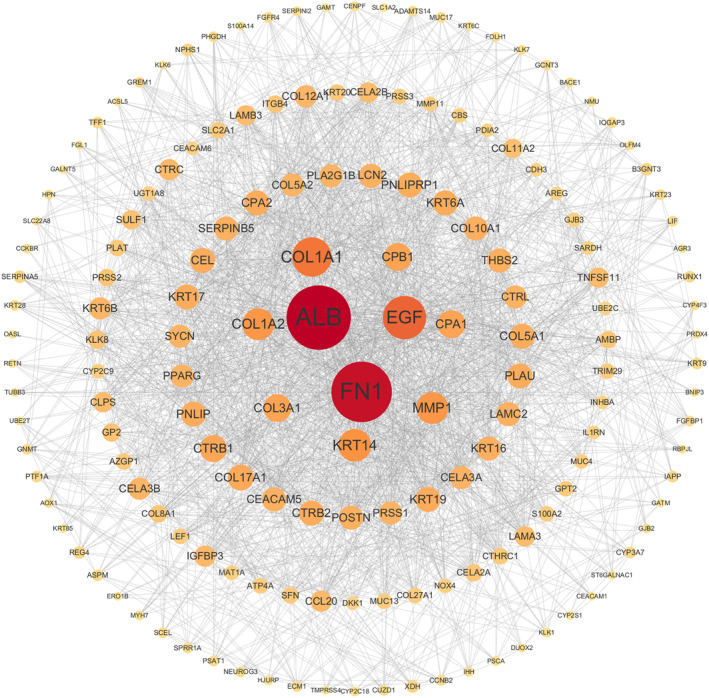 FIGURE 3
| Data type | Trait | Data source | Sample size | Doi | Population | Year | |
|---|---|---|---|---|---|---|---|
| GWAS | Gut microbiota | Phylum | MiBioGen | 18,340 |
| European ( | 2021 |
| Class | |||||||
| Order | |||||||
| Family | |||||||
| Genus | |||||||
| Periampullary cancer | Biliary tract cancer | FinnGen | 174,115 |
| European | 2021 | |
| Pancreatic cancer | 180,829 | 2021 | |||||
| Small intestine cancer | 180,959 | 2021 | |||||
| ECM protein | Collagen alpha‐1(I) chain | Sun et al. | 3301 |
| European | 2018 | |
| Laminin | |||||||
| Mucin | |||||||
| Fibronectin | Suhre et al. | 1338 |
| European | 2019 | ||
| Gene expression profiles | Periampullary cancer | PDAC | Sandhu et al. | 85 |
| European | 2014 |
| Biliary tract cancer | |||||||
| Pancreatobiliary type ampullary cancer | |||||||
| Intestinal type ampullary cancer | |||||||
| Duodenum cancer | |||||||
| Adjacent normal samples | |||||||
| Exposure | Outcome | Method | SNP (N) |
| OR | OR_lci95 | OR_uci95 |
|---|---|---|---|---|---|---|---|
|
| Pancreatic cancer | Inverse variance weighted | 13 | 0.0080 | 0.3909 | 0.1952 | 0.7828 |
|
| 5 | 0.0117 | 2.3309 | 1.2070 | 4.5015 | ||
| Rikenellaceae | 20 | 0.0142 | 0.5221 | 0.3105 | 0.8778 | ||
|
| Biliary tract cancer | 13 | 0.0011 | 3.9394 | 1.7259 | 8.9920 | |
|
| 5 | 0.0075 | 5.2737 | 1.5601 | 17.8270 | ||
|
| 14 | 0.0085 | 3.9483 | 1.4191 | 10.9853 | ||
| Lachnospiraceaeucg010 | 10 | 0.0094 | 7.5714 | 1.6447 | 34.8542 | ||
|
| Intestine cancer | 11 | 0.0017 | 0.3950 | 0.2211 | 0.7055 | |
|
| 12 | 0.0143 | 0.3503 | 0.1514 | 0.8109 |
| Exposure | Outcome | SNP (N) |
|
|
|
|
|---|---|---|---|---|---|---|
|
| Pancreatic cancer | 13 | 0.4346 | 0.3629 | 0.7380 | 0.4567 |
|
| 5 | 0.6809 | 0.5865 | 0.5876 | 0.5777 | |
| Rikenellaceae | 20 | 0.3822 | 0.3214 | 0.9733 | 0.1523 | |
|
| Biliary tract cancer | 13 | 0.7707 | 0.9288 | 0.1044 | 0.7960 |
|
| 5 | 0.2023 | 0.1196 | 0.8217 | 0.3930 | |
|
| 14 | 0.8084 | 0.8366 | 0.2933 | 0.8663 | |
| LachnospiraceaeUCG010 | 10 | 0.4097 | 0.7045 | 0.0865 | 0.6357 | |
|
| Intestine cancer | 11 | 0.8514 | 0.8819 | 0.3144 | 0.9243 |
|
| 12 | 0.9216 | 0.9708 | 0.2089 | 0.9510 |
| Gene |
|
| logFC | Adj. |
|
|---|---|---|---|---|---|
| COL1A1 | 5.5389 | 6.5686 | 3.0544 | 7.60E‐06 | 2.78E‐07 |
| COL10A1 | 4.9216 | 4.1173 | 3.0794 | 5.81E‐05 | 3.67E‐06 |
| COL17A1 | 5.8648 | 7.9211 | 3.8236 | 2.58E‐06 | 6.72E‐08 |
| FN1 | 5.4015 | 6.0100 | 2.5001 | 1.19E‐05 | 5.00E‐07 |
| LAMA3 | 6.3930 | 10.1828 | 2.6679 | 5.22E‐07 | 6.31E‐09 |
| LAMB3 | 8.6351 | 20.3844 | 3.7225 | 2.66E‐09 | 1.50E‐13 |
| LAMC2 | 7.3891 | 14.6278 | 3.0972 | 3.53E‐08 | 6.09E‐11 |
| MUC4 | 4.7165 | 3.3394 | 2.5151 | 1.12E‐04 | 8.36E‐06 |
| MUC17 | 4.1428 | 1.2741 | 3.8463 | 6.57E‐04 | 7.52E‐05 |
| Exposure | Outcome | Method | Beta | SE |
|
|
|
|---|---|---|---|---|---|---|---|
|
| Pancreatic cancer | MVMR_IVW | −0.0067 | 0.7183 | 0.9925 | 0.0920 | |
| MVMR_Egger | −0.8296 | 0.9217 | 0.3681 | 0.1690 | 0.1275 | ||
|
| MVMR_IVW | 0.9356 | 0.7324 | 0.2014 | 0.0480 | ||
| MVMR_Egger | 1.7831 | 0.8883 | 0.0447 | 0.1241 | 0.0934 | ||
| Rikenellaceae | MVMR_IVW | −0.1450 | 0.6071 | 0.8113 | 0.0646 | ||
| MVMR_Egger | −1.1055 | 0.7590 | 0.1452 | 0.0560 | 0.1492 | ||
|
| Biliary tract cancer | MVMR_IVW | 1.9163 | 0.9486 | 0.0434 | 0.8172 | |
| MVMR_Egger | 1.2743 | 1.1848 | 0.2822 | 0.3658 | 0.8176 | ||
|
| MVMR_IVW | 2.0237 | 2.9379 | 0.4909 | 0.6446 | ||
| MVMR_Egger | 2.9540 | 4.6520 | 0.5254 | 0.7965 | 0.5251 | ||
|
| MVMR_IVW | −0.6273 | 1.1313 | 0.5792 | 0.5906 | ||
| MVMR_Egger | 1.1147 | 1.4977 | 0.4567 | 0.0759 | 0.7696 | ||
| LachnospiraceaeUCG010 | MVMR_IVW | 1.1959 | 1.1452 | 0.2963 | 0.4743 | ||
| MVMR_Egger | 1.8836 | 1.6013 | 0.2395 | 0.5345 | 0.4298 | ||
|
| Intestine cancer | MVMR_IVW | −0.8890 | 0.4318 | 0.0395 | 0.4442 | |
| MVMR_Egger | −1.1606 | 0.6108 | 0.0574 | 0.5203 | 0.3996 | ||
|
| MVMR_IVW | −1.5588 | 0.9425 | 0.0981 | 0.7393 | ||
| MVMR_Egger | −0.9347 | 1.4131 | 0.5083 | 0.5534 | 0.6990 |
| Exposure | ECM components | Outcome | Method | Beta | SE |
|
|
|
|---|---|---|---|---|---|---|---|---|
|
| Collagen alpha‐1(I) chain | Pancreatic cancer | MVMR_IVW | −0.9003 | 0.3570 | 0.0117 | 0.8852 | |
| MVMR_Egger | −0.7667 | 0.5170 | 0.1381 | 0.8586 | 0.7209 | |||
| Laminin | MVMR_IVW | −0.9447 | 0.3436 | 0.0060 | 0.4755 | |||
| MVMR_Egger | −1.3915 | 0.6330 | 0.0279 | 0.4559 | 0.4005 | |||
| Fibronectin | MVMR_IVW | −0.3219 | 0.6678 | 0.6298 | 0.1526 | |||
| MVMR_Egger | −1.9227 | 1.2376 | 0.1203 | 0.2531 | 0.1359 | |||
| Mucin | MVMR_IVW | −0.8262 | 0.3997 | 0.0387 | 0.1149 | |||
| MVMR_Egger | −1.9039 | 0.6882 | 0.0057 | 0.0605 | 0.2110 | |||
|
| Collagen alpha‐1(I) chain | MVMR_IVW | 0.7793 | 0.3173 | 0.0140 | 0.9554 | ||
| MVMR_Egger | 1.1723 | 0.4212 | 0.0054 | 0.9803 | 0.1560 | |||
| Laminin | MVMR_IVW | 0.9350 | 0.3746 | 0.0126 | 0.4869 | |||
| MVMR_Egger | 1.5362 | 0.5054 | 0.0024 | 0.6921 | 0.0763 | |||
| Fibronectin | MVMR_IVW | 1.6045 | 0.8336 | 0.0542 | 0.2256 | |||
| MVMR_Egger | 1.1389 | 0.9035 | 0.2075 | 0.2437 | 0.2751 | |||
| Mucin | MVMR_IVW | 0.5438 | 0.4639 | 0.2412 | 0.0583 | |||
| MVMR_Egger | 0.7940 | 0.6361 | 0.2119 | 0.5540 | 0.0478 | |||
| Rikenellaceae | Collagen alpha‐1(I) chain | MVMR_IVW | −0.5875 | 0.2778 | 0.0344 | 0.7376 | ||
| MVMR_Egger | −0.4958 | 0.3941 | 0.2084 | 0.6979 | 0.7431 | |||
| Laminin | MVMR_IVW | −0.5550 | 0.2859 | 0.0523 | 0.3137 | |||
| MVMR_Egger | −0.7460 | 0.5033 | 0.1383 | 0.2761 | 0.6421 | |||
| Fibronectin | MVMR_IVW | −0.2268 | 0.7135 | 0.7505 | 0.0542 | |||
| MVMR_Egger | −1.9303 | 1.2087 | 0.1103 | 0.1481 | 0.0971 | |||
| Mucin | MVMR_IVW | −0.4841 | 0.3119 | 0.1207 | 0.1078 | |||
| MVMR_Egger | −1.0521 | 0.5060 | 0.0376 | 0.1582 | 0.1403 | |||
|
| Collagen alpha‐1(I) chain | Biliary tract cancer | MVMR_IVW | 1.3475 | 0.4161 | 0.0012 | 0.5889 | |
| MVMR_Egger | 1.1993 | 0.5927 | 0.0430 | 0.5396 | 0.7254 | |||
| Laminin | MVMR_IVW | 1.2896 | 0.4156 | 0.0019 | 0.8661 | |||
| MVMR_Egger | 2.1419 | 0.7336 | 0.0035 | 0.9145 | 0.1586 | |||
| Fibronectin | MVMR_IVW | 1.2914 | 0.8918 | 0.1476 | 0.7926 | |||
| MVMR_Egger | 0.6371 | 2.0335 | 0.7540 | 0.6682 | 0.7203 | |||
| Mucin | MVMR_IVW | 1.3673 | 0.4108 | 0.0009 | 0.8795 | |||
| MVMR_Egger | 0.9943 | 0.6802 | 0.1438 | 0.4913 | 0.8646 | |||
|
| Collagen alpha‐1(I) chain | MVMR_IVW | 1.3321 | 0.4984 | 0.0075 | 0.2735 | ||
| MVMR_Egger | 1.8791 | 0.8179 | 0.0216 | 0.2583 | 0.3954 | |||
| Laminin | MVMR_IVW | 1.6391 | 0.5813 | 0.0048 | 0.3542 | |||
| MVMR_Egger | 3.5209 | 1.6165 | 0.0294 | 0.4053 | 0.2150 | |||
| Fibronectin | MVMR_IVW | 1.7296 | 1.1228 | 0.1234 | 0.8435 | |||
| MVMR_Egger | 1.0740 | 1.6265 | 0.5091 | 0.8626 | 0.5774 | |||
| Mucin | MVMR_IVW | 1.3609 | 0.4854 | 0.0051 | 0.3912 | |||
| MVMR_Egger | 1.1255 | 1.0251 | 0.2722 | 0.7903 | 0.3018 | |||
|
| Collagen alpha‐1(I) chain | MVMR_IVW | 0.8667 | 0.5487 | 0.1142 | 0.7198 | ||
| MVMR_Egger | 1.4667 | 0.7359 | 0.0463 | 0.7507 | 0.2211 | |||
| Laminin | MVMR_IVW | 1.2737 | 0.5351 | 0.0173 | 0.8991 | |||
| MVMR_Egger | 1.7735 | 0.8447 | 0.0358 | 0.8907 | 0.4444 | |||
| Fibronectin | MVMR_IVW | 1.1492 | 0.9420 | 0.2225 | 0.3994 | |||
| MVMR_Egger | 0.0039 | 2.1497 | 0.9985 | 0.3264 | 0.5477 | |||
| Mucin | MVMR_IVW | 1.4055 | 0.5545 | 0.0112 | 0.7888 | |||
| MVMR_Egger | 1.1895 | 0.8929 | 0.1828 | 0.7577 | 0.7424 | |||
| LachnospiraceaeUCG010 | Collagen alpha‐1(I) chain | MVMR_IVW | 1.5554 | 0.8893 | 0.0803 | 0.2992 | ||
| MVMR_Egger | 2.0510 | 1.1828 | 0.0829 | 0.2704 | 0.5173 | |||
| Laminin | MVMR_IVW | 1.8498 | 0.7521 | 0.0139 | 0.7432 | |||
| MVMR_Egger | 1.3539 | 1.2507 | 0.2790 | 0.6997 | 0.6197 | |||
| Fibronectin | MVMR_IVW | 1.6704 | 1.2999 | 0.1988 | 0.3369 | |||
| MVMR_Egger | 1.3934 | 2.8993 | 0.6308 | 0.2244 | 0.9121 | |||
| Mucin | MVMR_IVW | 1.8608 | 0.7439 | 0.0124 | 0.5846 | |||
| MVMR_Egger | 1.8684 | 1.1699 | 0.1102 | 0.9933 | 0.5196 | |||
|
| Collagen alpha‐1(I) chain | Intestine cancer | MVMR_IVW | −0.7016 | 0.3000 | 0.0194 | 0.7176 | |
| MVMR_Egger | −1.2052 | 0.4448 | 0.0067 | 0.7974 | 0.1252 | |||
| Laminin | MVMR_IVW | −0.9064 | 0.2904 | 0.0018 | 0.6409 | |||
| MVMR_Egger | −0.1590 | 0.5771 | 0.7830 | 0.7355 | 0.1340 | |||
| Fibronectin | MVMR_IVW | −1.2517 | 0.4152 | 0.0026 | 0.5268 | |||
| MVMR_Egger | −1.9047 | 0.8229 | 0.0206 | 0.5086 | 0.3580 | |||
| Mucin | MVMR_IVW | −0.9155 | 0.3115 | 0.0033 | 0.3311 | |||
| MVMR_Egger | −0.1147 | 0.5775 | 0.8425 | 0.1053 | 0.4307 | |||
|
| Collagen alpha‐1(I) chain | MVMR_IVW | −1.0382 | 0.4644 | 0.0254 | 0.8624 | ||
| MVMR_Egger | −1.9418 | 0.6885 | 0.0048 | 0.9419 | 0.0754 | |||
| Laminin | MVMR_IVW | −1.0913 | 0.4619 | 0.0181 | 0.7462 | |||
| MVMR_Egger | −0.1982 | 0.8368 | 0.8128 | 0.7942 | 0.2006 | |||
| Fibronectin | MVMR_IVW | −0.5254 | 0.7209 | 0.4661 | 0.5206 | |||
| MVMR_Egger | −1.1727 | 1.2486 | 0.3476 | 0.4338 | 0.5255 | |||
| Mucin | MVMR_IVW | −1.1575 | 0.4344 | 0.0077 | 0.6279 | |||
| MVMR_Egger | 0.1067 | 0.7610 | 0.8885 | 0.0431 | 0.8134 |
| Name | Score | Description | Development stage | Indication |
|---|---|---|---|---|
| ZG‐10 | −0.9697 | JNK inhibitor | Preclinical | Not applicable |
| LY‐303511 | −0.9648 | Casein kinase inhibitor | Preclinical | Not applicable |
| TG‐101348 | −0.9634 | FLT3 inhibitor | Approved | Primary myelofibrosis |
| PIK‐75 | −0.9538 | DNA protein kinase inhibitor | Preclinical | Not applicable |
| Acadesine | −0.9537 | AMPK activator | Phase 3 | Cardiovascular diseases |
| ISOX | −0.9492 | HDAC inhibitor | Preclinical | Not applicable |
| CGP‐60474 | −0.9460 | CDK inhibitor | Preclinical | Not applicable |
| KIN001‐220 | −0.9440 | Aurora kinase inhibitor | Preclinical | Not applicable |
| THM‐I‐94 | −0.9341 | HDAC inhibitor | Preclinical | Not applicable |
| Bisindolylmaleimide‐ix | −0.9219 | CDK inhibitor | Preclinical | Not applicable |
| Digitoxigenin | −0.9094 | ATPase inhibitor | Preclinical | Not applicable |
| Alvocidib | −0.8908 | CDK inhibitor | Phase 3 | Multiple myeloma |
| Sarmentogenin | −0.8627 | ATPase inhibitor | Preclinical | Not applicable |
| Gatifloxacin | −0.8619 | Bacterial DNA gyrase inhibitor | Approved | Bacterial infections |
| Vorinostat | −0.8615 | HDAC inhibitor | Approved | Lymphoma, T‐Cell |
| Azithromycin | −0.8592 | Bacterial 50S ribosomal subunit inhibitor | Approved | Conjunctivitis, bacterial |
| XMD‐1150 | −0.8579 | Leucine rich repeat kinase inhibitor | Preclinical | Not applicable |
| Panobinostat | −0.8562 | HDAC inhibitor | Approved | Multiple myeloma |
| PF‐562271 | −0.8513 | Focal adhesion kinase inhibitor | Preclinical | Not applicable |
| Idarubicin | −0.8459 | Topoisomerase inhibitor | Approved | Leukaemia, myeloid, acute |
| Scriptaid | −0.8443 | HDAC inhibitor | Preclinical | Not applicable |
| Verrucarin‐a | −0.8434 | Protein synthesis inhibitor | Preclinical | Not applicable |
| JNK‐9L | −0.8395 | JNK inhibitor | Preclinical | Not applicable |
| BI‐2536 | −0.8189 | PLK inhibitor | Phase 2 | Carcinoma, nonsmall‐cell lung |
| Cefotaxime | −0.8187 | Bacterial cell wall synthesis inhibitor | Approved | Bacterial infections |
| Alfadolone | −0.8080 | GABA receptor agonist | Phase 2 | Anaesthetic |
| Mitoxantrone | −0.8078 | Topoisomerase inhibitor | Approved | Prostatic neoplasms |
- —Gansu Provincial Science and Technology Major Project
- —Lanzhou Municipal Science and Technology Program
- —College Students' Innovation and Entrepreneurship Program of Lanzhou University, China
Peer Reviews
No public reviews on file for this paper yet. If you reviewed it on a platform where reviews are public (OpenReview, ICLR, NeurIPS, ICML), you can paste yours below so the community can read it here.
Videos
No videos yet. Explain this paper in a talk, walkthrough, or lecture? Add one.
Taxonomy
TopicsGut microbiota and health · RNA modifications and cancer · Cancer-related molecular mechanisms research
Introduction
1
Periampullary cancer is a malignant tumour that originates within 2 cm of the ampulla of Vater [1], including four different cancers: ampulla of Vater cancer, distal bile duct cancer, pancreatic head cancer, and duodenal cancer [2]. Periampullary cancer is a rare digestive tract tumour accounting for approximately 5% of all gastrointestinal tract malignancies [3]. Most of the periampullary cancers are pancreatic (50%–75%), followed by ampullary (10%–20%), biliary (10%–20%), and duodenal (3%–7%) [4]. Because of different types, the prognosis of periampullary cancer varies and different treatment plans should be adopted. However, due to the low incidence rate of this cancer, the difficulties in obtaining clinical samples lead to the inadequacy of relevant research. Currently, only pancreatoduodenectomy can be used as the standard treatment [5] and there is no consensus on chemotherapy and radiation therapy methods [6]. As for targeted therapy, there are also few research reports and no specific therapeutic drugs available [7, 8, 9, 10].
In recent years, the regulatory role of gut microbiota on tumours has attracted increasing attention. The dysbiosis of gut microbiota can lead to the occurrence of cancer and gut microbiota can regulate tumour activity to interfere with drug efficacy [11]. Based on this, by screening key microbes, we can pave new avenues for the development of cancer diagnosis and treatment methods. Research on the association between colorectal cancer and gut microbiota is the most in‐depth, the gut microbiota is considered a biomarker for colorectal cancer and is used to construct microbial diagnostic models [12]. In addition, faecal microbiota transplantation, probiotic strains, prebiotics, and synbiotics have also been used for the treatment of colorectal cancer [13]. Moreover, gastric cancer is also a well‐known cancer significantly associated with microbiota and Helicobacter pylori infection is an important carcinogenic factor [14]. Besides gastrointestinal tumours, gut microbiota can also have an impact on cancer in other parts of the body. Research reports showed that gut microbiota imbalance participated in breast cancer through oestrogen‐dependent and nonoestrogen‐dependent mechanisms [15]. In research on lung cancer, it also found that the microbiota within the tumour may originate from the translocation of gut microbiota [16]. Similarly, the involvement of gut microbiota was found in periampullary cancer. As a type of periampullary cancer, pancreatic ductal adenocarcinoma (PDAC) has a unique tumour microenvironment (TME) in that its dense stroma can destroy tumour vasculature and reduce blood vessel density [17]. The hypoxic microenvironment generated can lead to the block of drug delivery and the reduction of tumour immunogenicity [18]. Recent studies indicated that microbiome originally present in the gut can pass through the Oddi sphincter into the ampulla region and migrate to the pancreas [19], and they may contribute to the tumourigenesis, metastasis and prognosis of PDAC by inducing local inflammation and altering TME [20]. Precisely because there are complex interactions that exist between the microbiome and the TME, including direct contact between cancer cells and microbes as well as indirect action through signalling molecules [21]; further study of the cancer‐associated microbiome could shed new light on cancer treatment.
The extracellular matrix (ECM), a three‐dimensional structural network, is a key component of the TME and plays an important role in regulating cell and tissue function [22, 23]. ECM is composed of various structural proteins, proteoglycans, glycoproteins and glycosaminoglycans. Type I collagen is the most abundant protein in vertebrates and is a major component of the basement membrane, which is assembled into fibres to provide mechanical support for organs and tissues [24]. And collagen α1(I) is an essential component of type I collagen trimer. Laminin is one of the main glycoproteins in the basement membrane, involved in cell adhesion and migration, and closely related to tumour angiogenesis and invasion [25]. Fibronectin is an important glycoprotein in the ECM, which regulates cell adhesion, migration, proliferation, and directs the assembly of ECM proteins such as collagen and fibrillin [26, 27].
Mendelian randomisation (MR) is a method to integrate summary data of genome‐wide association study (GWAS) for predicting causality, which uses genetic variations such as single‐nucleotide polymorphism (SNPs) as instrumental variables (IVs) to avoid the impact of confounding factors. To confirm a potential link between gut microbiota and periampullary cancer, we conducted a two‐sample MR analysis. Furthermore, based on the results of Gene set enrichment analysis, Multivariable Mendelian randomisation (MVMR) was used to further explore the role of ECM proteins in this link. Finally, we tried drug repositioning using Connectivity Map (CMap). CMap is a large database established in 2006 to connect drugs, diseases and genes by common gene expression signatures [28]. A query using a set of differentially expressed genes (DEGs) that represent a biological state generates a connectivity score for each drug [29], and if the connectivity score is positive, the small molecule drug promotes the expression of DEGs. In contrast, a negative score indicates that the expression of differential genes is suppressed, and the drug may have a certain therapeutic effect. In the field of adjuvant therapy for periampullary cancer, most studies are retrospective [30]. In the context of the association between cancer and the gut microbiota, traditional research typically employs 16S rRNA sequencing. However, due to the rarity of periampullary cancer, obtaining samples is challenging. Consequently, the limited existing studies have only reported microbiota changes in periampullary cancer patients caused by biliary drainage [31, 32]. Compared with traditional research, the above methods are not restricted by confounding factors and insufficient clinical samples to a considerable extent. Our research results provide evidence for the development of microbiome‐based diagnosis and nonsurgical treatment of periampullary cancer.
Materials and Methods
2
Study Design
2.1
To verify the possible association between gut microbiota and periampullary cancer, two‐sample MR and MVMR analyses were performed. In addition, differential expression analysis was conducted simultaneously, which guided variable selection for MVMR and suggested possible therapeutic drugs. The flow chart of this study is shown in Figure 1.
Schematic diagram of Mendelian randomisation and differential expression analysis.
Data Sources
2.2
The data analysed in this paper are from published public databases, details of which are available in the original paper (Table 1). The GWAS data for gut microbiota was derived from large‐scale association analyses by the MiBioGen consortium. The study included 211 microbial taxa (131 genera, 35 families, 20 orders, 16 classes and 9 phyla) and involved 18,340 participants from 24 different cohorts [33]. GWAS summary statistics related to periampullary cancer were sourced from the FinnGen study [34]. Malignant tumours from three different locations (biliary tract, pancreas, and small intestine) were selected as representatives of periampullary cancer. All three sets of data were extracted from OpenGWAS database [35], including 109 cases of biliary tract cancer (ID: finn‐b‐C3_BILIARY_TRACT_EXALLC), 605 cases of pancreatic cancer (finn‐b‐C3_PANCREAS_EXALLC), 252 cases of small intestine cancer (finn‐b‐C3_SMALL_INTESTINE_EXALLC). It is worth noting that the biliary tract cancer we selected is described as malignant neoplasm of other and unspecified parts of biliary tract. In the International Classification of Diseases Tenth Revision (ICD‐10), which was in force at the time, both distal bile duct cancer and ampulla of Vater cancer fell under this classification. Furthermore, we obtained the mRNA expression profiles of periampullary adenocarcinomas and adjacent normal tissues from the Gene Expression Omnibus (GEO) database, focusing on analysing the expression differences of such cancer tissues at the gene level. Tumour samples were collected from 85 patients in this study, of which 49 PDAC, 8 bile duct adenocarcinoma, 8 ampulla of pancreatobiliary type, 7 ampulla of intestinal type, 9 duodenum sample and 12 adjacent normal samples were used for mRNA analysis [36]. Based on the results of the expression profiles analysis, we then explored the potential effects of ECM proteins in microbial carcinogenesis. We retrieved GWAS data for four key ECM components from two human blood plasma proteome studies. Data for collagen alpha‐1(I) chain, laminin and mucin were obtained from a study of 3301 participants with 10,534,735 SNPs [37]. Another study involving 1338 participants with 501,428 SNPs provided data on fibronectin [38]. The results of both studies described above are available from the OpenGWAS database. The populations of the above data are largely independent of each other.
Instrumental Variable Selection
2.3
The available instrumental variables (IVs) in Mendelian randomisation study must satisfy three assumptions: (1) IVs are strongly correlated with exposure. (2) IVs cannot be associated with any confounding factors. (3) IVs cannot be directly related to the outcome. In order to meet the above three assumptions, we adopted the following steps to screen SNPs. First, SNPs with p‐values below the Locus‐wide significance threshold (1 × 10^−5^) were selected to ensure the correlation between IVs and exposure. Second, we obtained independent SNPs (r ^2^ < 0.001, clustering distance = 10,000 kb) through linkage disequilibrium (LD) clumping. Then, palindromic SNPs were removed to avoid allelic influence on the results. Finally, we calculated the strength of SNPs using F‐statistic formula, where F‐statistic ≥ 10 indicates no weak instrumental bias. The calculation formula is given as follows:
K is the number of IVs, R ^2^ represents the degree to which the IVs explains the exposure, and N is the sample size.
Statistical Analysis
2.4
We used six models for two‐sample MR analysis, including Inverse variance weighted (IVW), MR‐Egger, Simple mode, Weighted median, Weighted mode and MR‐PRESSO. IVW was taken as the main evaluation index due to its high accuracy [39], the MR‐Egger intercept test was used to test the potential pleiotropic effect [40], and the MR‐PRESSO corrected the horizontal pleiotropic effect by removing abnormal SNPs [41]. Moreover, Cochran's Q statistic was used to assess the heterogeneity of IVs. A Bonferroni correction was performed for multiple testing. p < 0.01667 (0.05/3 outcomes) represents statistical significance. The STROBE‐MR checklist is shown in Supporting Information S1: Table S1.
In addition, we performed GEO2R analysis on the mRNA expression profiles of 81 tumour tissue samples and 12 normal tissue samples in the GSE60979 series. The DEGs thresholds were set as adj. p value < 0.05 and |logFC| > 2, and 233 up‐regulated genes and 453 down‐regulated genes were collected. Based on DEGs, we performed Gene ontology (GO), Kyoto Encyclopaedia of Genes and Genomes (KEGG) enrichment analysis, and constructed protein‐protein interaction (PPI) network to explore possible tumourigenesis mechanisms. Then, Query CMap database with DEGs for drug repositioning screening and small molecules with connectivity scores below −0.8 were selected as potential drugs.
Finally, we followed the two‐sample MR Parameter setting and conducted MVMR analysis using MVMR‐IVW and MVMR Egger methods to evaluate the vertical pleiotropy effects caused by four ECM components. After obtaining the results of simultaneously incorporating four components, we separately analysed the four proteins with MVMR to reveal their respective effects on cancer.
All MR analyses are implemented based on ‘TwoSampleMR’ (version 0.5.7), ‘MRPRESSO’ (version 1.0), and ‘MendelianRandomization’ (version 0.9.0) packages in R (version 4.3.2). GO and KEGG analyses were performed with the ‘clusterProfiler’ (version 4.10.0) package. STRING database and Cytoscape (version 3.10.1) software are used for constructing and visualising PPI networks.
Result
3
The Effect of Gut Microbiota on Periampullary Cancer
3.1
We first extracted 14,587 significant SNPs of gut microbiota, and after removing LD, 2965 SNPs were obtained as IVs. The F‐statistic of IVs ranges from 16.69 to 95.39, indicating no weak instrumental bias. The palindromic SNPs were subsequently removed, two‐sample MR analysis revealed a statistically significant association of 9 microbial taxa with periampullary cancer (Table 2).
IVW analysis results showed that increased abundance of Rikenellaceae (OR = 0.52, 95% CI = 0.31–0.88, p = 0.0142) and its subordinate genus Alistipes (OR = 0.39, 95% CI = 0.20–0.78, p = 0.0080) were associated with a reduced risk of pancreatic cancer, whereas Terrisporobacter (OR = 2.33, 95% CI = 1.21–4.50, p = 0.0117) was associated with an elevated risk. In addition, we found Tyzzerella3 (OR = 3.94, 95% CI = 1.73–8.99, p = 0.0011), Alloprevotella (OR = 5.27, 95% CI = 1.56–17.83, p = 0.0075), Holdemania (OR = 3.95, 95% CI = 1.42–10.99, p = 0.0085) and LachnospiraceaeUCG010 (OR = 7.57, 95% CI = 1.64–34.85, p = 0.0094) abundance was strongly positive associated with the risk of biliary tract cancer. Anaerofilum (OR = 0.40, 95% CI = 0.22–0.71, p = 0.0017) and Dialister (OR = 0.35, 95% CI = 0.15–0.81, p = 0.0143) showed negative associations with the risk of small intestine cancer. Sensitivity analysis showed no evidence of pleiotropy and heterogeneity (all p PRESSO > 0.05, all p Egger intercept > 0.05, all p _Cochran's Q _ > 0.05), demonstrating the robustness of MR Results (Table 3). The results of MR Egger, Simple mode, Weighted media, and Weighted mode are provided in Supporting Information S1: Table S2. Scatter plot, forest plot, funnel plot and leave‐one‐out plot are shown in Supporting Information S1: Figure S1–S4.
Differential Gene Analysis in Periampullary Cancer Highlights ECM Proteins
3.2
A total of 686 DEGs were screened from the mRNA expression profile of periampullary cancer, including 233 up‐regulated genes and 453 down‐regulated genes. GO, KEGG, and PPI networks analyses were used to explore enrichment pathways and search for key proteins, thereby elucidating the effects of these genetic differences on tumourigenesis and progression. The results of GO enrichment analysis (Figure 2A) showed that 10 of the top 15 enrichment pathways in the three modules of cellular component (CC), biological process (BP) and molecular function (MF) were directly related to ECM. Moreover, the serine peptidases indicated by the other three pathways of MF may also be related to the degradation of ECM components [42, 43]. KEGG enrichment analysis (Figure 2B) also revealed the ECM receptor interaction pathway, and we found that the functions of differential genes were mainly concentrated in protein digestion and absorption, pancreatic secretion, neuroactive ligand‐receptor interaction, oestrogen signalling pathway, and staphylococcus aureus infection. Then, we use the Degree algorithm in Cytoscape software to score the genes in the constructed PPI network. The top 10 genes are ALB, FN1, EGF, COL1A1, KRT14, MMP1, COL1A2, COL3A1, CPA1, and CPB1, 6 of which are closely related to ECM. FN1, COL1A1, COL1A2 and COL3A1 encode ECM structural proteins. EGF encodes epidermal growth factor, which can combine with ECM components to regulate cell function [44]. MMP1‐encoded matrix metalloproteinase‐1 can degrade ECM proteins [45]. As shown in Figure 3, our results are suggestive of the effect of ECM on periampullary cancer. Table 4 displays the differential expression analysis results of highly differential ECM components (|logFC| > 2.5) between tumour tissues and adjacent normal tissues in periampullary cancer, and it is found that these ECM components are consistently highly expressed in tumour tissues.
Results of differential gene enrichment analysis. (A) GO enrichment analysis. (B) KEGG pathway analysis.
PPI networks constructed based on DEGs. Genes with a degree algorithm score of no less than 10 are displayed. The deeper the colour and the larger the node, the higher the gene score.
The Role of ECM in the Causal Relationship Between Gut Microbiota and Periampullary Cancer
3.3
To verify the potential contribution of ECM in the association between gut microbiota and periampullary cancer, we performed MVMR analysis on four ECM components [collagen alpha‐1(I) chain, laminin, fibronectin and mucin] that showed significant differences in differential expression analysis, with the results presented in Table 5.
MVMR‐IVW results showed that p values of Alistipes, Rikenellaceae and Terrisporobacter all increased significantly, losing their association with pancreatic cancer. For bile tract cancer, we found increased p values of Alloprevotella, Holdemania and LachnospiraceaeUCG010, but Tyzzerella3 remained robust. In small intestine cancer, the significance of Dialister disappeared, while the significance of Anaerofilum was maintained.
In order to understand the respective contributions of the four ECM components, MVMR analyses were performed for each of these components. As shown in Table 6, when using MVMR‐IVW to adjust fibronectin, Alloprevotella, Holdemania, LachnospiraceaeUCG010, Tyzzerella3, Rikenellaceae, Alistipes, Terrisporobacter and Dialister were no longer associated with periampullary cancer. However, when collagen alpha‐1(I) chain was adjusted separately, only the p value of Holdemania and LachnospiraceaeUCG010 was detected to increase. When laminin was regulated separately, only the p value of Rikenellaceae increased, the significant associations of most taxa remained robust. When mucin was included in the analysis, Terrisporobacter and Rikenellaceae lost their association with periampullary cancer. We also observed that all taxa for which significant associations disappeared in four components simultaneous adjustment also lost significant associations when only fibronectin was adjusted. No pleiotropy or heterogeneity was found in all MVMR analyses (all p Egger intercept > 0.05, all p _Cochran's Q _ > 0.05).
Drug Repositioning With CMap
3.4
In order to provide a possible solution for the drug therapy of periampullary cancer, we further attempted drug repositioning using CMap. We filtered DEGs with adj. p value < 0.05 and |logFC| > 3, obtaining 43 up‐regulated genes and 70 down‐regulated genes for query. As shown in Table 7, 27 drugs with connectivity scores less than −0.8 were obtained and can be used for subsequent research. JNK inhibitor ZG‐10 has the optimal connectivity score. Additionally, it can be observed that HDAC inhibitors have the highest frequency of occurrence among the selected drugs, followed by CDK inhibitors and antibiotics.
Discussion
4
This article is one of the earliest studies to evaluate the causal relationship between gut microbiota and periampullary cancer. It was found that increased abundance of Tyzzerella3, Alloprevotella, Holdemania, LachnospiraceaeUCG010, and Terrisporobacter may lead to an increased risk of periampullary cancer, whereas Alistipes, Rikenellaceae, Anaerofilum, and Dialister have a negative association with periampullary cancer. Because of the rarity of periampullary cancer, it is difficult to collect enough samples for traditional observational studies, and MR using genetic variation as instrumental variables can skillfully circumvent this difficulty. Moreover, MR can effectively avoid the interference of confounding factors existing in conventional research. GO, KEGG analysis and PPI networks revealed that DEGs between tumour tissues and adjacent normal tissues were obviously concentrated on ECM‐related pathways whereby we further investigated whether ECM plays a role in the causal relationship between gut microbiota and periampullary cancer. The results suggest that fibronectin may mediate the association between 8 taxa (Alloprevotella, Holdemania, LachnospiraceaeUCG010, Tyzzerella3, Rikenellaceae, Alistipes, Terrisporobacter and Dialister) and periampullary cancer, collagen alpha‐1(I) chain affects Holdemania and LachnospiraceaeUCG010, laminin is related to Rikenellaceae and mucin affects Terrisporobacter and Rikenellaceae. However, Anaerofilum is not affected by these four ECM proteins. In addition, we identified 27 small molecules, providing drug candidates for the establishment of adjuvant therapy for periampullary cancer. Our exploration provides evidence of the association between gut microbiota and periampullary cancer from a genetic perspective, filling the research gap in this field.
There is growing evidence that gut microbiota is involved in the occurrence and development of tumour, but it is usually not the direct cause of cancer. Gut microbiota can regulate the activities of lymphoid organs, and exert effects on the TME through immune mediation. This interaction is defined as the immuno‐oncology‐microbiome axis [46]. However, for microbes within tumours, they regulate tumour progression through three mechanisms: (1) increasing gene mutations, (2) regulating oncogenes or oncogenic pathways, and (3) adjusting the immune system [47]. It is worth noting that intratumour microbes may originate from the translocation of gut microbiota, especially in digestive system cancers. The ampulla of Vater is the junction of bile duct, pancreatic duct and duodenum [48], and there is a greater risk of gut microbiota migration in the tumour around the ampulla. Therefore, the local and remote effects of gut microbiota need to be considered simultaneously in periampullary cancer. Moreover, microbes translocated into tumours can also exert multifaceted influences on the tumour microenvironment, such as modulating cytokine secretion and immune cell function [49]. All the 9 taxa selected are concentrated in Bacillota or Bacteroidota, among which Terrisporobacter, Tyzzerella3, LachnospiraceaeUCG010 and Anaerofilum belong to Eubacteriales, Rikenellaceae, Alistipes and Alloprevotella belong to Bacteroidales. Therefore, we speculate that Eubacteriales and Bacteroidales may have a higher correlation with periampullary cancer. Mao et al. found that biliary tract cancer patients with high abundance Bacteroidales had better progression free survival [50]. Yang et al. found that collagen alpha‐1(I) chain homotrimer produced by PDAC cancer cells promoted carcinogenic effects through α3β1 integrin, associated with Bacteroidales in the tumour [51], which similarly validated our focus on the ECM. Among the taxa associated with pancreatic cancer that we excavated, Alistipes, a genus under the Rikenellaceae family, has been reported to be beneficial bacteria for pancreatitis [52], pancreatic cancer [53] and liver disease [54]. In addition, there is evidence that Holdemania is associated with primary biliary cholangitis [55] and pregnancy intrahepatic cholestasis [56], but the direction of the effect is different from our results, and further investigation is needed. To our best knowledge, the correlation between most taxa and periampullary cancer is reported for the first time, which provides a new direction for the study of periampullary cancer.
Our MVMR analysis found that four ECM proteins, including fibronectin, collagen, laminin and mucin, may mediate the effects of gut microbiota on periampullary cancer, suggesting the possibility of a carcinogenic pathway for microbiota‐ECM‐tumour. The effect of ECM on the TME has been widely reported, and it is generally believed that the dysregulation of ECM homoeostasis occurs during the development of cancer, resulting in a series of biochemical reactions that further induce the proliferation and migration of cancer cells [57]. In addition, there is often excessive tissue fibrosis caused by fibrillar collagen accumulation in solid tumours [58], the increase in tumour hardness associated with dense matrix also induces epithelial–mesenchymal transition, which increases the ability of cancer cells to metastasise and induces malignant phenotypes [59, 60]. The high density of ECM also blocks the metastasis of immune cells to the tumour area and compresses the blood vessels to form an oxygen‐deficient environment, resulting in immunosuppressive effects [61, 62]. Increased ECM stiffness disrupts normal tissue architecture by activating and recruiting stromal cells such as CAFs, and exacerbated fibrosis reduces vasculature to compromise drug delivery, collectively driving chemotherapy resistance and limiting immunotherapy applications [63, 64, 65]. It should be emphasised that drug repositioning via CMap based on DEGs cannot comprehensively evaluate the co‐regulatory effects of drugs, immune cells, and ECM. Future single‐cell and spatial transcriptomic studies are strongly warranted. The presence of microbiota in tumours and the effects of gut microbiota on the immune system suggest a possible association between the microbiota and ECM. The microbiota in contact with tumour cells can produce proteases including collagenase, elastase and hyaluronidase, which may have the effect of degrading ECM [66, 67]. These bacterial proteases may induce post‐translational modifications of host ECM proteins [68] and reduce the immune response by disrupting the host cytokine networks [69]. Studies have shown that interactions between bacterial products and ECM components may influence the development and progression of urothelial bladder cancer [70]. Moreover, mucin, an ECM protein, has been used as a biomarker for typing detection of periampullary cancer [1, 71, 72]. The mechanism of the association between gut microbiota, ECM, and periampullary cancer deserves further research in the future.
The typing identification of periampullary cancer is also an essential part of treatment. Ampullary cancer can be divided into intestinal type and pancreaticobiliary type [73], and these two histopathological phenotypes are very similar to duodenal cancer and pancreatic cancer, respectively. Therefore, ampullary cancer is often confused with other periampullary cancer in diagnosis [74, 75, 76]. However, a recent study pointed out that periampullary cancer can be uniformly divided into intestinal type or pancreaticobiliary type in a similar way as ampullary cancer, and cancers of the same type have the same histopathological features and overall survival regardless of the tumour origin site [77]. In the preoperative diagnosis and adjuvant treatment of periampullary cancer, more consideration should be given to the histological type of the tumour rather than the origin site [78]. At present, the main typing methods are HE staining and immunohistochemical staining, which require the acquisition of tissue samples from patients [1]. Studies have shown that 16% of patients undergoing pancreaticoduodenectomy have relevant clinical misdiagnosis [79]. In such a small anatomical site as the ampulla, the site of origin of periampullary cancer usually does not have an impact on the gut microbiota, and its histological type is more likely to lead to differences in the abundance of gut microbiota. We reported the potential effects of gut microbiota abundance on pancreatic cancer, bile tract cancer and small intestine cancer, and the results can provide evidence for developing a new noninvasive faecal microbiota identification method for histopathological types of periampullary cancer, to guide the adjuvant therapy. With the convergence of biomedical and computer technologies, deep learning may offer potential solutions to this challenge, which will also be our future research trend [80, 81, 82, 83].
Our study has some limitations: (1) Most of our GWAS data are derived from European populations, so extrapolating our results to other populations may not be universally applicable. (2) The GWAS data for the three cancer groups we selected were derived from normal pancreatic, bile tract and small intestine cancer, rather than the specific source of periampullary tissue within 2 cm of the ampulla, which may lead to certain bias. (3) Our MVMR analysis focused on plasma ECM proteins, whereas correlations at the tissue level call for further validation.
Conclusions
5
In summary, we conducted MR studies and differential expression analysis using publicly available databases. This work demonstrated a causal relationship between gut microbiota and periampullary cancer, revealed that potential role for ECM proteins in this crosstalk, and provided the potential drug candidates for periampullary cancer. These findings warrant further research to explore the potential clinical application of microbiome related technologies. It could help expand our understanding of periampullary cancer and guide the development of new drugs and diagnostic methods.
Author Contributions
Zeying Cheng: conceptualization, data curation, formal analysis, writing – original draft, writing – review and editing. Liqian Du: data curation, formal analysis, writing – review and editing. Hongxia Zhang: conceptualization, methodology, project administration. Zhongkun Zhou: investigation, methodology, writing – review and editing. Yunhao Ma: investigation, writing – review and editing. Baizhuo Zhang: investigation, writing – review and editing. Lixue Tu: data curation. Tong Gong: data curation. Zhenzhen Si: data curation. Hong Fang: data curation. Jianfang Zhao: conceptualization, methodology, project administration. Peng Chen: conceptualization, funding acquisition, project administration, supervision, writing – review and editing. All authors discussed the results and approved the manuscript.
Ethics Statement
This study was conducted based on publicly available databases that have been approved by ethical review committees. Therefore, no new approval by the ethical review committee is required.
Consent
The authors have nothing to report.
Conflicts of Interest
The authors declare no conflicts of interest.
Supporting information
Supporting Information S1
The reference list from the paper itself. Each links out to its DOI / PubMed record.
- 1Z. Duan , Y. Zhang , Y. Tang , R. Gao , J. Bao , and B. Liang , “Adjuvant Therapy for Periampullary Carcinoma and the Significance of Histopathological Typing: A Systematic Review,” Translational Oncology 20 (2022): 101414, 10.1016/j.tranon.2022.101414.35397420 PMC 9006738 · doi ↗ · pubmed ↗
- 2J. M. Sarmiento , D. M. Nagomey , M. G. Sarr , and M. B. Farnell , “Periampullary Cancers: Are There Differences?,” Surgical Clinics of North America 81, no. 3 (2001): 543–555, 10.1016/s 0039-6109(05)70142-0.11459270 · doi ↗ · pubmed ↗
- 3A. Romiti , “Tumors of Ampulla of Vater: A Case Series and Review of Chemotherapy Options,” World Journal of Gastrointestinal Oncology 4, no. 3 (2012): 60–67, 10.4251/wjgo.v 4.i 3.60.22468185 PMC 3312930 · doi ↗ · pubmed ↗
- 4C. A. Hester , E. Dogeas , M. M. Augustine , et al., “Incidence and Comparative Outcomes of Periampullary Cancer: A Population‐Based Analysis Demonstrating Improved Outcomes and Increased Use of Adjuvant Therapy From 2004 to 2012,” Journal of Surgical Oncology 119, no. 3 (2018): 303–317, 10.1002/jso.25336.30561818 · doi ↗ · pubmed ↗
- 5H. Zakaria , A. N. sallam , I. I. Ayoub , et al., “Prognostic Factors for Long‐Term Survival After Pancreaticoduodenectomy for Periampullary Adenocarcinoma. A Retrospective Cohort Study,” Annals of Medicine and Surgery 57 (2020): 321–327, 10.1016/j.amsu.2020.07.059.32874564 PMC 7452109 · doi ↗ · pubmed ↗
- 6M. Al‐Jumayli , A. Batool , A. Middiniti , et al., “Clinical Outcome of Ampullary Carcinoma: Single Cancer Center Experience,” Journal of Oncology 2019 (2019): 1–7, 10.1155/2019/3293509.PMC 652148731186632 · doi ↗ · pubmed ↗
- 7K. Jayaramayya , V. Balachandar , and K. S. Santhy , “Ampullary Carcinoma—A Genetic Perspective,” Mutation Research, Reviews in Mutation Research 776 (2018): 10–22, 10.1016/j.mrrev.2018.03.002.29807574 · doi ↗ · pubmed ↗
- 8R. Nagarkar , D. Patil , S. Limaye , et al., “Liquid Biopsy and Multi‐Analyte Testing Guided Treatment of HER 2 Positive Periampullary Adenocarcinoma With Durable Complete Response After Trastuzumab Based Therapy,” Oncotarget 11, no. 45 (2020): 4195–4200, 10.18632/oncotarget.27793.33227091 PMC 7665235 · doi ↗ · pubmed ↗