Differential effects of antiemetic serotonin receptor antagonist Ondansetron on nausea associated with CHRM3 rs2165870 and TACR1 rs3755468 single-nucleotide polymorphisms
Yuna Kang, Seii Ohka, Daisuke Nishizawa, Junko Hasegawa, Kyoko Nakayama, Kaori Yoshida, Kyotaro Koshika, Tatsuya Ichinohe, Kazutaka Ikeda

TL;DR
This study shows that the antiemetic drug ondansetron has different effects on post-surgery nausea depending on genetic variations in CHRM3 and TACR1 genes.
Contribution
The study reveals that ondansetron's effectiveness in reducing nausea varies based on specific SNPs in CHRM3 and TACR1, suggesting genotype-specific antiemetic strategies.
Findings
AA carriers of CHRM3 rs2165870 had higher nausea scores and metoclopramide use despite ondansetron.
CC carriers of TACR1 rs3755468 had higher nausea scores under ondansetron's influence.
Ondansetron's effect on CHRM3-related nausea is distinct from TACR1-related nausea.
Abstract
Postoperative nausea and vomiting (PONV) after orthognathic surgery is a serious postoperative complication. The cholinergic receptor muscarinic 3 (CHRM3) rs2165870 and tachykinin receptor 1 (TACR1) rs3755468 single-nucleotide polymorphisms (SNPs) have been reported to be involved in PONV. We evaluated the impact of these SNPs on PONV in a Japanese population who underwent orthognathic surgery under PONV prophylaxis with the 5-hydroxytryptamine (serotonin) receptor 3A receptor antagonist ondansetron. In 121 patients, dexamethasone was administered after intubation, followed by ondansetron before the end of surgery. An 11-point numeric rating scale (NRS) score for PONV (0–2 h or 2–24 h after anesthesia endpoint [a.a.e.]) and the presence or absence of metoclopramide administration (0–2 h or 2–24 h a.a.e.) were evaluated. If patients complained of PONV and had an NRS score ≥ 4, then…
Genes, proteins, chemicals, diseases, species, mutations and cell lines named across the full text — each resolved to its canonical identifier and authoritative record.
Click any figure to enlarge with its caption.
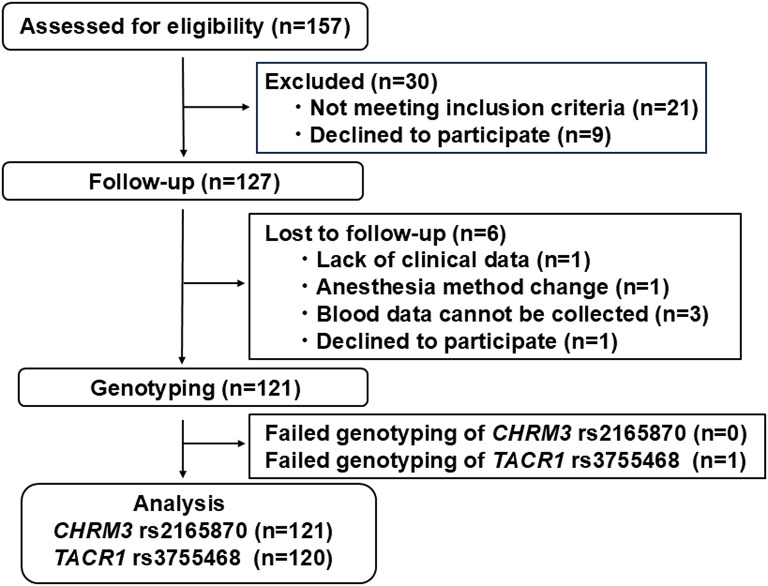 Figure 1
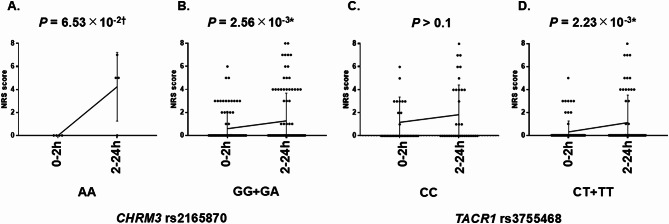 Figure 2
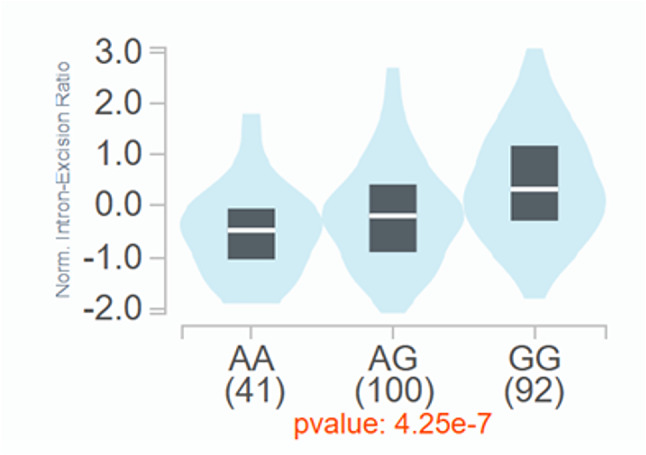 Figure 3
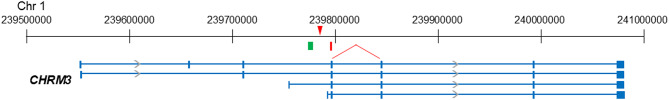 Figure 4
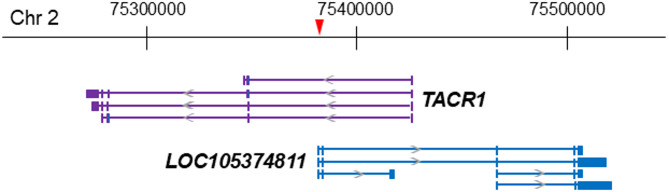 Figure 5
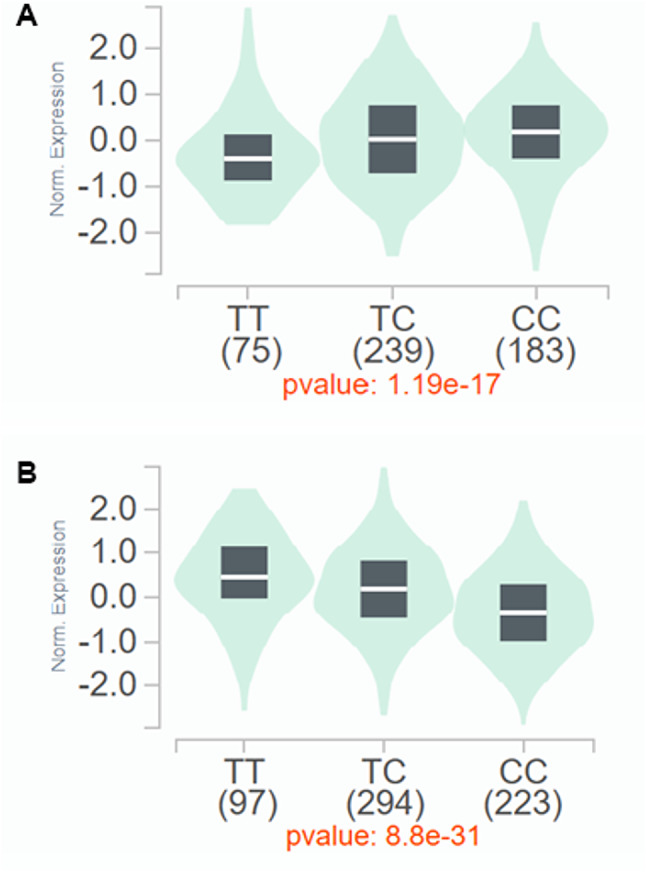 Figure 6
- —https://doi.org/10.13039/501100001691Japan Society for the Promotion of Science
Peer Reviews
No public reviews on file for this paper yet. If you reviewed it on a platform where reviews are public (OpenReview, ICLR, NeurIPS, ICML), you can paste yours below so the community can read it here.
Videos
No videos yet. Explain this paper in a talk, walkthrough, or lecture? Add one.
Taxonomy
TopicsNausea and vomiting management · Sympathectomy and Hyperhidrosis Treatments · Pathogenesis and Treatment of Hiccups
Introduction
Postoperative nausea and vomiting (PONV) is one of the most common complications after major surgery. Orthognathic surgery has an even higher risk of PONV, the probability of which is 43–72% [1], because Le Fort I osteotomy, which involves detachment of the maxilla, causes a large amount of bleeding and makes it easy to swallow blood, which increases the risk of nausea. In orthognathic surgery, if vomiting occurs due to intermaxillary fixation postoperatively, then the risk of airway obstruction or aspiration pneumonia increases. Thus, the treatment of PONV is even more important. Risk factors for PONV have been reported to include female sex, a history of PONV and/or motion sickness, nonsmoking status, and young age [2]. Antiemetics for different receptors are recommended for patients with more than one risk factor for PONV [2]. Maintaining anesthesia with propofol is less likely to cause PONV than with volatile anesthetics [2]. In a previous study, the incidence of PONV was 15% when intraoperative anesthesia with propofol for orthognathic surgery was maintained [3]. In particular, there is strong evidence of efficacy of the combined administration of ondansetron (a selective [serotonin, 5-HT] receptor 3A [5-HT3A receptor, HTR3A] antagonist) and dexamethasone for PONV prophylaxis [2]. In our previous study, a combination of dexamethasone and ondansetron with a volatile anesthetic for orthognathic surgery resulted in a 9% occurrence of nausea [4]. Thus, even maintaining anesthesia with propofol or under the combined prophylactic administration of dexamethasone and ondansetron, some patients still experience nausea. Accordingly, we speculated that the risk of PONV involves genetic factors.
Nausea is a complex perceptual process that has different dimensions (e.g., learning, emotional, executive, motivational, or motor events), leading to a poor understanding of its mechanisms [5]. A systematic review identified four neural networks that are important for nausea [6]. First, the nucleus tractus solitarius (NTS) in the central nervous system (CNS) plays a pivotal role in nausea induction and receives inputs from the vestibular system, chemo- and mechano-receptive vagal afferents, and systemic agents. Second, serotonin activates chemical and/or mechanoreceptors that are expressed in the upper gastrointestinal tract, pharynx, and mediastinum, and these stimuli lead to the NTS via vagus nerve afferents. Third, systemic agents in the bloodstream, such as drugs, hormones, and neurotransmitters, reach the area postrema (chemoreceptor trigger zone [CTZ]) in the medulla oblongata outside the blood-brain barrier (BBB) and send signals to the NTS. Fourth, the NTS connects cerebral cortical areas, including the anterior cingulate cortex (ACC), through the basal ganglia in subcortical structures, leading to nausea. However, pathways that contribute to nausea in the CNS other than the brainstem and spinal cord have not been elucidated. According to the reported mechanism of vascular headache-related nausea and emesis, the trigeminovascular system connects centers that are associated with the generation of vascular headaches, nausea, emesis, autonomic activation, etc [7].
Cholinergic receptor muscarinic 3 (CHRM3), dopamine receptor D2 (DRD2), HTR3A, the µ-opioid receptor (OPRM1), and the neurokinin 1 receptor (tachykinin receptor 1 [TACR1]) are expressed in the CNS, area postrema, and vagus nerves and are reportedly involved in emesis via the area postrema and vagus nerves. Ondansetron predominantly suppresses emesis by antagonizing serotonin at the 5-HT_3A_ receptor on the afferent vagus nerve in the area postrema and gastrointestinal tract outside the BBB [6, 8], based on the fact that ondansetron cannot efficiently penetrate the BBB [9]. The pathway for emesis via the area postrema and vagus nerve that express CHRM3, DRD2, HTR3A, OPRM1, and TACR1 at least partially overlaps with the transduction pathway of ondansetron [8, 10, 11].
Among the genes of the above proteins that are related to emesis (CHRM3, DRD2, HTR3A, OPRM1, and TACR1), the DRD2 rs1800497, HTR3A rs1176713, and OPRM1 rs1799971 single-nucleotide polymorphisms (SNPs) were not independent risk factors for PONV [12], but some studies reported associations between the CHRM3 rs2165870 and TACR1 rs3755468 SNPs and PONV [13–16]. A genome-wide association study (GWAS) suggested that CHRM3 rs2165870 contributed to a higher risk for PONV in the dominant model (GG + GA/AA) [13], and the AA genotype of CHRM3 rs2165870 contributed to a higher risk for PONV in German or Chinese populations who underwent elective surgery [14–16]. Notably, the AA genotype of CHRM3 rs2165870 was associated with a higher response to ondansetron in the Chinese Han population [15]. For TACR1, Hayase et al. suggested that the CC genotype of TACR1 rs3755468 contributed to a higher risk for PONV in a Japanese population who underwent lower abdominal surgery without ondansetron administration [17]. To date, no studies have investigated effects of the CHRM3 rs2165870 and TACR1 rs3755468 SNPs on PONV in orthognathic surgery under PONV prophylaxis with ondansetron. In the present study, we evaluated the impact of the CHRM3 rs2165870 and TACR1 rs3755468 SNPs on PONV in a Japanese population who underwent orthognathic surgery under PONV prophylaxis with ondansetron and investigated effects of ondansetron on nausea that is associated with these SNPs.
Materials and methods
Patients who underwent orthognathic surgery under general anesthesia
A total of 157 patients were recruited for participation in the study. However, 30 patients failed to meet the inclusion criteria, and another six patients were lost to follow-up after surgery, resulting in their exclusion (Fig. 1).
Fig. 1. Flowchart for subject inclusion and exclusion in the study. Illustration of the process of enrolling patients for study inclusion
Consequently, enrolled in the study were 121 adult patients (American Society of Anesthesiologists Physical Status [ASA-PS] I-II, 18–50 years old, 48 males and 73 females) who were scheduled to undergo bimaxillary osteotomy (Le Fort I osteotomy) for jaw deformities under general anesthesia at The Tokyo Dental College Suidoubashi Hospital. Exclusion criteria included patients who underwent emergency surgery or had contraindications to ondansetron. All of the individuals who were included in the study were of Japanese descent. Peripheral blood samples were collected from these subjects for gene analysis. Detailed demographic and clinical data of the subjects are provided in Table 1 and Tables S1 and S2 in Additional file 1.
Table 1. Demographic and clinical data of patient subjects n MinimumMaximumMeanSDMedianSexMale48Female73Age (years)121185026.648.1527Height (cm)121150188165.658.12166.00Weight (kg)1214010760.3912.0558.00Body mass index (kg/m^2^)12116.0235.7521.893.4021.05ASA-PSI103II18Smoking historyAbsent101Present20Motion sicknessAbsent78Present43History of PONVAbsent110Present11Apfel score^a^110234346431Operation time (min)121141625124.4362.38239.00Anesthesia time (min)121202690305.664.26299.00Total infusion volume (ml)121100033501692.5372.031600.00Blood loss during surgery (ml)12136835210.25134.28186.00Total remifentanil dose (µg/kg)^b^12142.02153.0376.9821.9574.63Total intraoperative fentanyl dose (µg/kg)^b^1211.945.803.910.534.00Postoperative fentanyl dose 2 h later (µg/kg)^b^12105.231.361.101.07Postoperative fentanyl dose 24 h later (µg/kg)^b^121014.084.023.422.99Nausea NRS (0–2 h)1210100.561.460Nausea NRS (2–24 h)1210101.362.460Metoclopramide administration (0–2 h)Absent120Present1Metoclopramide administration (2–24 h)Absent93Present28Vomiting (0–2 h)Absent120Present1Vomiting (2–24 h)Absent115Present6^a^Score for risk factors consisted of female sex, nonsmoking status, history of PONV or motion sickness, and postoperative opioid use^b^Doses of opioids were normalized to body weight
The present study was approved by the Ethics Committees of Tokyo Dental College and Tokyo Metropolitan Institute of Medical Science (approval no. 1146 and 23 − 14 [1], respectively) and registered with the University Hospital Medical Information Network (registration no. UMIN000051727). The study was performed in accordance with provisions of the Declaration of Helsinki. All subjects provided written informed consent for the genetic studies.
General anesthesia and nausea assessment
All participants received intubated general anesthesia according to the following protocol. After arrival in the operating room and starting standard anesthetic monitoring (noninvasive blood pressure, percutaneous oxygen saturation, electrocardiography, and capnography), peripheral intravenous (IV) access was established, and a continuous infusion of remifentanil (0.5 mg/kg/min) was initiated. The target-controlled infusion of propofol was started at 3.0 µg/ml according to the Japanese package insert. Infusion rates were maintained at 2.5–5.0 µg/ml, considering age and estimated brain concentration at loss of consciousness. After neuromuscular paralysis was achieved with rocuronium (0.6 mg/kg), nasotracheal intubation was performed. Following successful intubation, an IV bolus of dexamethasone (6.6 mg) was administered. An A-line was taken from the radial artery for invasive blood pressure measurement. Next, 10 ml of peripheral blood samples was collected from the radial artery for gene analysis. General anesthesia was maintained with propofol, oxygen (1 L/min), and air (3 L/min) along with a remifentanil infusion. Remifentanil infusion rates were started at 0.2 mg/kg/min and adjusted by 0.05 mg/kg/min every 5 min depending on changes in systolic blood pressure (20%) compared with values 5 min previously. At the time of maxillary transection, an IV bolus of fentanyl (2 µg/kg) was administered. At approximately 20 and 15 min before the end of surgery, an IV bolus of fentanyl (2 µg/kg) and ondansetron (4 mg) was administered, respectively. Following the completion of surgery, the degree of neuromuscular paralysis was assessed using a train-of-four monitor, and sugammadex (2–4 mg/kg) was administered as needed. Patients were extubated while awake after sufficient spontaneous ventilation and responsiveness to verbal commands were confirmed. After emergence from anesthesia and tracheal extubation, IV patient-controlled analgesia (PCA; 1 mg fentanyl in normal saline in a total volume of 50 ml) commenced using a CADD-Legacy PCA pump (Smiths Medical Japan, Tokyo, Japan) to prevent pain. The PCA settings included a bolus dose of fentanyl (50 µg) on demand with a lockout time of 10 min. Continuous background infusion was not used. Patient-controlled analgesia was continued for 24 h postoperatively. The use of intraoperative remifentanil, fentanyl, and postoperative PCA fentanyl during the 24 h postoperative period was recorded. The doses of remifentanil and fentanyl that were administered intraoperatively and postoperatively were normalized to body weight. For postoperative analgesia, acetaminophen and loxoprofen were administered on time in all patients.
Patient-rated nausea severity was assessed twice: 2 and 24 h after the anesthesia endpoint (a.a.e.) while avoiding bedtime using an 11-point numeric rating scale (NRS; 0 = no nausea, 10 = maximum imaginable nausea) score for PONV. Any episodes of vomiting were also recorded along with the timing. The NRS score was also evaluated when a patient complained of nausea or vomited. According to a previous study, dividing the PONV time into 0–2 h and 2–24 h a.a.e. allows determination of the efficacy of ondansetron [18]. Although the pharmacokinetic half-life of ondansetron in whole blood is ~ 6 h in Japanese individuals [19], it is preferable to investigate the effect of ondansetron during a period with a higher blood concentration of ondansetron (e.g., 0–2 h a.a.e.), similar to the previous study. Thus, the data-collecting split time point for PONV was set at 2 h a.a.e. in the present study. For patients without complaints of nausea or vomiting, NRS scores that were recorded 2 and 24 h a.a.e. were used for 0–2 h and 2–24 h a.a.e., respectively. For patients with complaints of nausea or vomiting, the maximum NRS scores that were recorded for each of the 0–2 h and 2–24 h a.a.e. were used. If the NRS score was ≥ 4 whenever a patient complained of nausea or vomited, IV metoclopramide (10 mg) was administered. If metoclopramide was administered, then the timing was recorded. Metoclopramide was administered up to twice daily.
Additional data that were gathered included patient demographics (sex, age, height, body weight, body mass index, ASA-PS, smoking history, motion sickness, and history of PONV) and surgical/anesthetic factors (operation time, anesthesia time, total infusion volume, blood loss, total remifentanil dose, total intraoperative fentanyl dose, total postoperative fentanyl dose, and timing of metoclopramide administration). We also calculated the number of PONV risk factors according to the Apfel score [20]: female sex, nonsmoker, history of PONV or motion sickness, and postoperative opioid use.
Genotyping
Genomic DNA was extracted from whole-blood samples using standard procedures [15, 16]. The extracted DNA was dissolved in TE buffer (10 mM Tris-HCl and 1 mM ethylenediaminetetraacetic acid, pH 8.0). The DNA concentration was adjusted to 20 ng/µl for whole-genome genotyping using a NanoDrop ND-1000 Spectrophotometer (NanoDrop Technologies, Wilmington, DE, USA). The TaqMan allelic discrimination assay was conducted for genotyping the rs2165870 SNP of the CHRM3 gene and rs3755468 SNP of the TACR1 gene as described in previous reports [21, 22]. To perform the TaqMan assay with a LightCycler 480 II (Roche Diagnostics, Basel, Switzerland), we used TaqMan SNP Genotyping Assays (Life Technologies, Carlsbad, CA, USA) that contained sequence-specific forward and reverse primers to amplify the polymorphic sequence and two probes that were labeled with VIC and FAM dye to detect both alleles of the rs2165870 SNP of the CHRM3 gene and rs3755468 SNP of the TACR1 gene (Assay ID: C_9774837_30 and C_27474834_20, respectively). Real-time polymerase chain reaction was performed in a final volume of 10 µl that contained 2× LightCycler 480 ІІ Probes Master (Roche Diagnostics), 40× TaqMan SNP Genotyping Assays, 5–50 ng genomic DNA as the template, and H_2_O (Roche Diagnostics). The thermal conditions were the following: 95 °C for 10 min, followed by 45 cycles of 95 °C for 10 s and 60 °C for 60 s, with final cooling at 50 °C for 30 s. Afterward, endpoint fluorescence was measured for each sample well, and each genotype was determined based on the presence or absence of each type of fluorescence. We performed TaqMan SNP Genotyping Assays on 121 samples, although we failed to genotype one sample for TACR1 rs3755468 (Fig. 1). Raw genotype data for clinical phenotypes on the CHRM3 rs2165870 and TACR1 rs3755468 SNPs are shown in Dataset S1.
Power analysis
In a previous study, the patient numbers of each genotype of CHRM3 rs2165870 with PONV at 2–6 h a.a.e. were GG = 82, GA = 96, and AA = 31. Without PONV at 2–6 h a.a.e., they were GG = 137, GA = 148, and AA = 18 [23]. Based on previous studies, an a priori power analysis was performed with G*Power (version 3.1.9.6, Heinrich Hein University), and an effect size of 0.26 in Cohen’s conventional small effect size was used for calculation [24, 25]. Therefore, we set a significance level of 5% and power of 80% and calculated a sample size of 117 total patients.
Statistical analysis
The samples (121 and 120) were analyzed for the CHRM3 rs2165870 SNP and TACR1 rs3755468 SNP, respectively (Fig. 1). For all genotype frequency data, deviations from the theoretical Hardy-Weinberg equilibrium (HWE) distribution were examined, and χ^2^ tests, one-way analysis of variance (ANOVA), t-test, two-way ANOVA, and Sidak’s multiple-comparison post hoc test were performed to analyze associations with the clinical data. The HWE distribution test was performed using Haploview 4.2 and Calculator of Hardy-Weinberg equilibrium [26]. Hardy-Weinberg equilibrium was tested using the χ^2^ test (df = 1) for genotypic distributions of the CHRM3 rs2165870 and TACR1 rs3755468 SNPs with values of significant deviation set to P = 0.05. The χ^2^ test, one-way ANOVA, and t-test were performed using SPSS 28 software (IBM Japan, Tokyo, Japan). Two-way ANOVA and Sidak’s multiple-comparison post hoc test were performed using GraphPad Prism 7.00 software. Bonferroni correction for multiple comparisons was performed for two SNPs of CHRM3 rs2165870 and TACR1 rs3755468 in the genotypic, dominant, and recessive models. Mean NRS scores are expressed as the mean ± SD and were analyzed using one-way ANOVA or t-test. Bonferroni correction for multiple comparisons was performed for two SNPs of CHRM3 rs2165870 and TACR1 rs3755468 in the genotypic, dominant, and recessive models. P < 0.05 was considered a significant association, and 0.05 ≤ P < 0.10 was considered a trend toward an association.
Public database search
We extracted information on expression quantitative trait loci (eQTLs) of the SNPs using the GTEx Portal to examine effects of the SNP on gene expression levels in humans [27]. We also extracted information on expression splicing quantitative trait loci (sQTLs) of the SNPs using the GTEx Portal to examine effects of the SNPs on gene expression levels in humans [28]. We extracted information on CHRM3 and TACR1 mRNA expression in human tissues and cells using The Human Protein Atlas [29]. We extracted the DNase-Seq signal of the genes’ genomic regions and transcript of the genes’ genomic regions and antisense noncoding RNA using the ZENBU genome browser on December 9, 2024, to investigate transcriptional regulation around SNP regions in the genes [30, 31]. The data source of the DNase-Seq signal was the NIH Roadmap Epigenomics Mapping Consortiums in 127 samples, showing only a P-value signal ≥ 2. We searched the transcripts starting from around the SNP using the National Center for Biotechnology Information (NCBI) [32]. We investigated allele frequencies by regional population using the NCBI database [33, 34]. The nucleotide sequence of the human genome assembly hg19 GRCh37 from Genome Reference Consortium was used.
Results
Background characteristics of the patients related to surgery and anesthesia
In the present study, we analyzed 121 and 120 patients for the CHRM3 rs2165870 and TACR1 rs3755468 SNPs, respectively, who underwent general anesthesia for orthognathic surgery. The background characteristics of the patients related to the surgery and anesthesia are shown in Table 1 and Tables S1 and S2 in Additional file 1.
CHRM3 rs2165870 and TACR1 rs3755468 SNPs were in HWE
The genotypic distribution of CHRM3 rs2165870 and TACR1 rs3755468 did not significantly deviate from the theoretical HWE in the patient group (CHRM3 rs2165870: P = 0.59, χ^2^ = 0.2925; TACR1 rs3755468: P = 0.93, χ^2^ = 0.0083).
CHRM3 rs2165870 SNP was associated with Metoclopramide administration 0–24 h and 2–24 h a.a.e.
Based on the previous report that CHRM3 rs2165870 is associated with PONV in the Chinese Han population [23], we investigated whether the CHRM3 rs2165870 is associated with PONV in the present study in a Japanese population. In 0–24 h a.a.e., the CHRM3 rs2165870 SNP showed a significant association with metoclopramide administration in the recessive model (χ^2^ test, P = 3.01 × 10^− 2^; Table 2), suggesting that CHRM3 rs2165870 is associated with metoclopramide administration in the Japanese population, consistent with the previous results in the Chinese Han population.
Table 2. Association between genotypes of CHRM3 rs2165870 SNP and Metoclopramide administration (recessive model, χ^2^ test)Hours after anesthesia endpointMetoclopramide administrationGenotypes P GG + GA (n = 117*)AA (n = 4)0–2with1 (1%)0 (0%)1.00 × 10^− 1^without116 (99%)4 (100%)2–24with25 (21%)3 (75%)2.48 × 10^− 2^without92 (79%)1 (25%)0–24with26 (22%)3 (75%)3.01 × 10^− 2*^without91 (78%)1 (25%)^*^P < 0.05
Because CHRM3 rs2165870 showed no significant association in the genotypic or dominant models in 0–24 h a.a.e. (χ^2^ test, P > 0.05; Tables S3 and S4 in Additional file 1), we thereafter performed an analysis mainly in the recessive model for CHRM3 rs2165870.
Next, because CHRM3 rs2165870 is reportedly associated with the efficacy of ondansetron in the Chinese Han population [18], we investigated whether CHRM3 rs2165870 is associated with effects of ondansetron in the present study in the Japanese population. According to the previous study, dividing the time of PONV into 0–2 h and 2–24 h a.a.e. to determine the efficacy of ondansetron [18], we divided the patients into 0–2 h and 2–24 h a.a.e. with the timing of metoclopramide administration (NRS score ≥ 4). The influence of ondansetron is supposed to be sufficient in 0–2 h a.a.e. and diminished in 2–24 h a.a.e. To examine the effect of ondansetron, we analyzed the association between CHRM3 rs2165870 and metoclopramide administration in 0–2 h and 2–24 h a.a.e. In 0–2 h a.a.e., the CHRM3 rs2165870 SNP showed no association with metoclopramide administration (χ^2^ test, P > 0.05; Table 2), whereas CHRM3 rs2165870 showed a significant association with metoclopramide administration in 2–24 h a.a.e. (χ^2^ test, P = 2.48 × 10^− 2^; Table 2). The pharmacokinetic half-life of ondansetron in whole blood is approximately 6 h in Japanese individuals [19]; thus, the significant association that was observed under the diminished influence of ondansetron (2–24 h a.a.e.) and not under a greater effect of ondansetron (0–2 h a.a.e.) suggests that CHRM3 rs2165870 is associated with the effect of ondansetron.
The previous study suggested that the AA genotype of CHRM3 rs2165870 was associated with a higher risk of PONV and showed a response to ondansetron treatment [18]. To investigate whether the AA genotype of CHRM3 rs2165870 is associated with a higher risk of PONV and shows a response to ondansetron treatment in the present study, we analyzed the genotype distribution in the recessive model (Table 2). In 2–24 h a.a.e., the AA genotype had a higher rate of metoclopramide administration than GG + GA genotypes (2–24 h a.a.e.; GG + GA/AA with metoclopramide, 21%/75%, without metoclopramide, 79%/25%; Table 2). The results suggest that the AA genotype of CHRM3 rs2165870 has a higher risk of PONV and response to ondansetron treatment, consistent with the results of the previous study.
Altogether, under the sufficient influence of ondansetron (0–2 h a.a.e.), no significant association was observed between CHRM3 rs2165870 and metoclopramide administration, whereas under the diminished influence of ondansetron (2–24 h a.a.e.), there was a significant need for metoclopramide administration in patients with the AA genotype of CHRM3 rs2165870. These results suggest that patients with the AA genotype of CHRM3 rs2165870 are more prone to experience nausea under the diminished influence of ondansetron.
CHRM3 rs2165870 SNP was significantly associated with NRS score 2–24 h a.a.e.
To further confirm consistency with the previous results of the association between CHRM3 rs2165870 and PONV or the efficacy of ondansetron, we investigated whether there was a significant association between CHRM3 rs2165870 and the patients’ mean NRS scores in 0–2 h, 2–24 h, or 0–24 h a.a.e. In 0–24 h a.a.e., CHRM3 rs2165870 showed a trend toward an association in the recessive model (t-test, P = 7.95 × 10^− 2^; Table 3).
Table 3. Association between genotypes of CHRM3 rs2165870 SNP and NRS scores (recessive model, t-test)Hours after anesthesia endpointNRS values (mean ± SD) P GG + GAAA0-2^a^0.57 ± 1.270.00 ± 0.008.79 × 10^− 1^2-24^a^1.38 ± 2.454.25 ± 2.593.40 × 10^− 2*^0-24^b^1.61 ± 2.504.25 ± 2.597.95 × 10^− 2♰^^*^P < 0.05^†^0.05 < P < 0.10^a^NRS score assessed during indicated hours after anesthesia^b^Maximum NRS score in 0–24 h
To examine the effect of ondansetron, we analyzed the association between CHRM3 rs2165870 and mean NRS scores in 0–2 h a.a.e. (sufficient influence of ondansetron) and 2–24 h a.a.e. (less sufficient influence of ondansetron). In 0–2 h a.a.e., CHRM3 rs2165870 showed no association with mean NRS scores (t-test, P > 0.05; Table 3), whereas in 2–24 h a.a.e., CHRM3 rs2165870 showed a significant association with mean NRS scores in the recessive model (t-test, P = 3.40 × 10^− 2^; Table 3). No significant association was found in 0–2 h, 2–24 h, or 0–24 h a.a.e. in the genotypic or dominant model (one-way ANOVA or t-test, P > 0.05; Tables S5 and S6 in Additional file 1). The results suggest that CHRM3 rs2165870 does not show a significant association with mean NRS scores under the sufficient influence of ondansetron (0–2 h a.a.e.), whereas this SNP showed a significant association with mean NRS scores under the diminished influence of ondansetron (2–24 h a.a.e.), confirming that CHRM3 rs2165870 is associated with PONV and the efficacy of ondansetron.
TACR1 rs3755468 SNP showed no significant association with Metoclopramide administration
Based on the previous report that TACR1 rs3755468 is associated with PONV in the Japanese population [17], we investigated whether TACR1 rs3755468 is associated with PONV in the present study in the Japanese population. TACR1 rs3755468 showed no significant association with metoclopramide administration in 0–2 h, 2–24 h, or 0–24 h a.a.e. (genotypic, dominant, and recessive models: P > 0.05; Table 4, Tables S7 and S8 in Additional file 1), although TACR1 rs3755468 showed a trend toward an association with metoclopramide administration in 0–24 h a.a.e. in the dominant model (χ^2^ test, P = 6.05 × 10^− 2^; Table 4).
Table 4. Association between genotypes of TACR1 rs3755468 SNP and Metoclopramide administration (dominant model, χ^2^ test)Hours after anesthesia endpointMetoclopramide administrationGenotypes P CC (n = 36)CT + TT (n = 84)0–2with1 (3%)0 (0%)2.50 × 10^− 1^without35 (97%)84 (100%)2–24with12 (33%)15 (18%)1.26 × 10^− 1^without24 (67%)69 (82%)0–24with13 (36%)15 (18%)6.05 × 10^− 2†^without23 (64%)69 (82%)^†^0.05 < P < 0.10
The results suggested that TACR1 rs3755468 showed a trend toward an association with PONV in 0–24 h a.a.e. in the present study, partially consistent with the previous report. Because TACR1 rs3755468 showed a trend toward an association with metoclopramide administration in 0–24 h a.a.e. in the dominant model, we mainly focused thereafter on the dominant model for TACR1 rs3755468.
TACR1 rs3755468 SNP was significantly associated with NRS score in 0–2 h a.a.e.
To further examine the association between TACR1 rs3755468 and PONV or the efficacy of ondansetron, we investigated whether there was a significant association between TACR1 rs3755468 and patients’ NRS scores in 0–2 h, 2–24 h, or 0–24 h a.a.e. In 0–24 h a.a.e., TACR1 rs3755468 showed a trend toward an association with the mean maximum NRS score in the dominant model (t-test, P = 8.07 × 10^− 2^; Table 5).
Table 5. Association between genotypes of TACR1 rs3755468 SNP and NRS scores (dominant model, t-test)Hours after anesthesia endpointNRS values (mean ± SD) P CCCT + TT0-2^a^1.14 ± 2.160.32 ± 0.949.97 × 10^− 3^2-24^a^1.81 ± 2.551.08 ± 2.413.40 × 10^− 1^0-24^b^2.33 ± 2.871.05 ± 2.098.07 × 10^− 2♰^^^P < 0.05^†^0.05 < P < 0.10^a^NRS score assessed during indicated hours after anesthesia^b^Maximum NRS score in 0–24 h
To examine the effect of ondansetron, we analyzed the association in 0–2 h and 2–24 h a.a.e. In 0–2 h a.a.e., TACR1 rs3755468 showed a significant association with the mean NRS score in the dominant model (t-test, P = 9.97 × 10^− 3^; Table 5), whereas in 2–24 h a.a.e., TACR1 rs3755468 did not show a significant association with the mean NRS score in the dominant model (t-test, P > 0.05; Table 5). In the genotypic and recessive models, TACR1 rs3755468 showed no significant association (one-way ANOVA or t-test, P > 0.05; Tables S9 and S10 in Additional file 1), except for showing a significant association in the genotypic model in 0–2 h a.a.e. (one-way ANOVA, P = 3.74 × 10^− 2^; Table S9 in Additional file 1). These results suggest that the TACR1 rs3755468 showed a significant association with PONV under the sufficient influence of ondansetron (0–2 h a.a.e.), indicating that TACR1 rs3755468 is not associated with the effect of ondansetron.
The previous study suggested that the CC genotype of TACR1 rs3755468 was associated with a higher risk of PONV [17]. To investigate whether the CC genotype of TACR1 rs3755468 is associated with a higher risk of PONV in the present study, we analyzed the genotype distribution in the dominant model (Table 5). In 0–2 h a.a.e., CC carriers showed a higher mean NRS score than CT + TT carriers (CC, 1.14 ± 2.16; CT + TT, 0.32 ± 0.94; Table 5). These results suggest that CC carriers of TACR1 rs3755468 had a significantly higher NRS score under the sufficient influence of ondansetron (0–2 h a.a.e.), suggesting that individuals with the CC genotype of TACR1 rs3755468 are more prone to nausea without being associated with the effect of ondansetron.
Nausea related to CHRM3 is qualitatively different from nausea related to TACR1
To analyze the effect of time course a.a.e. on nausea, we analyzed the association between 0-2 h or 2–24 h a.a.e. and mean NRS scores in genotypes of the CHRM3 rs2165870 and TACR1 rs3755468 SNPs. The AA genotype of CHRM3 rs2165870 showed a trend toward an association with an increasing mean NRS score over time (mean NRS score: 0–2 h a.a.e., 0.00 ± 0.00; 2–24 h a.a.e., 4.25 ± 2.59; t-test, P = 6.53 × 10^− 2^; Table 3; Fig. 2), whereas the CC genotype of TACR1 rs3755468 showed an unchanged mean NRS score over time (mean NRS score: 0–2 h a.a.e., 1.14 ± 2.16; 2–24 h a.a.e., 1.81 ± 2.55; t-test, P > 0.1; Table 5; Fig. 2). These results suggest that the AA genotype of CHRM3 rs2165870 has a tendency toward suppressing nausea with ondansetron, whereas the CC genotype of TACR1 rs3755468 does not respond to ondansetron sufficiently for nausea suppression. In GG + GA genotypes of CHRM3 rs2165870 and CT + TT genotypes of TACR1 rs3755468, the mean NRS scores significantly increased over time (CHRM3 rs2165870 GG + GA, mean NRS score: 0–2 h a.a.e., 0.57 ± 1.27; 2–24 h a.a.e., 1.38 ± 2.45; t-test, P = 2.56 × 10^− 3^; TACR1 rs3755468 CT + TT, mean NRS score: 0–2 h a.a.e., 0.32 ± 0.94; 2–24 h a.a.e., 1.08 ± 2.41; t-test, P = 2.23 × 10^− 3^; Tables 3 and 5; Fig. 2).
Fig. 2. Associations between NRS scores 0–2 h and 2–24 h after anesthesia endpoint in genotypes of CHRM3 rs2165870 and TACR1 rs3755468 SNPs. We analyzed associations between NRS scores 0–2 h and 2–24 h after anesthesia endpoint (a.a.e.) in (A) AA and (B) AG + GG genotypes of CHRM3 rs2165870 and (C) CC and (D) CT + TT genotypes of TACR1 rs3755468 SNPs (t-test). The AA genotype of CHRM3 rs2165870 showed a trend toward an association with an increasing mean NRS score over time (A), whereas the CC genotype of TACR1 rs3755468 showed an unchanged mean NRS score over time (C), suggesting that the AA genotype of CHRM3 rs2165870 has a tendency toward the suppression of nausea with ondansetron, whereas the CC genotype of TACR1 rs3755468 does not respond to ondansetron sufficiently for nausea suppression. The 95% confidence intervals were (A) -9.00 to 0.50, (B) -1.12 to -0.25, (C) -1.60 to 0.27, and (D) -1.32 to -0.30. Each plot represents a particular patient. Error bars indicate the SD. ^*^P < 0.05, ^†^0.05 < P < 0.10
To further examine differences in nausea related to CHRM3 rs2165870 and TACR1 rs3755468, we analyzed the association among the AA genotype of CHRM3 rs2165870, CC genotype of TACR1 rs3755468, and mean NRS scores in 0–2 h and 2–24 h a.a.e. The two-way mixed-effect ANOVA showed the following: interaction, P = 4.39 × 10^− 2^, effect of “time”, P = 9.4 × 10^− 3^; effect of “genotype”, P > 0.05. These results clearly showed that mean NRS scores were significantly associated with time, with a significant “time” × “genotype” interaction. Sidak’s multiple-comparison post hoc test showed that the AA genotype of CHRM3 rs2165870 was significantly associated with time (P = 3.26 × 10^− 2^), but the CC genotype of TACR1 rs3755468 was not (P > 0.05). These results suggest that nausea that is related to CHRM3 is qualitatively different from nausea that is related to TACR1.
Public database results on CHRM3 rs2165870
To investigate the function of CHRM3 rs2165870, we searched public databases. According to the Adult Genotype-Tissue Expression (GTEx) project, CHRM3 rs2165870 is located at a splicing quantitative trait locus (sQTL) at 239795586:239841486 on GRCh37 (239632286:239678186 on GRCh38) (Figs. 3 and 4) and 239795586:239797623 on GRCh37 (239632286:239634323 on GRCh38) in the human ACC [28]. Transcripts with splicing at 239795586:239841486 increase as the number of G alleles in the genotype increases (Fig. 3). For transcripts with splicing at 239795586:239797623, we could not confirm the transcript with splicing that has been reported to date. The results suggest that CHRM3 rs2165870 manipulates CHRM3 expression through an alteration of splicing in the ACC.
Fig. 3CHRM3 expression levels for each genotype of CHRM3 rs2165870 after splicing in the anterior cingulate cortex. CHRM3 rs2165870 is located at a splicing quantitative trait locus (sQTL) at 239795586:239841486 on GRCh37 (239632286:239678186 on GRCh38) in the anterior cingulate cortex (ACC) [28]. Figure adapted from GTEx Portal (public domain).
Fig. 4CHRM3 rs2165870 affects splicing, and transcripts start from around CHRM3 rs2165870. Representative transcripts of CHRM3 are shown. A representative short transcript starts from around 10 kilobases (kb) downstream of CHRM3 rs2165870. CHRM3 rs2165870 (location on chromosome 1: 239785420) is located at the red triangle. The red rectangle represents the open chromatin region on the genome around CHRM3 rs2165870 in blood vessels, stomach, and small intestine. The green rectangle represents the enhancer region on the genome around CHRM3 rs2165870 in the small intestine and stomach. CHRM3 rs2165870 is located at a splicing quantitative trait locus (sQTL) at 239795586:239841486, indicated in the red polyline between the exons above the gene. The numbers on the upper side of the figure are locations on GRCh37 on chromosome 1. Blue boxes represent the exon, and blue lines represent the intron
Furthermore, according to the FANTOM CAT database in the ZENBU genome browser, DNase-seq results in 10 kilobases (kb) upstream and downstream of CHRM3 rs2165870 showed an open chromatin region around the SNP on the genome in blood vessels, stomach, and small intestine (P_value_signal: blood vessels, 2.23; stomach, 2.57; small intestine, 4.28; Fig. 4 and Table S11 in Additional file 2), and an enhancer region exists around the SNP on the genome in the small intestine and stomach (Fig. 4 and Table S12 in Additional file 3) [30]. According to the NCBI database, three short transcripts start from around 10 kb downstream of CHRM3 rs2165870 (Fig. 4, transcript variants 2, X21, and X13), producing full-length CHRM3 protein [32]. These results suggest that the short mRNAs would be expressed from around CHRM3 rs2165870 in these human tissues (blood vessels, stomach, and small intestine), followed by the expression of functional CHRM3 protein.
Public database results on TACR1 rs3755468
To investigate the function of the TACR1 rs3755468, we searched public databases. According to the FANTOM CAT database in the ZENBU genome browser, some of the transcripts of the antisense noncoding RNA LOC105374811 gene (Ensembl: ENSG00000270571) span the transcription start site of TACR1 mRNA (location of the mRNA start: 75426645; Fig. 5 and Table S13 in Additional file 4) [31]. These LOC105374811 transcripts are expressed from around 1 kb upstream of TACR1 rs3755468 (location of the transcripts start: 75381413, 75381443, 75381490, and 75381512; Fig. 5 and Table S13 in Additional file 4).
Fig. 5. Transcripts of antisense LOC105374811 start around TACR1 rs3755468 and overlap with the transcription start site of TACR1. Representative transcripts of TACR1 and LOC105374811 are shown. TACR1 rs3755468 (location on chromosome 2: 75382391) exists around 1 kb downstream of the transcription start site of LOC105374811 (Table S13 in Additional file 4). The long transcripts of LOC105374811 overlap with the transcription start site of TACR1. The numbers on the upper side of the figure are locations on GRCh37 on chromosome 2. Blue or purple boxes represent the exon, and blue or purple lines represent the intron
According to the GTEx project, the TACR1 rs3755468 is located at an expression quantitative trait locus (eQTL) for TACR1 (Fig. 6A) and LOC105374811 (Fig. 6B) [27]. As the number of C alleles in genotypes of TACR1 rs3755468 increases, the expression of antisense RNA LOC105374811 decreases, whereas TACR1 mRNA increases (Fig. 6). The data suggest that more antisense RNA LOC105374811 is transcribed when more TACR1 transcription is inhibited. This raises the possibility that antisense RNA LOC105374811 expression in CC carriers of TACR1 rs3755468 is lower than in the other genotypes, leading to higher TACR1 mRNA transcription.
Fig. 6TACR1 and antisense RNA LOC105374811 expression levels in each genotype of TACR1 rs3755468. TACR1 rs3755468 is located at an expression quantitative trait locus (eQTL) for TACR1 (A) and LOC105374811 (B) [27]. Figure adapted from GTEx Portal (public domain)
Discussion
Genetic factors are suggested to be risk factors for PONV [35]. We inferred that genetic factors are responsible for the appearance of PONV even after the combined prophylactic administration of dexamethasone, ondansetron, and propofol during general anesthesia. Among the genes that are involved in the mechanism of nausea through the area postrema and vagus nerve, which are related to the mechanism of action of ondansetron, we focused on the CHRM3 and TACR1 genes, which have SNPs that are significantly associated with nausea. In the present study, we evaluated the influence of the CHRM3 rs2165870 and TACR1 rs3755468 SNPs on PONV in a Japanese population who underwent orthognathic surgery under PONV prophylaxis with ondansetron and evaluated the different effects of ondansetron on nausea that is associated with these SNPs.
AA genotype of CHRM3 rs2165870 is associated with a higher risk of nausea after orthognathic surgery,* and ondansetron is effective for preventing nausea*.
CHRM3 rs2165870 had no significant association with metoclopramide administration in 0–2 h a.a.e. under the sufficient influence of ondansetron, whereas patients with the AA genotype of CHRM3 rs2165870 had a significant need for metoclopramide administration in 2–24 h a.a.e. under the insufficient influence of ondansetron. Moreover, CHRM3 rs2165870 had no significant association with mean NRS scores in 0–2 h a.a.e. under the sufficient influence of ondansetron, whereas patients with the AA genotype of CHRM3 rs2165870 had a significantly higher mean NRS score in 2–24 h a.a.e. under the insufficient influence of ondansetron (mean NRS score: 0–2 h a.a.e., 0.00; 2–24 h a.a.e., 4.25; Table 3). These results suggest that AA carriers of CHRM3 rs2165870 have a higher risk of nausea after orthognathic surgery while ondansetron is effective. In AA carriers of CHRM3 rs2165870, because nausea tended to occur under the insufficient influence of ondansetron, additional ondansetron administration is recommended.
A few studies have reported on CHRM3 rs2165870 in Chinese populations. Wang et al. and Cai et al. reported that CHRM3 rs2165870 contributed to a higher risk for PONV in AA carriers in Chinese populations [16, 23], consistent with the present findings that patients with the AA genotype of CHRM3 rs2165870 has a higher risk of nausea after orthognathic surgery (Tables 2 and 3). Wang et al. also reported that AA carriers of CHRM3 rs2165870 were associated with a higher response to ondansetron in the Chinese Han population [18], consistent with the present findings that ondansetron was effective for preventing nausea among individuals with the AA genotype of CHRM3 rs2165870 (Tables 2 and 3).
According to the GTEx portal, CHRM3 rs2165870 is located at an sQTL in the ACC (Fig. 3) [28], which is involved in nausea [6]. This implies that CHRM3 rs2165870 could manipulate CHRM3 expression through an alteration of splicing in the ACC. Furthermore, an open chromatin region, which contains regulatory regions, exists around the SNP on the genome in blood vessels, the small intestine, and the stomach. Together with the fact that the short transcripts start from around CHRM3 rs2165870, producing full-length CHRM3 [32], the short mRNAs would be expressed downstream from CHRM3 rs2165870 in these human tissues [29]. The amount of short mRNA expression might depend on the particular genotype of CHRM3 rs2165870. For CHRM3 expression in human tissues, it is expressed at low to medium levels in the gastrointestinal tract according to The Human Protein Atlas [29]. Because stimulating blood vessels and the gastrointestinal tract leads to nausea [36], higher CHRM3 expression in blood vessels and/or the gastrointestinal tract could easily lead to nausea, depending on the particular genotype of CHRM3 rs2165870.
Allele frequencies of CHRM3 rs2165870 in the present study were the following: G-allele frequency = 80%, A-allele frequency = 20%. According to the NCBI database, the allele frequencies in the present study are similar to the East Asian population (G-allele frequency = 81%, A-allele frequency = 19%). Other regional populations have some variation (e.g., American population: G allele frequency = 67%, A allele frequency = 33%, European population: G allele frequency = 66%, A allele frequency = 34%, African population: G allele frequency = 98%, A allele frequency = 2%) [33]. Notably, the African population has less variation and is almost homogenous in allele frequency. The A-allele frequency in the present study was 20%, whereas in the African population, it is 2%. Thus, few AA carriers of CHRM3 rs2165870 exist in the African population, making it difficult to assess the risk of PONV according to CHRM3 rs2165870 in the African population. In the African population, because the proportion of AA carriers of CHRM3 rs2165870 is lower than in other regional populations, the proportion that has a PONV risk that is associated with CHRM3 rs2165870 is lower than in other regional populations according to the present results.
CC genotype of TACR1 rs3755468 is associated with a higher risk of nausea after orthognathic surgery,* responding less to ondansetron for preventing nausea*.
Hayase et al. reported that TACR1 rs3755468 contributed to a higher risk of PONV in CC carriers in Japanese populations who underwent lower abdominal surgery [17], which is consistent with the present findings that CC carriers of TACR1 rs3755468 had a higher risk of nausea after orthognathic surgery (Table 5).
CC carriers of TACR1 rs3755468 had a significantly higher mean NRS score than carriers of other genotypes in both 0–2 and 2–24 h a.a.e., regardless of the influence of ondansetron (Table 5). The results suggest that CC carriers of TACR1 rs3755468 have a higher risk of nausea after orthognathic surgery without responding sufficiently to ondansetron. For CC carriers of TACR1 rs3755468, administering an antiemetic drug other than ondansetron may be recommended.
In 0–24 h a.a.e., CC carriers of TACR1 rs3755468 showed a trend toward an association with metoclopramide administration (Table 4), implying that they tend to experience nausea. For mean NRS scores in 2–24 h a.a.e., CC carriers of TACR1 rs3755468 had lower mean NRS scores than AA carriers of CHRM3 rs2165870 (mean NRS score: CC carriers of TACR1 rs3755468, 1.81; AA carriers of CHRM3 rs2165870, 4.25; P = 3.73 × 10^− 2^; Tables 3 and 5). These results suggest that CC carriers of TACR1 rs3755468 had lower-grade nausea. CC carriers of TACR1 rs3755468 often have NRS scores ≤ 3, which is not fit for metoclopramide treatment even if they have nausea. This would be a reason why no significant association was found between TACR1 rs3755468 and metoclopramide administration.
The antisense noncoding RNA LOC105374811 gene that spans the transcription start site is expressed from around TACR1 rs3755468 (Fig. 5 and Table S13 in Additional file 4) [31]. According to the public database, more antisense RNA LOC105374811 is transcribed when more TACR1 transcription is inhibited (Fig. 6) [27]. In individuals with the CC genotype of TACR1 rs3755468, who are more prone to nausea, antisense RNA LOC105374811 expression was lower than in the other genotypes, leading to higher TACR1 mRNA transcription than in the other genotypes. Thus, TACR1 rs3755468 would manipulate TACR1 mRNA transcription through antisense RNA LOC105374811 expression, affecting nausea.
Allele frequencies of TACR1 rs3755468 in the present study were the following: C-allele frequency = 55%, T-allele frequency = 45%. The allele frequencies in the present study are similar to the East Asian population (C-allele frequency = 51%, T-allele frequency = 49%). Other regional populations have some variation (e.g., American population: C allele frequency = 57%, A allele frequency = 43%; European population: C allele frequency = 54%, T allele frequency = 46%, African population: C allele frequency = 64%, T allele frequency = 36%) [34]. The lower response to ondansetron and nausea risk in individuals with the CC genotype of TACR1 rs3755468 should be examined in populations of other countries in future studies.
Hayase et al. reported that TACR1 rs3755468 is located in the predicted estrogen response element and is associated with female sex in severe PONV [17]. Estradiol increased TACR1 mRNA levels, which were related to an increase in ligand binding to TACR1 [37]. In the present study, TACR1 rs3755468 showed a significant association with mean NRS scores in 0–2 h a.a.e. in the dominant model in a group of females (P = 3.14 × 10^− 3^), whereas no significant association was found in males (P > 0.05). The present study confirmed that TACR1 rs3755468 is associated with female sex in PONV.
Nausea mechanism related to CHRM3 rs2165870 and TACR1 rs3755468.
In AA carriers of CHRM3 rs2165870, the present data showed an inverse correlation between the presence of ondansetron and mean NRS scores (Table 3). In contrast, CC carriers of TACR1 rs3755468 had a significantly higher mean NRS score in both 0–2 and 2–24 h a.a.e., regardless of the presence or absence of ondansetron (Table 5). This indicates that AA carriers of CHRM3 rs2165870 exhibited a preventive effect of ondansetron against nausea, whereas CC carriers of TACR1 rs3755468 exhibited only a limited preventive effect of ondansetron against nausea. Thus, these SNPs may affect nausea in a qualitatively different manner through a different mechanism or pathway.
Only around 15% of ondansetron penetrates the BBB [9]. Thus, it mainly exerts its effects outside the BBB, such as in the area postrema and vagus nerve of the upper gastrointestinal tract. In the upper gastrointestinal tract, CHRM3 is expressed at low to medium levels, whereas TACR1 has low expression at most [38]. CHRM3, whose-related nausea responded to ondansetron, is expressed at higher levels in the upper gastrointestinal tract compared to TACR1, whose-related nausea did not respond to ondansetron, consistent with the access of ondansetron on CHRM3 in the upper gastrointestinal tract outside the BBB. Ruff et al. identified a specific population of cortical γ-aminobutyric acid (GABA)ergic neurons with neuronal nitric oxide synthase and TACR1 in mice and humans, and TACR1 neurons are strong mediators of vasodilation, which is one cause of nausea [7], through feedforward excitatory pathways in the CNS [39]. Thus, TACR1 neurons in the CNS could play a central role in TACR1-related nausea. Because ondansetron hardly passes through the BBB and TACR1 is expressed at lower levels outside the CNS, ondansetron would be insufficient to suppress TACR1-related nausea. Thus, ondansetron may suppress CHRM3-related nausea predominantly outside the BBB. Altogether, our results indicate that CHRM3 and TACR1 are related to nausea in qualitatively different ways.
In conclusion, our findings suggest that AA carriers of CHRM3 rs2165870 and CC carriers of TACR1 rs3755468 are significantly associated with greater nausea after orthognathic surgery. The HTR3A antagonist ondansetron prevented nausea in AA carriers of CHRM3 rs2165870 but did not in CC carriers of TACR1 rs3755468. The present study elucidates the mechanisms of PONV and may contribute to providing tailor-made preventive care for PONV depending on high-risk genotypes of CHRM3 rs2165870 and TACR1 rs3755468.
The present study has a few limitations. First, the AA genotype of CHRM3 rs2165870 was a minority among the patient subjects, with only four patients. Thus, further studies with larger sample sizes are needed. Second, this study was an observational study and thus did not directly demonstrate a causal relationship between genotype and antiemetic effect.
Electronic supplementary material
Below is the link to the electronic supplementary material.
Supplementary Material 1
Supplementary Material 2
Supplementary Material 3
Supplementary Material 4
Supplementary Material 5
The reference list from the paper itself. Each links out to its DOI / PubMed record.
- 1Wp Calc. Equilibrium Hardy-Weinberg Accessed on December 18, 2024. Available from: https://wpcalc.com/en/equilibrium-hardy-weinberg/
- 2GT Ex Portal. rs 3755468 of TACR 1 and ENSG 00000270571 genes, Multi-tissue e QTL plot, Variant page. Accessed on December 18. 2024. Available from: https://gtexportal.org/home/snp/rs 3755468
- 3GT Ex Portal. rs 2165870 of CHRM 3 gene, Multi-tissue s QTL plot, Variant page. Accessed on July 1. 2025. Available from: https://gtexportal.org/home/snp/rs 2165870
- 4The Human Protein Atlas. CHRM 3. Accessed on December 18. 2024. Available from: https://www.proteinatlas.org/search/CHRM 3
- 5ZENBU 3.0. CHRM 3 gene, hg 19::chr 1:239417657.240210969+. Accessed on December 9. 2024. Available from: https://fantom.gsc.riken.jp/zenbu/g Lyphs/#config=rr Gag Fwd Gxmsqx 5Mg_OFEC;loc=hg 19::chr 1:239417657.240210969+.
- 6ZENBU 3.0. TACR 1 gene, hg 19::chr 2:75235326.75464909+. Accessed on December 9. 2024. Available from: https://fantom.gsc.riken.jp/zenbu/g Lyphs/#config=rr Gag Fwd Gxmsqx 5Mg_OFEC;loc=hg 19::chr 2:75235326.75464909+.
- 7NCBI. CHRM 3 gene. Accessed on December 18. 2024. Available from: https://www.ncbi.nlm.nih.gov/gene/1131
- 8NCBI. rs 2165870 SNP. Accessed on December 18. 2024. Available from: https://www.ncbi.nlm.nih.gov/snp/rs 2165870