Using Extreme Value Statistics to Reconceptualize Psychopathology as Extreme Deviations From a Normative Reference Model
Charlotte Fraza, Mariam Zabihi, Christian F. Beckmann, Andre F. Marquand

TL;DR
This paper introduces a new statistical framework using extreme value theory to better understand and detect extreme deviations in neuroimaging data, which could improve diagnosis of psychiatric disorders.
Contribution
The novel contribution is combining normative models with multivariate extreme value statistics to model extreme deviations in neuroimaging data.
Findings
A framework using normative models and extreme value statistics was developed to model extreme deviations in neuroimaging data.
The approach was demonstrated on the UK Biobank dataset, showing how extreme values can be used to estimate risk and detect atypicality.
A tail pairwise dependency matrix (TPDM) was introduced to capture multivariate tail dependencies in biological markers.
Abstract
For many problems in neuroimaging, the most informative features occur in the tail of the distribution. For example, when considering psychiatric disorders as deviations from a ‘norm’, the tails of the distribution are considerably more informative than the bulk of the distribution for understanding risk, stratifying and predicting such disorders, and for anomaly detection. Yet, most statistical methods used in neuroimaging focus on modeling the bulk and fail to adequately capture extreme values occurring in the tails. To address this, we propose a framework that combines normative models with multivariate extreme value statistics to accurately model extreme deviations of a reference cohort for individual participants. Normative models are now widely used in clinical neuroscience and similar to the employment of normative growth charts in pediatric medicine to track a child's weight in…
Genes, proteins, chemicals, diseases, species, mutations and cell lines named across the full text — each resolved to its canonical identifier and authoritative record.
Click any figure to enlarge with its caption.
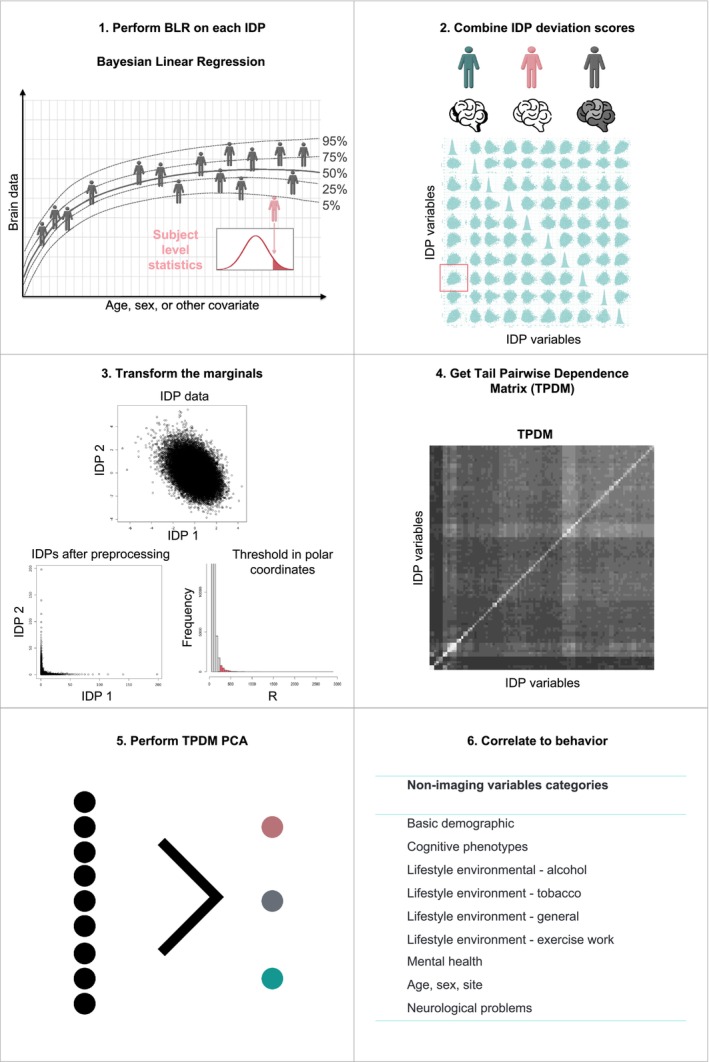 Figure 1
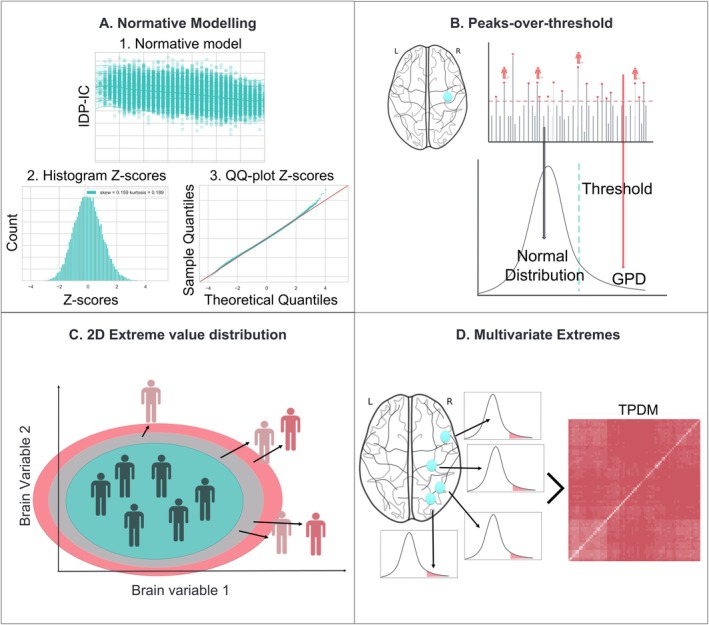 Figure 2
 Figure 3
 Figure 4
 Figure 5
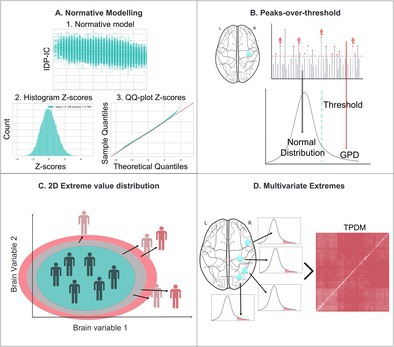 Figure 6
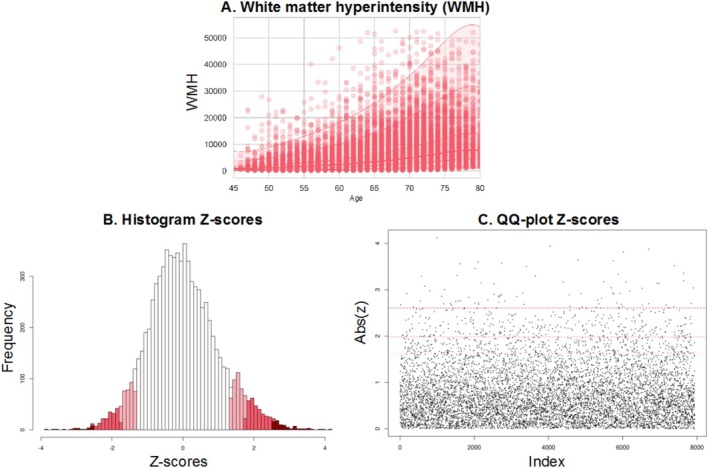 Figure 7
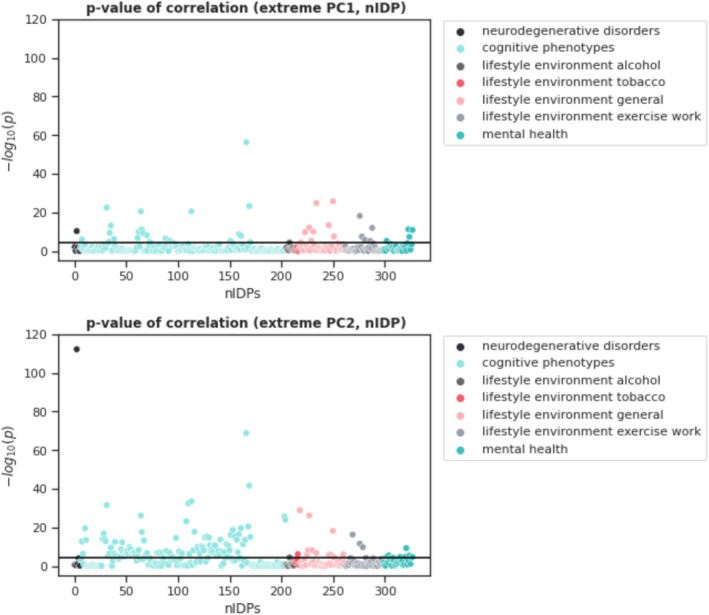 Figure 8
 Figure 9
 Figure 10
 Figure 11
Peer Reviews
No public reviews on file for this paper yet. If you reviewed it on a platform where reviews are public (OpenReview, ICLR, NeurIPS, ICML), you can paste yours below so the community can read it here.
Videos
No videos yet. Explain this paper in a talk, walkthrough, or lecture? Add one.
Taxonomy
TopicsFunctional Brain Connectivity Studies · Health, Environment, Cognitive Aging · Health Systems, Economic Evaluations, Quality of Life