A promoter library for tuning gene expression in Cupriavidus necator under autotrophic conditions
Wataru Kitagawa, Kensuke Igarashi, Ryo Nagasawa, Shigeyuki Kakizawa, Mizuki Horino, Kosuke Fujishima, Toshiaki Fukui, Souichiro Kato

TL;DR
Researchers created a set of promoters for tuning gene expression in Cupriavidus necator under autotrophic conditions, enabling better CO2-based biomanufacturing.
Contribution
First promoter library for C. necator under autotrophic conditions without external inducers.
Findings
Seven promoters upregulate gene expression under autotrophic conditions.
Three promoters show constitutive expression under both autotrophic and heterotrophic conditions.
Exogenous genes placed downstream of these promoters are expressed under autotrophic conditions.
Abstract
Cupriavidus necator holds promise for biomanufacturing using CO2 as the primary feedstock, leveraging its capabilities to produce valuable chemicals and grow autotrophically using H2 as an energy source. Although various genetic tools, including promoters, have been developed to fine-tune gene expression in C. necator, no such tools have been developed for the use in autotrophic conditions. This study aimed to establish a promoter library that functions in C. necator grown under autotrophic conditions. C. necator was cultured under both heterotrophic and autotrophic conditions, and comparative transcriptome analysis was performed to identify genes/operons specifically upregulated under autotrophic conditions and those constitutively expressed. The upstream sequences of the candidate genes/operons were examined to identify their promoter regions. We established a promoter evaluation…
Genes, proteins, chemicals, diseases, species, mutations and cell lines named across the full text — each resolved to its canonical identifier and authoritative record.
Click any figure to enlarge with its caption.
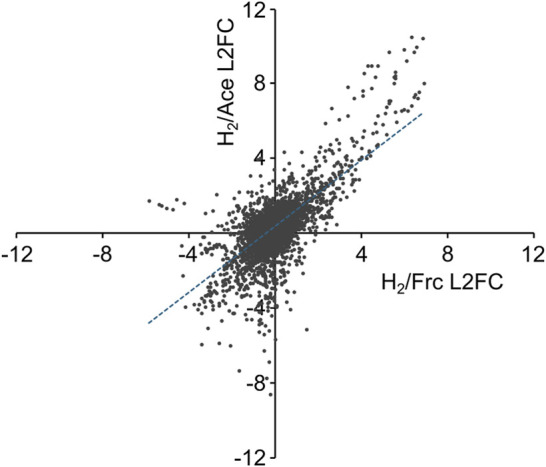 FIGURE 1
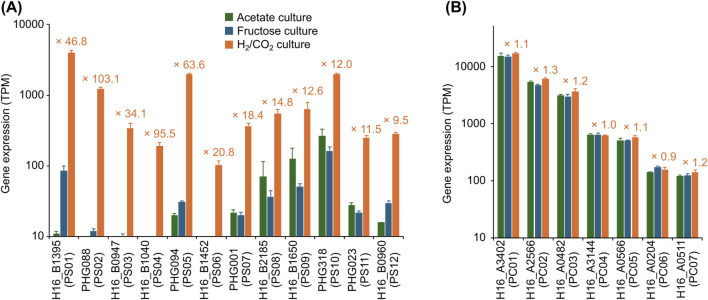 FIGURE 2
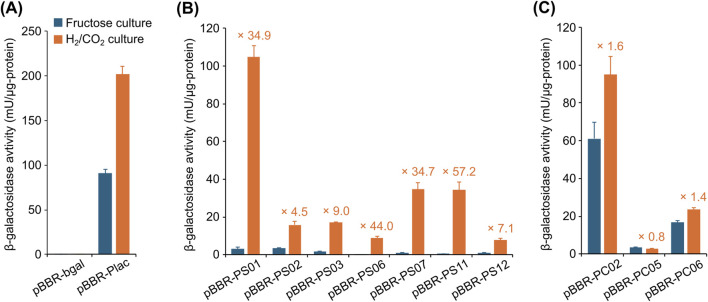 FIGURE 3
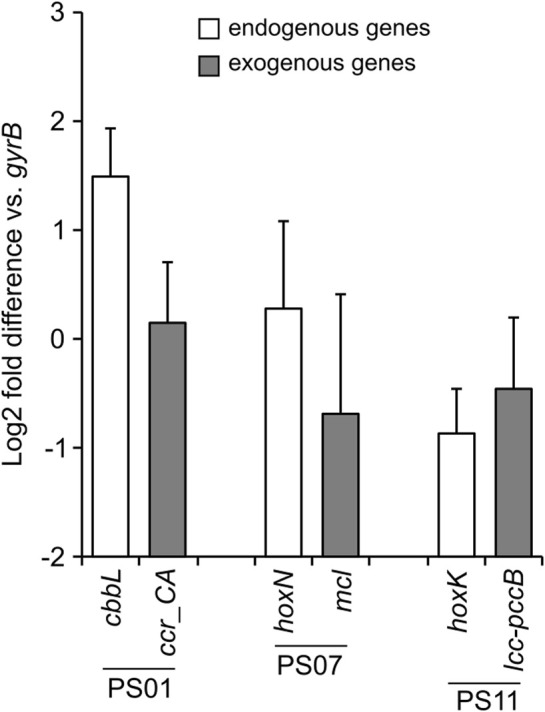 FIGURE 4
| Bacterial strain | Description | Reference |
|---|---|---|
|
| ||
| H16 | Wild type, PHA+, non-glucose assimilation | DSM 428 |
| IP-015 | H16 derivative, ∆ |
|
| IP015DL | IP-015 derivative, containing | This study |
| DL_1A23 | IP-015DL derivative, containing Em-CoA pathway genes | This study |
|
| ||
| XL1-Blue |
| Clontech |
| S17-1 |
|
|
| Plasmid | Description | Reference |
|---|---|---|
| pBBR1MCS-2 | Broad host range plasmid; |
|
| pBBR-bgal | Derivative of pBBR1-MCS2, promoter-probe vector, containing | This study |
| pBBR-PS01 | Derivative of pBBR-bgal, containing upstream region of H16_B1395 | This study |
| pBBR-PS02 | Derivative of pBBR-bgal, containing upstream region of PHG088 | This study |
| pBBR-PS03 | Derivative of pBBR-bgal, containing upstream region of H16_B0947 | This study |
| pBBR-PS04 | Derivative of pBBR-bgal, containing upstream region of h16_B1040 | This study |
| pBBR-PS05 | Derivative of pBBR-bgal, containing upstream region of PHG094 | This study |
| pBBR-PS06 | Derivative of pBBR-bgal, containing upstream region of H16_B1452 | This study |
| pBBR-PS07 | Derivative of pBBR-bgal, containing upstream region of PHG001 | This study |
| pBBR-PS08 | Derivative of pBBR-bgal, containing upstream region of H16_B2185 | This study |
| pBBR-PS09 | Derivative of pBBR-bgal, containing upstream region of H16_B1650 | This study |
| pBBR-PS10 | Derivative of pBBR-bgal, containing upstream region of PHG318 | This study |
| pBBR-PS11 | Derivative of pBBR-bgal, containing upstream region of PHG023 | This study |
| pBBR-PS12 | Derivative of pBBR-bgal, containing upstream region of H16_B0960 | This study |
| pBBR-PC01 | Derivative of pBBR-bgal, containing upstream region of H16_ A3402 | This study |
| pBBR-PC02 | Derivative of pBBR-bgal, containing upstream region of H16_ A2566 | This study |
| pBBR-PC03 | Derivative of pBBR-bgal, containing upstream region of H16_ A0482 | This study |
| pBBR-PC04 | Derivative of pBBR-bgal, containing upstream region of H16_ A3144 | This study |
| pBBR-PC05 | Derivative of pBBR-bgal, containing upstream region of H16_ A0566 | This study |
| pBBR-PC06 | Derivative of pBBR-bgal, containing upstream region of H16_ A0204 | This study |
| pBBR-PC07 | Derivative of pBBR-bgal, containing upstream region of H16_ A0511 | This study |
| pBBR-Plac | Derivative of pBBR-bgal, containing | This study |
| pK18mobsacB | Cloning vector, |
|
| pK18A0404-m266 | Derivative of pK18mobsacB, containing | This study |
| pSK026-CreN | Derivative of pK18mobsacB, containing | This study |
| pSK026_Unit1A23 | Derivative of pSK026-CreN, containing the engineered CO2 fixation pathway genes | This study |
Peer Reviews
No public reviews on file for this paper yet. If you reviewed it on a platform where reviews are public (OpenReview, ICLR, NeurIPS, ICML), you can paste yours below so the community can read it here.
Videos
No videos yet. Explain this paper in a talk, walkthrough, or lecture? Add one.
Taxonomy
TopicsChromium effects and bioremediation · Microbial metabolism and enzyme function · Arsenic contamination and mitigation
1 Introduction
Biomanufacturing, a biotechnology that utilizes biological systems for the synthesis of commercially relevant compounds, has garnered significant attention due to its energy efficiency, reduced dependence on fossil resources, and its pivotal role in fostering a sustainable economy (Clomburg et al., 2017; Zhang et al., 2017). Conventional biomanufacturing has mainly relied on edible organics, such as sugars, proteins and oils, derived from cultivated crops. However, concerns of competition with food, land use issues, depletion of water resources, etc., necessitate the exploration of more sustainable feedstock alternatives (Alalwan et al., 2019; Scown, 2022). In addition to utilizing non-edible biomass (Singh et al., 2022) and algal biomass (Sørensen et al., 2022), biomanufacturing processes that use CO_2_ as a primary feedstock are garnering substantial interest (Salehizadeh et al., 2020; Bachleitner et al., 2023). Autotrophic microorganisms, capable of utilizing electricity, H_2_, CO, and other energy sources for CO_2_ fixation, are employed as biocatalysts for CO_2_-based biomanufacturing (Igarashi and Kato, 2017; Kurt et al., 2023).
Cupriavidus necator (formerly known as Ralstonia eutropha) is a promising bacterium for CO_2_-based biomanufacturing due to its ability to produce useful chemicals and CO_2_ fixation capacity (Panich et al., 2021; Tang et al., 2023; Weldon and Euler, 2025). C. necator has a natural biosynthetic pathway for producing the biodegradable polymer poly(3-hydroxybutyrate). The genetic modification and metabolic engineering of C. necator have been extensively investigated to enhance the efficient production of practical biopolymers (Koller and Mukherjee, 2022; Tang et al., 2022; Morlino et al., 2023) and to facilitate the biosynthesis of other valuable compounds, such as biofuels (Chakravarty and Brigham, 2018). Although biomanufacturing using C. necator has relied on edible sugars and oils derived from cultivated crops, there is a significant demand for more sustainable feedstocks (Zhang et al., 2022). The ability of C. necator to grow autotrophically using H_2_ as an energy source is expected to enable the CO_2_-based biomanufacturing. In fact, it has been reported that C. necator has ability to produce biopolymers from CO_2_ (Ishizaki and Tanaka, 1991), and the productivity can be enhanced through genetic engineering, such as overexpressing the CO_2_-fixing pathway (Kim et al., 2022) and the carbonic anhydrase (Thorbecke et al., 2021), as well as reactor engineering (Tanaka et al., 2023; Di Stadio et al., 2024).
The practical application of CO_2_-based biomanufacturing requires engineered C. necator strains that can efficiently produce the target compounds under autotrophic conditions. Although synthetic biology toolkits such as genetic engineering vectors, transformation methods, genome engineering techniques, and information of central and peripheral metabolic pathways are available, promoters suitable for autotrophic growth conditions are limited. While promoters that function in C. necator have been extensively explored and developed, they were designed for use under heterotrophic and/or PHA-producing conditions (Fukui et al., 2011; Alagesan et al., 2018; Johnson et al., 2018; Pan et al., 2021; Mishra et al., 2024; Santolin et al., 2024; Wang et al., 2024). Several research groups have reported the expression of exogenous genes in C. necator under autotrophic conditions (Thorbecke et al., 2021; Kim et al., 2022; Arhar et al., 2024; Panich et al., 2024). The promoters used in these studies include constitutive and inducible promoters functioning across diverse microbial species (lac promoter [P_ lac ] and araBAD promoter [P_BAD], respectively), as well as endogenous promoters expected to function robustly under autotrophic conditions (cbb promoter, regulating gene clusters of the Calvin-Benson-Bassham [CBB] cycle enzymes). There has been no research on comprehensive exploration of promoters capable of fine-tuning gene expression in C. necator under autotrophic conditions, which is essential for the practical implementation of CO_2_-based biomanufacturing processes.
In this study, we aimed to develop a promoter library for C. necator that functions under autotrophic conditions. The gene expression of C. necator was compared under heterotrophic and autotrophic growth conditions to identify candidate promoters. The activities of the candidate promoters were assessed by β-galactosidase expression analysis and quantitative real-time RT-PCR (qRT-PCR) analysis. We successfully identified seven promoters that specifically upregulate downstream genes under autotrophic conditions and three promoters that constitutively express downstream genes regardless of culture conditions.
2 Materials and methods
2.1 Bacterial strains and culture conditions
The bacterial strains used in this study are listed in Table 1. Cupriavidus necator and E. coli strains were routinely cultured in a Luria-Bertani (LB) medium (Kato et al., 2017) at 30°C and 37°C, respectively, with agitation at 120 rpm. When necessary, kanamycin (50 mg/L), chloramphenicol (34 mg/L), or ampicillin (50 mg/L) was added to the medium.
2.2 Transcriptome analysis
The cells of C. necator strain H16 pre-cultured in LB medium were harvested by centrifugation at 4,000 × g for 10 min at 25°C and washed twice with modified basal mineral (MB) medium (Kato et al., 1996) by repeating suspension and centrifugation. The washed cells were resuspended in the fresh MB medium to obtain an optical density at 600 nm (OD_600_) of 0.02. Incubations for transcriptome analysis were performed using a sealed glass bottle (124 mL capacity) filled with 40 mL of the cell suspension at 30°C with agitation at 180 rpm. For autotrophic condition, the gas phase was replaced with a mixture of H_2_:O_2_:CO_2_ (80:10:10 [v/v]) at approximately 1 atm (H_2_/CO_2_ culture). For heterotrophic conditions, the gas phase was replaced with a mixture of N_2_:O_2_:CO_2_ (80:10:10 [v/v]) at approximately 1 atm, and the medium was supplemented with 1/100 volume of filter-sterilized stock solutions of sodium acetate (2 M) or d-fructose (1 M) (acetate and fructose cultures, respectively). After 22 h of incubation (OD_600_ of approximately 0.15, 0.20, and 0.55 for the H_2_/CO_2_, acetate, and fructose cultures, respectively), the gas phase was replaced with the fresh gas mixture with the same composition, and an additional 1/100 volume of the substrate stock solutions was supplemented. The cells were then incubated for an additional 3 h under the same conditions before being subjected to transcriptome analysis. The transcriptome analysis was conducted with three biological replicates. Total RNA was isolated using ISOGEN II reagent (Nippon Gene, Tokyo, Japan) combined with a bead-beating method, as previously described (Kato et al., 2014). RNA purification using an RNeasy Mini kit (Qiagen, Hilden, Germany) with a DNase treatment and quantification by using the Qubit 2.0 fluorometer (Thermo Fisher Scientific, Waltham, MA, United States) were carried out as described previously (Xie et al., 2023). RNA samples were pre-treated as described previously (Huang et al., 2025) and sequenced by using DNBSEQ-G400 sequencer under DNBSEQ-G400RS High-throughput Sequencing Set at 2 × 200 bp model by Bioengineering Lab (Kanagawa, Japan). The raw reads were trimmed and cleaned by Trimmomatic v0.39 (phred33, ILLUMINACLIP: 2:30:10, LEADING:3, TRAILING:3, SLIDINGWINDOW:6:30 MINLEN:33, and other parameters by default) (Bolger et al., 2014) and then mapped to the genome of C. necator strain H16 (GCA_000009285.2) using BWA v0.7.17 (with mem algorithm, and other parameters by default) (Li and Durbin, 2009). Gene expression levels of 6,999 open reading frames (ORFs) were calculated as transcripts per million (TPM) using StringTie v2.2.1 (with -e and -G options, and other parameters by default) (Pertea et al., 2016).
2.3 A promoter evaluation system based on β-galactosidase activity measurements
The plasmids and primers used in this study are listed in Table 2 and Supplementary Table S1, respectively. The strategy for construction of the promoter evaluation vectors is illustrated in Supplementary Figure S1. The sequence of the rrnB terminator of E. coli (TrrnB) was PCR amplified with NsiI and XbaI recognition sequences at the 5′- and 3′-ends, respectively. The sequence of β-galactosidase gene originated from E. coli was amplified with XbaI-NdeI and AgeI recognition sequences at the 5′- and 3′-ends, respectively. The two PCR products were inserted at the NsiI-AgeI site of the broad host range vector pBBR1MCS-2 by In-Fusion cloning (In-Fusion HD Cloning Kit, TaKaRa Bio, Kusatsu, Japan). The initiation codon ATG of the β-galactosidase gene was constructed to overlap with the ATG of the introduced NdeI recognition sequence. The resultant vector was designated as pBBR-bgal. To evaluate the promoter activities, each candidate promoter sequence was introduced into the XbaI-NdeI site of the pBBR-bgal and the resultant vectors were designated as pBBR-xxxx as listed in Table 2. These vectors were introduced into the C. necator strain H16 by transconjugation using E. coli S17-1 as the donor (Simon et al., 1983), followed by selection of the transconjugants on Simmons Citrate Agar medium as previously described (Fukui and Doi, 1997; Mifune et al., 2010). The crude enzyme solutions were prepared from the C. necator strains cultured until the mid-exponential phases under autotrophic (the H_2_/CO_2_ culture) and heterotrophic (the fructose culture) conditions. Cell disruption for crude enzyme preparation was performed by beads-beating for 60 s at 2,500 rpm at 4°C using Multi-beads Shocker MB1448 (Yasui-Kikai, Osaka, Japan) with Lysing Matrix B (Funakoshi, Tokyo, Japan) in phosphate buffered saline. Protein quantification was conducted using Qubit Fluorometer (Invitrogen), according to the manufacturer’s instruction. The promoter activities were evaluated by measuring β-galactosidase activities in the crude enzyme solutions using β-Galactosidase Enzyme Assay System with Reporter Lysis Buffer (Promega, Madison, WI, United States), according to the manufacturers’ instruction. The assay was conducted with three biological replicates, and the Student’s t-test was used for the statistical analyses.
2.4 Genome modification
The genome-engineered C. necator strain DL_1A23 harboring a set of genes related to CO_2_ fixation were constructed as follows. Based on the RNA-Seq results, genomic loci with extremely low transcription levels under both autotrophic and heterotrophic conditions were identified, and the H16_A0404 locus was selected as the insertion site for the exogenous genes. The pK18A0404-m266 vector used to introduce the lox sequence, the target site for Cre recombination, at the H16_A0404 locus was constructed by incorporating lox71, the chloramphenicol resistance gene (cmr), lox m2/66 sequences, and the flanking regions of H16_A0404 into the pK18mobsacB vector (Supplementary Figure S2). The pK18A0404-m266 vector was transferred into the C. necator strain IP-015 by transconjugation from E. coli. A double-crossover homologous recombinant strain, named IP015DL, was obtained by selection based on resistance to chloramphenicol and sucrose. The Cre recombination vector pSK026-CreN was constructed by incorporating Cre recombinase gene (cre), lox m2/71, and lox66 sequences into the pK18mobsacB vector. The seven genes for an engineered CO_2_ fixation pathway (Supplementary Table S2) were cloned into the pSK026-CreN vector at the position between the two lox sites, and the resulting vector was named pSK026_Unit1A23 (Supplementary Figure S3). The seven genes were arranged in the order shown in Supplementary Table S2. The autotrophic-specific promoters PS01, PS07, and PS11 were inserted upstream of ccr_CA, mcl, and lcc-pccB, respectively, and the terminator TrrnB was inserted downstream of lcc-pccB. (Supplementary Figure S3). The pSK026_Unit1A23 vector was introduced into the C. necator strain IP015DL by transconjugation. The Cre recombinant strain harboring the seven exogenous genes and a kanamycin resistance gene (kmr) on its genome, named strain DL_1A23, was obtained by selecting colonies resistant to kanamycin and sensitive to chloramphenicol (Supplementary Figure S4).
2.5 Quantitative real-time RT-PCR (qRT-PCR)
C. necator strain DL_1A23 was streaked onto LB agar plates and incubated at 30°C for approximately 2 days, until single colonies appeared. Three independent colonies were picked and separately inoculated into 5 mL of NR medium (Fukui et al., 2014), then incubated at 30°C with agitation at 200 rpm. Cells were collected by centrifugation at an OD_600_ value of 0.5, washed three times with MB medium, and resuspended in 20 mL of MB medium supplemented with 200 nM vitamin B_12_ for autotrophic cultures. For the autotrophic condition, the gas phase was replaced with a H_2_:O_2_:CO_2_:N_2_ mixture (3:10:10:77 [v/v]) at approximately 1 atm, followed by incubation at 30°C with agitation at 200 rpm. The gas phase was replenished every 8 h with a gas mixture of identical composition. Cells used for RNA extraction were harvested at an OD_600_ of 0.5–0.6 during the logarithmic growth phase. Total RNA was extracted using the NucleoSpin^®^ RNA kit (Macherey-Nagel, Düren, Germany) according to the manufacturer’s instruction. The quality and concentration of the extracted RNA were assessed using a NanoDrop spectrophotometer (Thermo Fisher Scientific) and agarose gel electrophoresis with pre-staining. cDNA was synthesized from the total RNA using the ReverTra Ace^®^ qPCR RT Master Mix (TOYOBO, Osaka, Japan) following the manufacturer’s instruction. qRT-PCR was performed using the TB Green Premix Ex Taq™ II (Tli RNaseH Plus) (TaKaRa Bio) and the StepOnePlus qPCR system (Applied Biosystems, Waltham, MA, United States) under the following conditions: an initial denaturation step at 95°C for 30 s (Stage 1), followed by 40 cycles of denaturation at 95°C for 5 s and annealing/extension at 60°C for 30 s (Stage 2). After amplification, a melting curve analysis (Stage 3) was conducted, consisting of 95°C for 15 s, 60°C for 1 min, and a final step at 95°C for 15 s. The expression levels of three endogenous and three exogenous genes, each driven by one of the PS01, PS07, and PS11 promoters (Supplementary Table S5), were quantified with primers listed in Supplementary Table S1 and using the expression levels of a housekeeping gene (gyrB) as the internal control.
3 Results and discussion
3.1 Comparative transcriptome analysis of C. necator grown under autotrophic and heterotrophic conditions
A comprehensive gene expression analysis was conducted to identify genes specifically upregulated under autotrophic conditions and those constitutively expressed under both autotrophic and heterotrophic conditions. C. necator strain H16 was cultured under autotrophic (using H_2_/CO_2_ as growth substrates) and heterotrophic (using fructose or acetate as a growth substrate) conditions and subjected to RNA-seq analysis to quantify the expression levels of each ORF. The plots of the log2 fold change (L2FC) values between the normalized expression values in the H_2_/CO_2_ culture (TPM-H_2_) and those in the fructose or acetate cultures (TPM-Frc or TPM-Ace) exhibit positive correlations, particularly for ORFs upregulated in the H_2_/CO_2_ culture (Figure 1). There were 104 and 119 ORFs significantly upregulated in the H_2_/CO_2_ culture compared to the fructose and acetate cultures (L2FC > 2, p < 0.01, and TPM-H_2_ > 100), respectively, among which 91 ORFs were common.
Expression profiles of 6,999 ORFs in C. necator H16. The log2 fold change (L2FC) values between the normalized expression values in the H2/CO2 culture (TPM-H2) and those in the fructose or acetate cultures (TPM-Frc or TPM-Ace) are plotted. An approximation curve (y = 0.89x + 0.32, r = 0.68) derived from the least-square method is presented as a blue broken line.
Several studies have reported comparative transcriptomic and proteomic analyses of C. necator under autotrophic and heterotrophic growth conditions (Kohlmann et al., 2011; Serna-García et al., 2024). These studies have reported that genes associated with carbon fixation and H_2_ oxidation are significantly upregulated under autotrophic conditions. In the transcriptomic analysis conducted in this study, we observed pronounced upregulation of two gene clusters encoding the CBB cycle enzymes (cbb operons, H16_B1395–1383 [H_2_/Frc L2FC of 3.3–6.8] and PHG427–416 [H_2_/Frc L2FC of 3.7–6.5]), as well as two gene clusters encoding hydrogenases and associated proteins (PHG001–022 [H_2_/Frc L2FC of 1.1–5.1] and PHG088–093 [H_2_/Frc L2FC of 5.6–6.9]) in the H_2_/CO_2_ culture (Supplementary Table S3). Additionally, the ORF PHG023 (H_2_/Frc L2FC of 3.5), encoding a high-affinity permease of nickel ions, essential cofactors of hydrogenases, as well as ORFs responsible for their incorporation into the enzyme complexes (PHG094–096 [H_2_/Frc L2FC of 2.1–6.0]), were also found to be highly expressed in the H_2_/CO_2_ culture (Supplementary Table S3). Previous studies have shown that expression of genes involved in C1 metabolism and the respiratory electron transport chain is modulated under autotrophic conditions, likely reflecting shifts in cellular energy status (Kohlmann et al., 2011; Serna-García et al., 2024). With regard to C1 metabolism, our data revealed elevated expression of the gene cluster encoding formate dehydrogenase (H16_B1452–1455 [H_2_/Frc L2FC of 3.0–4.8]), along with the gene for specialized elongation factor required for incorporation of selenocysteine (H16_B0947 [H_2_/Frc L2FC of 5.1], Supplementary Table S3), an essential amino acid in formate dehydrogenase (Baron et al., 1993; Atkins and Gesteland, 2000). Furthermore, the gene cluster H16_B2185–2182, encoding an efflux transporter of copper ion, necessary for the function of respiratory chain proteins, was also highly expressed under H_2_/CO_2_ conditions (L2FC of 2.9–3.9, Supplementary Table S3). In addition to these characterized genes, several genes of unknown function were also upregulated in the H_2_/CO_2_ culture. The upstream regulatory regions of these genes represent promising candidates for the development of the autotroph-specific promoters.
On the other hand, ORFs in a cluster for fructose catabolism (a putative transporter and glycolysis enzymes) were significantly downregulated in the H_2_/CO_2_ culture compared to the fructose culture (H16_B1498–1503 [H_2_/Frc L2FC of −4.2 to −5.8]) (Supplementary Table S3). Similarly, the genes encoding acetyl-CoA synthetase, which is crucial for acetate catabolism, were exclusively expressed in the acetate culture (H16_A2525 [H_2_/ace L2FC of −2.6] and H16_B0834 [H_2_/ace L2FC of −2.4]) (Supplementary Table S3). These observations are consistent with previous reports (Denger et al., 2011; Kohlmann et al., 2011; Serna-García et al., 2024) and suggest the validity of the transcriptome analysis performed in this study.
3.2 Selection of candidate promoters
Based on the transcriptome analysis, genes specifically upregulated under autotrophic conditions and those constitutively expressed under both autotrophic and heterotrophic conditions were selected, and their promoter regions were identified. For genes specifically upregulated under autotrophic conditions, the top six genes with the highest H_2_/Frc L2FC values were selected from those with TPM-H_2_ > 100. Additionally, the top six genes (excluding the previously selected genes) with the highest TPM-H_2_ values were selected from those with H_2_/Frc L2FC > 3. In these processes, when the selected gene was part of a putative operon, the first gene in that operon was selected as the candidate gene. The upstream regions (regions without ORFs, located between the selected gene and the upstream gene) of the 12 genes (Figure 2A) were identified as candidates for autotrophic-specific promoters (PS01–PS12, the sequences are presented in Supplementary Table S4). It should be noted that C. necator H16 has two cbb operons containing genes for the CBB cycle, one on the chromosome and another on the megaplasmid, which have almost identical sequences. While both operons are specifically upregulated under autotrophic conditions, only the chromosomal cbb operon was targeted as the candidate promoter in this study (PS01). For genes constitutively expressed under both autotrophic and heterotrophic conditions, seven genes (Figure 2B) with various TPM-H_2_ values were selected from those with H_2_/Frc L2FC values of 0 ± 0.3. The promoter regions were identified using the same procedure as for the autotrophic-specific promoters, resulting in seven candidates for constitutive promoters (PC01–PC07, the sequences are presented in Supplementary Table S4).
The expression data for genes used to identify candidate promoters. (A) Genes associated with autotroph-specific promoter candidates (PS01–PS11), and (B) genes associated with constitutive promoter candidates (PC01–PC07). Transcriptomic profiling was performed using logarithmically growing cells cultured on acetate, fructose, or H2/CO2, and gene expression levels are presented as normalized transcript counts (transcripts per million, TPM). For candidate promoters located upstream of operons, only the expression level of the first gene in the operon is shown. The annotated function of each gene is as follows; H16_B1395 (PS01): ribulose bisphosphate carboxylase large chain (cbbL2), PHG088 (PS02): NAD-reducing hydrogenase diaphorase moiety large subunit (hoxF), H16_B1395 (PS03): selenocysteine-specific protein translation elongation factor (selB), H16_B1040 (PS04): probable extra-cytoplasmic solute receptor, PHG094 (PS05): hydrogenase nickel incorporation protein (hypA), H16_B2185 (PS06): formate dehydrogenase alpha subunit (fdoG), PHG001 (PS07): membrane-bound [NiFe] hydrogenase small subunit (hoxK), H16_B2185 (PS07): copper resistance protein A, multi-copper oxidase (copA), H16_B1650 (PS09) and PHG318 (PS10): hypothetical proteins, PHG023 (PS11): high-affinity nickel permease (hoxN1), H16_B0960 (PS12): predicted ATPase, nucleotide-binding protein Mrp, H16_A3402 (PC01): outer membrane protein (porin), H16_A2566 (PC02): acyl carrier protein (acpP), H16_A0482 (PC03): LSU ribosomal protein L13 (rplM), H16_A3144 (PC04): LysR-family transcriptional regulator (phcA), H16_A0566 (PC05): phosphoglycerate kinase (pgk), H16_A0204 (PC06): hypothetical protein, and H16_A0511 (PC07): organic solvent tolerance protein (ostA). Data are presented as the means of three independent cultures, and error bars represent standard deviations. The values in orange letters above each bar indicate the fold change in the TPM values of the H2/CO2 vs. fructose cultures.
3.3 Development of a promoter evaluation system based on β-galactosidase activity
Since promoter regions can influence translation efficiency in addition to transcriptional efficiency, discrepancies between mRNA and protein expression levels are commonly observed (Buccitelli and Selbach, 2020). Therefore, quantitative comparisons should be made at the protein (or enzymatic activity) levels to accurately evaluate promoters. The vector for promoter evaluation was constructed by introducing a promoterless β-galactosidase gene into the broad-host-range vector pBBR1MCS-2 (summarized in Supplementary Figure S1). To prevent read-through transcription potentially caused by the expression of upstream genes on the vector, the rrnB terminator sequence from E. coli (TrrnB) was introduced upstream of the β-galactosidase gene. The resulting vector pBBR-bgal was used as the promoterless negative control, and pBBR-Plac, which contains the E. coli lac promoter upstream of the β-galactosidase gene, was used as the positive control. The crude enzyme solutions were prepared from C. necator strains carrying these vectors and subjected to the β-galactosidase activity measurements (Figure 3A). Given the similarity in gene expression patterns between the fructose and acetate cultures (Figure 2; Supplementary Table S3), only the fructose culture was subsequently utilized as the heterotrophic condition. The crude enzyme solutions obtained from the strain harboring pBBR-Plac cultured under both autotrophic and heterotrophic conditions exhibited significant β-galactosidase activities (91–202 mU/µg-protein), while those from the strain carrying the control vector pBBR-bgal exhibited negligible levels of activities (<0.6 mU/µg-protein). These results demonstrated the validity of the promoter evaluation system constructed in this study.
Evaluation of promoter activities by the β-galactosidase assay. β-galactosidase activities were determined using crude enzyme solutions prepared from C. necator strains harboring the indicated vectors, cultured under heterotrophic (fructose culture, blue bars) and autotrophic (H2/CO2 culture, orange bars) conditions. Each graph represents the β-galactosidase activities obtained from (A) the negative control strain harboring pBBR-bgal (with a promoterless β-galactosidase) and the positive control strain harboring pBBR-Plac (with the E. coli lac promoter), (B) the strains harboring vectors with the autotrophic-specific promoters, and (C) the strains harboring vectors with the constitutive promoters. Data are presented as the means of three independent cultures, and error bars represent standard deviations. The values in orange letters above each bar indicate the ratio of β-galactosidase activities under autotrophic to heterotrophic conditions.
3.4 Evaluation of the candidate promoters by the β-galactosidase assay
The sequences of 19 candidate promoters (PS01–PS12 and PC01–PC07) were introduced into the promoter evaluation vector (Table 2), which were subsequently introduced into C. necator strain H16. Among these vectors, the pBBR-PC03 did not yield any transformants despite repeated trials and was therefore excluded from subsequent experiments. Although the reason for the inability to obtain the pBBR-PC03 transformant is not clear, it may be due to the toxicity resulting from high levels of β-galactosidase expression or the inhibition of normal colony formation caused by the energy consumption associated with the constitutive expression of the enzyme at high levels. The crude enzyme solutions were prepared from the transformants cultured under autotrophic or heterotrophic conditions, and their promoter activities were assessed by measuring the β-galactosidase activities. The PS04, PS05, PS10, PC01, PC04, and PC07 promoters were excluded from the candidates because the transformants carrying the vectors with the respective promoters exhibited only negligible levels of β-galactosidase activities (<1.1 mU/µg-protein) under all the culture conditions tested. In addition, two autotrophic-specific promoter candidates (PS08 and PS09) were also excluded because the transformants carrying pBBR-PS08 and -PS09 exhibited high β-galactosidase activities under heterotrophic conditions that were comparable to those under autotrophic conditions (data not shown). Although the underlying causes for these unexpected results remain elusive, potential explanations include transcriptional regulation by unidentified elements located outside the selected sequence region, such as regulatory sequences at distant sites, and alterations in translation efficiency resulting from changes in the higher-order structure of the mRNA (Saito et al., 2019).
Figure 3B presents the results of β-galactosidase assays for the seven transformants carrying the vectors with promoters confirmed to be autotrophic-specific. The transformant carrying the vector with the PS01 promoter, the upstream sequence of the chromosomal cbb operon, exhibited high β-galactosidase activity under the autotrophic condition (104.8 ± 5.9 mU/µg-protein), which was comparable to that observed with P_ lac _. Conversely, the enzyme activity was significantly lower when cultured under the heterotrophic condition (3.0 ± 1.2 mU/µg-protein), leading to 34.9-fold difference. These results demonstrated that the PS01 promoter can be used to specifically and strongly express target gene(s) under autotrophic conditions. Similarly, the transformants harboring pBBR-PS07 or pBBR-PS11 exhibited low β-galactosidase activities under the heterotrophic condition, while they showed moderate activity levels under the autotrophic condition (34.7 and 34.3 mU/µg-protein, respectively), corresponding to 34.7- and 57.2-fold upregulations, respectively. In addition, although the β-galactosidase activities of the transformants carrying pBBR-PS02, pBBR-PS03, pBBR-PS06, or pBBR-PS12 were not as high under the autotrophic condition (7.8–17.1 mU/µg-protein), they were significantly higher than those under the heterotrophic condition (4.5- to 44.0-fold differences). Figure 3C shows the results of β-galactosidase assays for the three transformants carrying vectors with constitutive promoters. The transformants carrying pBBR-PC02, pBBR-PC05, or pBBR-PC06 under the autotrophic condition exhibited similar activities to those under the heterotrophic conditions (0.8- to 1.6-fold differences), where the expression levels were distinct from each other (94.9, 2.8, or 23.6 mU/µg-protein under the autotrophic condition, respectively).
For certain promoter candidates, discrepancies were observed between transcriptomic data and β-galactosidase assay results. For example, transcriptome analysis revealed that genes downstream of the PS02 promoter were markedly upregulated under autotrophic conditions, with transcript levels exceeding a 100-fold increase compared to heterotrophic conditions (Figure 2A). In contrast, β-galactosidase activity exhibited only a moderate 4.5-fold increase between the two growth conditions. Such divergence between transcriptional and translational outputs is a well-documented phenomenon in heterologous protein expression and remains a significant challenge in the field (Buccitelli and Selbach, 2020; Pouresmaeil and Azizi-Dargahlou, 2023). Multiple factors have been implicated in reduced translational efficiency, including codon usage bias and the limited availability of specific tRNAs. Among these, the tertiary structure of mRNA is particularly influential and is likely to play a substantial role in the context of this study. Our group previously demonstrated that the tertiary structure formed by the 5′untranslated region (5′UTR), derived from the promoter, in conjunction with the RNA sequence of an exogenous gene, can impede translational efficiency (Saito et al., 2019). Moreover, we showed that modification of the exogenous gene sequence without altering the encoded amino acid can effectively disrupt inhibitory tertiary structures and significantly enhance translation (Saito et al., 2019). Further optimization of the promoters identified in this study, particularly within their 5′UTR regions, may represent a promising strategy for improving translational efficiency.
Collectively, this study successfully identified seven autotrophic-specific promoters and three constitutive promoters with distinct expression levels, which are expected to be new useful tools for development of C. necator strains suitable for CO_2_-based biomanufacturing. Although there have been some studies on the genetic engineering of C. necator to improve its function under autotrophic conditions, the promoters used in these studies were P_ lac _ and P_BAD_, which originated from E. coli (Thorbecke et al., 2021; Kim et al., 2022). The E. coli P_ lac _ has been reported to act as a strong constitutive promoter in C. necator (Fukui et al., 2011). However, high expression of genes required for biomanufacturing often give negative impact on the growth and viability of the host cells due to some metabolic burden or toxicity. Therefore, it has been reported that inducible gene expression system, functional during the bioproduction phases but not during the growth phases, can improve the efficiency of biomanufacturing (Raj et al., 2020; De Baets et al., 2024). Although the E. coli P_BAD_ promoter enables inducible gene expression in C. necator with the supplementation of arabinose (Fukui et al., 2011; Nangle et al., 2020), the addition of chemicals for induction is undesirable in practical biomanufacturing processes. Furthermore, fine-tuning the expression levels of multiple genes in metabolic pathways has been shown to be beneficial for efficient bioproduction (Jung et al., 2021; Ding and Liu, 2024). The promoter library developed in this study will be an effective tool to meet these demands, i.e., fine-tuning of gene expression without the need for specific external inducers, and is expected to accelerate CO_2_-based biomanufacturing and support the development of sustainable bioprocesses. Furthermore, based on the information obtained in this study, the promoter library will be further enriched through optimization of the promoter region and length, as well as improvements via promoter engineering (random mutagenesis, hybrid construction, etc.) (Johnson et al., 2018; Cazier and Blazeck, 2021).
3.5 Expression of exogenous genes introduced into the C. necator genome by the autotrophic-specific promoters
To evaluate the ability of the autotrophic-specific promoters identified in this study to regulate gene expression within a genomic context, we constructed a genome-engineered C. necator strain DL_1A23. Although this strain was constructed to enhance the CO_2_-fixing ability by introducing seven exogenous genes (Supplementary Table S2), the functions of each gene and the characteristics of the strain are beyond the scope of this study and therefore will be discussed elsewhere. The seven exogenous genes were integrated into C. necator chromosome 1 via Cre/Lox recombination (Supplementary Figure S4). In this strain, three autotrophic-specific promoters were employed: the promoter of the RuBisCO large subunit gene cbbL (PS01), that of the hydrogenase gene hoxK (PS07), and that of the permease gene hoxN (PS11). These promoters were inserted upstream of the exogenous genes, ccr-CA, mcl, and lcc-pccB, respectively. C. necator strain DL_1A23 was cultured under the autotrophic conditions, and the expression levels of the three exogenous genes, as well as the three endogenous genes downstream of respective original promoter regions, were evaluated by qRT-PCR (Figure 4). The expression levels of the three endogenous genes were comparable to that of the housekeeping gene gyrB (0.5 to 2.8-folds), following the trend cbbL > hoxN > hoxK, consistent with the results of the RNA-seq analysis (Figure 2A). The expression levels of the three exogenous genes were comparable to those of the endogenous genes sharing the same promoter regions (0.4 to 1.3-folds), demonstrating that the promoters identified in this study can function effectively within a genomic context. Although the differences were not significant, the downstream genes of the PS01 and PS07 promoters (cbbL and hoxN) tended to exhibit lower expression levels, while the downstream gene of the PS11 promoter (hoxK) tended to exhibit higher expression levels compared to the corresponding endogenous genes. While promoter activity should ideally remain unaffected by the identity of downstream genes, it is plausible that differences in promoter length and sequence range, as well as the genomic locus of exogenous gene integration, may have influenced transcriptional efficiency. In addition, it is frequently observed that the expression levels and patterns of genes are altered when exogenous genes are introduced via plasmids or integrated into the genome (Nakamura et al., 2025). Further evaluation and improvement of the promoters identified in this study may be necessary to fine-tune the expression of exogenous genes introduced into the genome.
The expression levels of exogenous and endogenous genes in the genome-engineered C. necator strain DL_1A23. The expression of three exogenous genes (gray bars) introduced into the C. necator genome and three endogenous genes (white bars) located downstream of the corresponding original promoter regions (PS01, PS07, and PS11) under autotrophic conditions was determined by qRT-PCR analysis. Expression levels are represented as log2 fold differences relative to the housekeeping gene gyrB. Data represent the means of three biological replicates, with error bars indicating standard deviations.
4 Conclusion
In this study, we established a novel promoter library for C. necator useful for biomanufacturing from CO_2_, which enables gene expression specific to autotrophic conditions. We identified seven autotrophic-specific promoters and three constitutive promoters with varying expression intensities, all functioning independently of specific external inducers, particularly when exogenous genes are introduced via plasmids. These promoters would serve as valuable tools for the practical application of C. necator in CO_2_-based biomanufacturing. Further research, such as promoter engineering, could enable more precise control of gene expression.
The reference list from the paper itself. Each links out to its DOI / PubMed record.
- 1Alagesan S.Hanko E. K. R.Malys N.Ehsaan M.Winzer K.Minton N. P. (2018). Functional genetic elements for controlling gene expression in Cupriavidus necator H 16. Appl. Environ. Microbiol. 84 (19), e 00878–18. 10.1128/AEM.00878-18 30030234 PMC 6146998 · doi ↗ · pubmed ↗
- 2Alalwan H. A.Alminshid A. H.Aljaafari H. A. S. (2019). Promising evolution of biofuel generations. Subject review. Renew. Energy Focus 28, 127–139. 10.1016/j.ref.2018.12.006 · doi ↗
- 3Arhar S.Rauter T.Stolterfoht-Stock H.Lambauer V.Kratzer R.Winkler M. (2024). CO 2-based production of phytase from highly stable expression plasmids in Cupriavidus necator H 16. Microb. Cell Fact. 23 (1), 9. 10.1186/s 12934-023-02280-2 38172920 PMC 10763379 · doi ↗ · pubmed ↗
- 4Atkins J. F.Gesteland R. F. (2000). The twenty-first amino acid. Nature 407 (6803), 463–464. 10.1038/35035189 11028985 · doi ↗ · pubmed ↗
- 5Bachleitner S.AtaÖ.Mattanovich D. (2023). The potential of CO 2-based production cycles in biotechnology to fight the climate crisis. Nat. Commun. 14 (1), 6978. 10.1038/s 41467-023-42790-6 37914683 PMC 10620168 · doi ↗ · pubmed ↗
- 6Baron C.Heider J.Böck A. (1993). Interaction of translation factor SELB with the formate dehydrogenase H selenopolypeptide m RNA. Proc. Natl. Acad. Sci. U. S. A. 90 (9), 4181–4185. 10.1073/pnas.90.9.4181 8483932 PMC 46470 · doi ↗ · pubmed ↗
- 7Bolger A. M.Lohse M.Usadel B. (2014). Trimmomatic: a flexible trimmer for illumina sequence data. Bioinformatics 30 (15), 2114–2120. 10.1093/bioinformatics/btu 170 24695404 PMC 4103590 · doi ↗ · pubmed ↗
- 8Buccitelli C.Selbach M. (2020). m RN As, proteins and the emerging principles of gene expression control. Nat. Rev. Genet. 21 (10), 630–644. 10.1038/s 41576-020-0258-4 32709985 · doi ↗ · pubmed ↗