Investigation of early-stage cardiovascular-kidney-metabolic syndrome on retinal structure and function evaluated by optical coherence tomography angiography
Yunyi Liang, Congbi Liang, Jianping Yang, Wanhua Li, Runyi Liang, Kun Li, Jingfeng Zhang, Peiqiong Lao, Junhua Zhu, Lin An, Zhaohao Liang, Chubin Ou

TL;DR
This study shows that early-stage cardiovascular-kidney-metabolic syndrome causes measurable changes in retinal structure and blood vessels, detectable using OCTA.
Contribution
The study identifies OCTA biomarkers for early-stage CKM syndrome, offering a non-invasive method for early detection.
Findings
Early-stage CKM subjects showed reduced retinal thickness and vessel density compared to healthy controls.
Outer temporal thickness and macular vessel density are independent predictors of early-stage CKM.
Specific conditions like hypertension and diabetes correlate with distinct regional retinal changes.
Abstract
The retina serves as a non-invasive window to visualize systemic health, with optical coherence tomography angiography (OCTA) enabling simultaneous assessment of retinal structural thickness and vascular density. Suboptimal cardiovascular-kidney-metabolic (CKM) health status, defined by the early stage of CKM syndrome, may impact retinal neurovascular integrity, yet comprehensive OCTA-based evaluations remain limited and controversial. This study aimed to investigate retinal structural and vascular alterations in the early-stage CKM using OCTA and explore its potential as a biomarker tool. A cross-sectional study included 2,153 participants undergoing OCTA during health checks (2023–2024). Early-stage CKM (stages 1–2) is characterized by abnormal levels of glucose, lipid profile, uric acid, or blood pressure. Retinal thickness and vessel density in nine ETDRS grid regions were…
Genes, proteins, chemicals, diseases, species, mutations and cell lines named across the full text — each resolved to its canonical identifier and authoritative record.
Click any figure to enlarge with its caption.
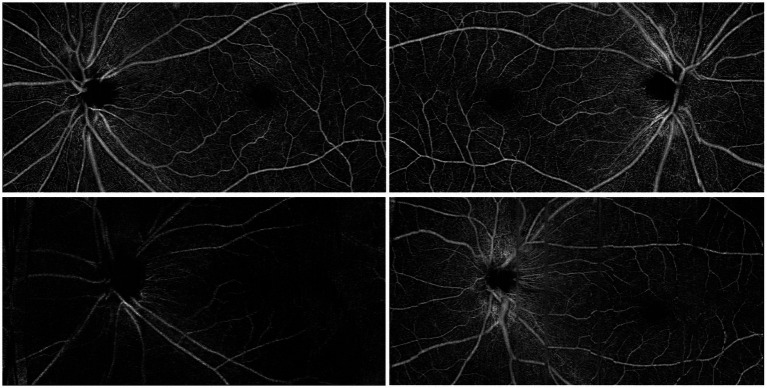 Figure 1
| Condition | Normal | Abnormal |
|---|---|---|
| Mean age | 54.0 ± 9.72 | 59.5 ± 7.49 |
| Female | 45 (42.4%) | 1,180 (64.0%) |
| Suboptimal health | 106 (5.5%) | 1843 (94.5%) |
| Abnormal LDL | 1,214 (62.3%) | 735 (37.7%) |
| Abnormal HDL | 1,498 (76.9%) | 451 (23.1%) |
| Abnormal triglyceride | 1,147 (58.9%) | 802 (41.1%) |
| Abnormal total cholesterol | 935 (48.0%) | 1,014 (52.0%) |
| Abnormal uric acid | 1760 (90.8%) | 180 (9.2%) |
| Diabetes | 1,495 (76.7%) | 454 (23.3%) |
| Hypertension | 1,054 (54.1%) | 895 (45.9%) |
| Variables | Health | Suboptimal CKM health | |
|---|---|---|---|
| Mean ± SD (95% CI) | Mean ± SD (95% CI) | ||
| Age | 54.0 ± 9.71 (52.70–55.29) | 59.9 ± 7.49 (59.31–59.80) | <0.001 |
| Gender (female) | 79.5% | 68.2% | <0.001 |
| Retinal thickness | |||
| SOM | 293 ± 15.1 (291.8–295.8) | 290 ± 16.8 (289.8–290.9) | 0.001 |
| NOM | 305 ± 14.9 (303.0–307.0) | 299 ± 18.9 (299.1–300.4) | <0.001 |
| IOM | 280 ± 14.2 (278.5–282.3) | 276 ± 15.7 (275.5–276.6) | <0.001 |
| TOM | 273 ± 15.3 (271.5–275.6) | 269 ± 17.9 (268.8–269.9) | <0.001 |
| SIM | 321 ± 15.6 (319.8–323.9) | 317 ± 19.6 (316.5–317.7) | <0.001 |
| NIM | 320 ± 18.0 (317.9–322.7) | 315 ± 22.5 (314.9–316.3) | 0.001 |
| IIM | 318 ± 15.0 (316.3–320.3) | 313 ± 19.1 (313.0–314.3) | 0.001 |
| TIM | 309 ± 16.7 (306.9–311.3) | 304 ± 21.0 (304.1–305.4) | 0.001 |
| CSF | 246 ± 18.6 (243.5–248.5) | 243 ± 25.9 (242.4–244.1) | 0.019 |
| Vessel density | |||
| SOM | 30.5 ± 12.2 (28.88–32.14) | 27.0 ± 11.5 (26.65–27.39) | <0.001 |
| NOM | 29.5 ± 14.1 (27.65–31.44) | 26.0 ± 13.4 (25.64–26.50) | <0.001 |
| IOM | 28.9 ± 11.7 (27.35–30.46) | 25.3 ± 11.4 (24.92–25.66) | <0.001 |
| TOM | 24.2 ± 12.3 (22.57–25.84) | 21.5 ± 11.5 (21.13–21.87) | 0.002 |
| SIM | 27.5 ± 13.8 (25.72–29.38) | 23.2 ± 12.9 (22.83–23.66) | <0.001 |
| NIM | 20.8 ± 14.0 (19.01–22.74) | 17.3 ± 12.9 (16.90–17.74) | <0.001 |
| IIM | 24.2 ± 13.5 (22.41–26.00) | 20.4 ± 12.8 (19.99–20.82) | <0.001 |
| TIM | 19.3 ± 13.2 (18.16–21.69) | 16.3 ± 11.9 (15.92–16.69) | <0.001 |
| CSF | 4.87 ± 7.21 (3.91–5.83) | 3.28 ± 4.55 (3.13–3.43) | <0.001 |
| Variables | Odds ratio (95% CI) | |
|---|---|---|
| TOM thickness | 0.986 (0.978–0.993) | <0.001 |
| SOM vessel density | 1.04 (1.006–1.075) | 0.020 |
| SIM vessel density | 0.962 (0.935–0.991) | 0.010 |
| Age | 1.076 (1.058–1.095) | <0.001 |
| Gender | 0.506 (0.358–0.714) | <0.001 |
| Variables | Normal LDL (1214) | Abnormal LDL (753) | |
|---|---|---|---|
| Mean±SD (95% CI) | Mean±SD (95% CI) | ||
| Retinal thickness | |||
| SOM | 290 ± 17.3 (289.8–291.2) | 290 ± 15.7 (289.8–291.4) | 0.899 |
| NOM | 300 ± 19.4 (299.4–300.9) | 299 ± 17.5 (298.9–300.7) | 0.307 |
| IOM | 276 ± 16.1 (275.7–277.0) | 276 ± 14.9 (275.4–277.0) | 0.624 |
| TOM | 270 ± 18.3 (263.3–270.7) | 268 ± 17.0 (268.1–269.8) | 0.175 |
| SIM | 317 ± 19.9 (316.5–318.0) | 317 ± 18.6 (316.6–318.5) | 0.638 |
| NIM | 315 ± 22.8 (314.7–316.5) | 316 ± 21.4 (315.2–317.4) | 0.502 |
| IIM | 313 ± 18.9 (313.2–314.7) | 313 ± 18.9 (313.9–314.8) | 0.777 |
| TIM | 305 ± 21.2 (304.2–305.8) | 304 ± 20.0 (303.9–306.0) | 0.512 |
| CSF | 243 ± 25.9 (242.5–244.6) | 243 ± 24.9 (241.9–244.5) | 0.774 |
| Vessel density | |||
| SOM | 27.1 ± 11.7 (26.67–27.60) | 27.3 ± 11.5 (26.76–27.93) | 0.640 |
| NOM | 26.3 ± 13.6 (25.83–26.91) | 26.0 ± 13.2 (25.41–26.77) | 0.503 |
| IOM | 25.5 ± 11.5 (25.05–25.96) | 25.4 ± 11.3 (24.88–26.05) | 0.878 |
| TOM | 21.7 ± 11.6 (21.29–22.22) | 21.4 ± 11.4 (20.89–22.07) | 0.497 |
| SIM | 23.4 ± 13.0 (22.94–23.97) | 23.5 ± 12.9 (22.86–24.19) | 0.922 |
| NIM | 17.5 ± 13.0 (17.05–18.08) | 17.4 ± 13.0 (16.78–18.12) | 0.833 |
| IIM | 20.7 ± 12.9 (20.19–21.21) | 20.4 ± 12.7 (19.82–21.12) | 0.630 |
| TIM | 16.5 ± 12.1 (16.09–17.05) | 16.4 ± 11.8 (15.79–17.01) | 0.925 |
| CSF | 3.42 ± 4.95 (3.23–3.62) | 3.28 ± 4.39 (3.05–3.50) | 0.811 |
| Variables | Normal HDL (1498) | Abnormal HDL (451) | |
|---|---|---|---|
| Mean±SD (95% CI) | Mean±SD (95% CI) | ||
| Retinal thickness | |||
| SOM | 290 ± 16.8 (290.3–291.5) | 289 ± 16.3 (288.4–290.5) | 0.025 |
| NOM | 300 ± 19.0 (299.5–300.9) | 299 ± 17.8 (298.4–300.7) | 0.484 |
| IOM | 276 ± 15.7 (275.9–277.1) | 275 ± 15.5 (274.7–276.7) | 0.156 |
| TOM | 269 ± 17.4 (269.0–270.3) | 269 ± 19.2 (268.3–270.9) | 0.917 |
| SIM | 317 ± 19.8 (316.9–318.3) | 316 ± 18.2 (315.3–317.7) | 0.073 |
| NIM | 316 ± 22.6 (315.4–317.0) | 314 ± 21.3 (313.2–315.9) | 0.082 |
| IIM | 314 ± 19.5 (313.3–314.7) | 313 ± 16.7 (312.3–314.5) | 0.386 |
| TIM | 305 ± 21.1 (304.4–305.9) | 304 ± 19.5 (303.0–305.5) | 0.250 |
| CSF | 243 ± 25.9 (242.7–244.5) | 242 ± 24.1 (241.1–244.3) | 0.432 |
| Vessel density | |||
| SOM | 27.4 ± 11.6 (27.04–27.87) | 26.4 ± 11.6 (25.66–27.18) | 0.023 |
| NOM | 26.4 ± 13.3 (25.96–26.92) | 25.6 ± 13.7 (24.77–26.57) | 0.115 |
| IOM | 25.6 ± 11.4 (25.25–26.07) | 24.9 ± 11.5 (24.17–25.67) | 0.074 |
| TOM | 21.9 ± 11.6 (21.54–22.37) | 20.6 ± 11.2 (19.92–21.39) | 0.004 |
| SIM | 23.6 ± 12.9 (23.19–24.12) | 22.9 ± 13.0 (22.06–23.76) | 0.124 |
| NIM | 17.6 ± 13.0 (17.20–18.13) | 17.0 ± 13.2 (16.17–17.89) | 0.093 |
| IIM | 20.8 ± 12.8 (20.39–21.30) | 19.8 ± 12.8 (19.01–20.69) | 0.028 |
| TIM | 16.7 ± 12.1 (16.32–17.18) | 15.6 ± 11.8 (14.92–16.46) | 0.020 |
| CSF | 3.39 ± 4.71 (3.22–3.56) | 3.29 ± 4.86 (2.97–3.60) | 0.052 |
| Variables | Normal triglyceride (1147) | Abnormal triglyceride (802) | |
|---|---|---|---|
| Mean±SD (95% CI) | Mean±SD (95% CI) | ||
| Retinal thickness | |||
| SOM | 291 ± 17.0 (290.0–291.4) | 290 ± 16.3 (289.5–291.1) | 0.747 |
| NOM | 300 ± 19.2 (299.4–301.0) | 300 ± 18.0 (298.9–300.7) | 0.784 |
| IOM | 276 ± 15.7 (275.8–277.1) | 276 ± 15.5 (275.3–276.8) | 0.808 |
| TOM | 270 ± 16.9 (269.3–270.6) | 269 ± 19.1 (268.2–270.1) | 0.655 |
| SIM | 317 ± 20.7 (316.4–318.1) | 317 ± 17.4 (316.7–318.4) | 0.056 |
| NIM | 315 ± 23.3 (315.5–316.4) | 316 ± 20.2 (315.4–317.4) | 0.022 |
| IIM | 313 ± 20.0 (312.8–314.4) | 314 ± 17.2 (313.4–315.1) | 0.025 |
| TIM | 305 ± 20.8 (304.2–305.9) | 304 ± 20.7 (303.8–305.9) | 0.155 |
| CSF | 243 ± 28.2 (242.4–244.8) | 243 ± 21.1 (242.1–244.2) | 0.483 |
| Vessel density | |||
| SOM | 26.9 ± 11.6 (26.47–27.42) | 27.6 ± 11.6 (27.03–28.17) | 0.067 |
| NOM | 25.9 ± 13.3 (25.37–26.47) | 26.7 ± 13.5 (26.09–27.42) | 0.067 |
| IOM | 25.2 ± 11.4 (24.76–25.70) | 25.8 ± 11.5 (25.29–26.42) | 0.082 |
| TOM | 21.5 ± 11.6 (21.06–22.01) | 21.8 ± 11.5 (21.26–22.38) | 0.451 |
| SIM | 23.1 ± 12.9 (22.65–23.71) | 23.9 ± 13.0 (23.28–24.55) | 0.079 |
| NIM | 17.0 ± 12.8 (16.53–17.58) | 18.2 ± 13.3 (17.53–18.84) | 0.015 |
| IIM | 20.2 ± 12.7 (19.68–20.72) | 21.2 ± 12.9 (20.58–21.84) | 0.015 |
| TIM | 16.3 ± 12.1 (15.82–16.80) | 16.8 ± 12.0 (16.20–17.37) | 0.123 |
| CSF | 3.28 ± 4.88 (3.09–3.48) | 3.49 ± 4.56 (3.27–3.71) | 0.012 |
| Variables | Normal total cholesterol (935) | Abnormal total cholesterol (1014) | |
|---|---|---|---|
| Mean±SD (95% CI) | Mean±SD (95% CI) | ||
| Retinal thickness | |||
| SOM | 290 ± 17.5 (288.2–290.8) | 291 ± 15.9 (290.4–298.8) | 0.207 |
| NOM | 300 ± 19.3 (299.2–300.8) | 300 ± 18.1 (299.5–300.6) | 0.395 |
| IOM | 276 ± 15.7 (275.5–276.9) | 276 ± 15.6 (275.7–277.1) | 0.851 |
| TOM | 269 ± 17.7 (269.0–270.6) | 269 ± 17.9 (268.7–270.2) | 0.726 |
| SIM | 317 ± 19.9 (316.0–317.8) | 317 ± 19.0 (316.9–318.6) | 0.362 |
| NIM | 315 ± 23.5 (313.9–316.0) | 317 ± 21.1 (315.7–317.6) | 0.126 |
| IIM | 313 ± 18.8 (312.9–314.6) | 314 ± 19.0 (313.2–314.9) | 0.901 |
| TIM | 304 ± 21.3 (303.8–305.7) | 305 ± 20.3 (304.3–306.1) | 0.978 |
| CSF | 243 ± 25.4 (242.1–244.4) | 243 ± 25.6 (242.5–244.7) | 0.626 |
| Vessel density | |||
| SOM | 27.0 ± 11.9 (26.47–27.54) | 27.4 ± 11.3 (26.91–27.91) | 0.268 |
| NOM | 26.1 ± 13.7 (25.55–26.79) | 26.3 ± 13.1 (25.78–26.93) | 0.620 |
| IOM | 25.3 ± 11.6 (24.77–25.82) | 25.6 ± 11.3 (25.18–26.16) | 0.284 |
| TOM | 21.6 ± 11.7 (21.11–22.16) | 21.6 ± 11.4 (21.17–22.17) | 0.749 |
| SIM | 23.4 ± 13.1 (22.84–24.02) | 23.5 ± 12.8 (22.97–24.09) | 0.707 |
| NIM | 17.4 ± 13.1 (16.81–18.00) | 17.6 ± 12.9 (17.06–18.19) | 0.414 |
| IIM | 20.6 ± 13.0 (20.01–21.18) | 20.6 ± 12.7 (20.08–21.19) | 0.745 |
| TIM | 16.5 ± 12.3 (16.03–17.14) | 16.4 ± 11.8 (15.92–16.95) | 0.884 |
| CSF | 3.50 ± 5.19 (3.27–3.73) | 3.24 ± 4.29 (3.06–3.43) | 0.846 |
| Variables | Normal uric acid (1760) | Abnormal uric acid (180) | |
|---|---|---|---|
| Mean±SD (95% CI) | Mean±SD (95% CI) | ||
| Retinal thickness | |||
| SOM | 290 ± 16.4 (290.2–291.3) | 288 ± 19.1 (286.5–290.4) | 0.034 |
| NOM | 300 ± 18.7 (299.5–300.7) | 299 ± 18.7 (297.3–301.1) | 0.414 |
| IOM | 276 ± 15.5 (275.9–276.9) | 274 ± 17.1 (273.2–276.7) | 0.031 |
| TOM | 269 ± 17.4 (269.1–270.2) | 269 ± 21.1 (266.9–271.3) | 0.488 |
| SIM | 317 ± 19.2 (316.9–318.2) | 316 ± 21.0 (313.7–318.0) | 0.753 |
| NIM | 316 ± 21.8 (315.2–316.6) | 315 ± 26.9 (312.3–317.8) | 0.620 |
| IIM | 314 ± 18.8 (313.3–314.5) | 313 ± 20.5 (311.4–315.6) | 0.623 |
| TIM | 305 ± 20.6 (304.4–305.7) | 304 ± 22.0 (302.2–306.7) | 0.434 |
| CSF | 243 ± 25.7 (242.5–244.2) | 243 ± 24.0 (241.2–246.2) | 0.174 |
| Vessel density | |||
| SOM | 27.1 ± 11.6 (26.81–27.58) | 27.4 ± 11.9 (26.18–28.62) | 0.644 |
| NOM | 26.2 ± 13.4 (25.80–26.68) | 26.4 ± 13.8 (25.05–27.88) | 0.756 |
| IOM | 25.4 ± 11.4 (25.08–25.83) | 25.8 ± 12.1 (24.57–27.05) | 0.573 |
| TOM | 21.5 ± 11.5 (21.20–21.96) | 22.3 ± 11.9 (21.11–23.56) | 0.239 |
| SIM | 23.4 ± 12.9 (22.96–23.81) | 24.4 ± 13.3 (23.04–25.76) | 0.137 |
| NIM | 17.4 ± 13.0 (17.00–17.86) | 18.4 ± 13.6 (17.01–19.81) | 0.281 |
| IIM | 20.5 ± 12.7 (20.10–20.94) | 21.5 ± 13.3 (20.14–22.88) | 0.209 |
| TIM | 16.4 ± 12.0 (16.02–16.81) | 17.3 ± 12.5 (16.09–18.65) | 0.211 |
| CSF | 3.32 ± 4.72 (3.16–3.47) | 3.85 ± 5.03 (3.34–4.37) | 0.032 |
| Variables | Normal (1054) | Hypertension (895) | |
|---|---|---|---|
| Mean±SD (95% CI) | Mean±SD (95% CI) | ||
| Retinal thickness | |||
| SOM | 292 ± 17.0 (291.5–292.9) | 288 ± 16.1 (287.8–289.4) | <0.001 |
| NOM | 302 ± 16.8 (301.3–302.8) | 297 ± 20.5 (296.7–298.6) | <0.001 |
| IOM | 277 ± 15.4 (276.7–278.0) | 275 ± 15.9 (274.4–275.8) | <0.001 |
| TOM | 270 ± 17.7 (269.6–271.1) | 268 ± 17.9 (267.9–269.6) | 0.005 |
| SIM | 318 ± 20.3 (317.8–319.6) | 315 ± 18.2 (314.9–316.6) | <0.001 |
| NIM | 316 ± 22.5 (315.9–317.8) | 314 ± 22.1 (313.6–315.7) | 0.001 |
| IIM | 314 ± 19.1 (313.9–315.5) | 313 ± 18.7 (312.1–313.8) | <0.001 |
| TIM | 306 ± 20.4 (305.0–306.7) | 304 ± 21.2 (303.0–304.9) | 0.009 |
| CSF | 244 ± 26.5 (242.9–245.1) | 242 ± 24.3 (241.6–243.9) | 0.091 |
| Vessel density | |||
| SOM | 27.8 ± 11.8 (27.35–28.35) | 26.4 ± 11.4 (25.92–26.98) | <0.001 |
| NOM | 26.7 ± 13.6 (26.12–27.27) | 25.7 ± 13.2 (25.13–26.36) | 0.038 |
| IOM | 25.8 ± 11.6 (25.36–26.35) | 25.0 ± 11.3 (24.52–25.58) | 0.042 |
| TOM | 22.0 ± 11.7 (21.51–22.50) | 21.2 ± 11.4 (20.70–21.77) | 0.056 |
| SIM | 24.1 ± 13.1 (23.58–24.69) | 22.0 ± 12.8 (22.11–23.30) | 0.001 |
| NIM | 17.9 ± 13.1 (17.34–18.46) | 17.0 ± 12.9 (16.46–17.66) | 0.054 |
| IIM | 20.9 ± 12.9 (20.41–21.51) | 20.2 ± 12.6 (19.62–20.80) | 0.099 |
| TIM | 16.9 ± 12.2 (16.42–17.46) | 15.9 ± 11.8 (15.44–16.54) | 0.017 |
| CSF | 3.51 ± 4.86 (3.30–3.72) | 3.25 ± 4.61 (2.99–3.41) | 0.012 |
| Variables | Normal glucose (575) | Prediabetes (920) | Diabetes (454) | |
|---|---|---|---|---|
| Mean ± SD (95% CI) | Mean ± SD (95% CI) | Mean ± SD (95% CI) | ||
| Retinal thickness | ||||
| SOM | 291 ± 16.4 (290.7–292.7) | 290 ± 15.8 (289.5–291.0) | 289 ± 18.8 (288.5–290.9) | 0.002 |
| NOM | 301 ± 17.6 (300.4–302.4) | 299 ± 18.6 (298.6–300.3) | 299 ± 20.3 (298.2–300.8) | 0.009 |
| IOM | 277 ± 14.7 (276.4–278.1) | 275 ± 15.4 (275.2–276.7) | 275 ± 17.3 (274.8–277.0) | 0.004 |
| TOM | 270 ± 15.6 (269.2–271.1) | 269 ± 17.3 (268.8–270.3) | 269 ± 21.3 (267.7–270.4) | 0.077 |
| SIM | 319 ± 18.3 (318.1–320.3) | 317 ± 19.3 (316.2–318.0) | 315 ± 20.7 (314.3–317.0) | <0.001 |
| NIM | 317 ± 20.3 (316.7–319.1) | 315 ± 22.3 (314.3–316.4) | 314 ± 24.5 (312.7–315.9) | <0.001 |
| IIM | 315 ± 17.5 (314.3–316.4) | 313 ± 19.2 (312.8–314.5) | 312 ± 20.1 (311.2–313.9) | <0.001 |
| TIM | 306 ± 18.9 (305.4–307.6) | 304 ± 21.6 (303.4–305.4) | 304 ± 21.1 (302.8–305.6) | <0.001 |
| CSF | 244 ± 23.5 (242.9–245.6) | 243 ± 25.2 (242.3–244.6) | 242 ± 28.4 (240.5–244.2) | 0.015 |
| Vessel density | ||||
| SOM | 28.8 ± 11.6 (28.16–29.51) | 27.4 ± 11.6 (26.87–27.93) | 24.8 ± 11.0 (24.10–25.53) | <0.001 |
| NOM | 27.8 ± 13.7 (27.08–28.67) | 26.3 ± 13.3 (25.75–26.96) | 24.0 ± 13.1 (23.22–24.92) | <0.001 |
| IOM | 26.9 ± 11.6 (26.24–27.59) | 25.5 ± 11.5 (25.00–26.04) | 23.6 ± 11.1 (22.92–24.36) | <0.001 |
| TOM | 23.0 ± 11.7 (22.38–23.74) | 21.6 ± 11.6 (21.12–22.18) | 19.8 ± 11.0 (19.18–20.60) | <0.001 |
| SIM | 25.2 ± 13.3 (24.44–25.98) | 23.5 ± 12.9 (22.93–24.11) | 21.2 ± 12.3 (20.44–22.04) | <0.001 |
| NIM | 18.9 ± 13.6 (18.15–19.73) | 17.5 ± 13.0 (16.97–18.16) | 15.6 ± 12.1 (1487–16.45) | <0.001 |
| IIM | 21.9 ± 13.2 (21.19–22.72) | 20.7 ± 12.7 (20.12–21.28) | 18.7 ± 12.3 (17.98–19.57) | <0.001 |
| TIM | 18.0 ± 12.5 (17.28–18.74) | 16.5 ± 12.0 (15.97–17.07) | 14.6 ± 11.1 (13.88–15.32) | <0.001 |
| CSF | 3.87 ± 5.34 (3.56–4.18) | 3.31 ± 4.69 (3.10–3.53) | 2.85 ± 3.37 (2.60–3.11) | <0.001 |
- —Science and Technology Innovation Program of Foshan
- —National Natural Science Foundation
- —Science and Technology Planning Project of Guangdong Province10.13039/501100012245
Peer Reviews
No public reviews on file for this paper yet. If you reviewed it on a platform where reviews are public (OpenReview, ICLR, NeurIPS, ICML), you can paste yours below so the community can read it here.
Videos
No videos yet. Explain this paper in a talk, walkthrough, or lecture? Add one.
Taxonomy
TopicsRetinal Imaging and Analysis · Retinal Diseases and Treatments · Retinal and Optic Conditions
Background
The retina presents a distinct, non-invasive, and in vivo means of visualizing the vasculature and neural tissues of the human body. It functions as a window into overall health. The retinal nerve fibers are an extension of the axons in the central nervous system (CNS), and the retinal ganglion cells (RGCs) exhibit the typical characteristics of CNS neurons (1). The retinal blood vessels not only reflect the features and regulatory mechanisms of blood vessels throughout the body but also act as indicators of general wellbeing (2).
In the last few decades, research provided evidence of RGC degeneration and damage to the retinal nerve fiber layer (RNFL) in Alzheimer’s disease (AD), a neurodegenerative disorder (3). Additionally, pathological changes were found in the retinal vasculature in cases of stroke (cerebral hemorrhage and infarction) (4). Insights from numerous current studies have also confirmed the correlation between retinal images and the risks of dementia and stroke, which are related to neural and vascular abnormalities, respectively (5, 6). These studies have laid the groundwork for using retinal images to evaluate and predict systemic diseases.
Optical coherence tomography (OCT) offers cross-sectional details of the retina and choroid, while OCT angiography (OCTA) visualizes the vasculature and structure within specific single layers. These technologies can serve as biomarkers for neuronal pathways because of their detailed imaging of RGCs, the RNFL, the inner plexiform layer (IPL), and other neural layer structures (7). Meanwhile, CFP and OCTA can be used for studying vascular pathways (8). Various artificial intelligence methods have been developed to facilitate the use of retinal imaging in the diagnosis and quantitative analysis of both retinal disease (9–12) and systemic diseases (13–16).
OCTA studies investigating superficial vascular density in the eyes of patients with diabetes but no signs of diabetic retinopathy have yielded mixed results. While some studies observed decreased superficial vascular density in diabetic patients without retinopathy (17, 18), others observed no change in density (19, 20). In contrast, investigations into deep vascular density in the eyes of patients with diabetes without signs of diabetic retinopathy, compared to healthy controls, have yielded more consistent findings. Notably, in the majority of studies, a reduction in deep vascular density was reported in diabetic patients without retinopathy (21, 22).
Research efforts exploring the influence of systemic hypertension on OCTA parameters have also yielded somewhat inconsistent findings. Although the majority of studies indicate notable decreases in the superficial vascular density among hypertensive patients (23, 24), some did not observe a significant decrease (25).
Consistent findings from multiple studies indicate that obese adults, even those without diabetes or hypertension, exhibit decreased vascular density of the deep retinal layer (26). Wang et al. studied the association between retinal thickness and fundus blood flow density in chest pain patients with dyslipidemia. They found that the dyslipidemia group had significantly lower superficial vascular density in the inferior and temporal retinal regions than the control group, indicating a potential connection between dyslipidemia and retinal microvascular changes (27).
In this study, unlike previous studies, we focused on investigating differences in retinal structure and function on OCTA between healthy subjects and those with early-stage cardiovascular-kidney-metabolic syndrome. Cardiovascular-kidney-metabolic (CKM) health, first proposed by the American Heart Association, encompasses the clinical manifestations resulting from the pathophysiological interactions among metabolic risk factors, such as obesity and diabetes, chronic kidney disease, and the cardiovascular system (28). A CKM health framework has been proposed to facilitate early detection of suboptimal CKM health to enable timely intervention and slow disease progression (29). In the current study, we focused on early-stage CKM syndrome subjects. Specifically, early-stage CKM syndrome was defined by the presence of prediabetes, diabetes, or hypertension and any signs of abnormal levels of key metabolic and cardiovascular blood indicators, including glucose, triglyceride, total cholesterol, HDL, LDL, and uric acid. We aimed to identify whether OCTA imaging biomarkers can be used as an evaluation tool for predicting early CKM syndrome.
Methods
Data collection
A total of 2,153 participants receiving health check-ups with retinal fundus OCTA imaging between 2023 and 2024 in the Sixth Hospital of South China University of Technology were enrolled. Individuals with a known history of cardiovascular disease were excluded. Gender, age, lipid profile, blood pressure, glucose level, and uric acid were measured for all participants. Retinal imaging was performed using a Velite-C3000 SD-OCTA scanner, which features a 120 kHz scanning speed, OMAG algorithm, and eye-tracking technology to minimize motion artifacts during scanning. Three-dimensional (3D) scans covering a 12 mm x 6 mm area were obtained for both eyes, centered at the middle point between the macula and optic disc to ensure that both structures were captured. To ensure the quality of the study, we excluded images of low quality due to motion artifacts or low contrast. Two typical scan images are shown in Figure 1, along with examples of excluded images due to low contrast and motion artifacts.
Top row: typical OCTA scan images. Bottom left: an excluded image due to low contrast; bottom right: an excluded image due to motion artifact.
We manually examined the retinal layer segmentation and corrected those obvious mistakes. The total thickness of the retina was then measured automatically by the vendor machine and reported according to the nine regions defined by the ETDRS grid, which are outer superior (SOM), inner superior (SIM), outer temporal (TOM), inner temporal (TIM), outer inferior (IOM), inner inferior (IIM), outer nasal (NOM), inner nasal (NIM), and center subfield (CSF). The vendor machine software features an automatic calculation of vessel density, which was based on a validated deep learning method described in a previous study (30). The area-averaged vessel density was also calculated according to the ETDRS zone.
Grouping criteria
The normal range of blood biomarkers is defined as follows: LDL: <3.7 mmol/L; HDL: >1.0 mmol/L (male) or >1.2 mmol/L (female); triglycerides: <2.3 mmol/L; total cholesterol: <5.2 mmol/L; and blood uric acid: 0.21 ~ 0.42 mmol/L (male), or 0.15 ~ 0.36 mmol/L (female). Any value falling outside the normal range was classified as abnormal. For glucose levels, we further divided participants into diabetes and prediabetes groups. Prediabetes was defined in individuals without diabetes who meet any of the following criteria: fasting glucose level between 6.1–7 mmol/L, post-prandial glucose level between 7.8–11.1 mmol/L, or HbA1c > 5.7%. Hypertension was defined as systolic blood pressure > 140 mmHg, diastolic pressure >90 mmHg, or a prior diagnosis of hypertension. According to the definition provided by the American Heart Association (28), individuals with dyslipidemia, dysuricemia, diabetes, prediabetes, or hypertension are considered to have suboptimal CKM health (CKM syndrome stages 1–2).
Statistical analysis
All variables were subjected to univariate comparisons between the low- and high-risk groups. For binary or categorical variables, either Fisher’s exact test or the chi-squared test was used. Continuous variables underwent normality assessment using the Shapiro–Wilk test, subsequent to which the Student’s t-test was applied for variables with normal distribution and the Mann–Whitney U-test for those in non-normal distribution. Only variables that were statistically significant and independent were included in the multivariate logistic regression. A multivariate logistic regression analysis was performed with a backward stepwise method after adjusting for confounding factors such as age and gender. Variable collinearity was assessed using Pearson’s correlation test. Multiple comparisons were corrected using the Bonferroni correction method. A p-value of less than 0.05 was deemed to indicate statistical significance. The aforementioned analyses were conducted utilizing SPSS software (IBM Corporation, United States).
Results
Demographic and baseline characteristics
Of the 2,153 subjects enrolled, 204 were excluded due to low image quality or missing data; as a result, a total of 1,949 participants were eventually included in the final analysis, with 1,843 (94.5%) classified as early-stage CKM syndrome based on abnormal blood biomarkers (glucose, lipid profile, uric acid, blood pressure, or diabetes status) and 106 (5.5%) as healthy controls. The mean age of the cohort was 59.2 ± 7.74 years, with women comprising 68.7%. The prevalence of abnormal biomarkers included total cholesterol (52.0%), triglycerides (41.1%), LDL (37.7%), hypertension (45.9%), diabetes (23.3%), HDL (23.1%), and uric acid (9.2%), as shown in Table 1.
Univariate analysis: control vs. early-stage CKM groups
Early-stage CKM subjects exhibited significantly thinner retinal thickness in all nine ETDRS grid regions compared to healthy controls (all p < 0.05), with the most pronounced reductions in the temporal outer macula region (TOM, 269 ± 17.9 vs. 273 ± 15.3, p < 0.001) and superior inner macula (SIM, 317 ± 19.6 vs. 321 ± 15.6, p < 0.001), as shown in Table 2. Vascular density was also significantly lower in the early-stage CKM group across all regions, particularly within the superficial capillary plexus: superior outer macula (SOM, 27.0 ± 11.5 vs. 30.5 ± 12.2, p < 0.001) and nasal inner macula (NIM, 17.3 ± 12.9 vs. 20.8 ± 14.0, p < 0.001).
Multivariate logistic regression
After adjusting for confounding factors, thinner TOM thickness (OR = 0.986, 95% CI: 0.978–0.993, p < 0.001), lower SOM vascular density (OR = 1.04, 95% CI: 1.006–1.075, p = 0.020), lower SIM vascular density (OR = 0.962, 95% CI: 0.935–0.991, p = 0.010), older age (OR = 1.076, 95% CI: 1.058–1.095, p < 0.001), and female gender (OR = 0.506, 95% CI: 0.358–0.714, p < 0.001) were independently associated with suboptimal CKM health status, as shown in Table 3.
Subgroup analyses by abnormal biomarkers
We further performed a subgroup analysis based on different abnormal biomarkers or suboptimal CKM health status. The subgroup analysis involved separate two-group comparisons, where the total subjects were divided into healthy and abnormal groups according to specific blood biomarker levels.
For LDL and total cholesterol, no significant retinal thickness or vascular density differences were observed between normal and abnormal groups, while triglyceride abnormalities were associated with increased NIM and IIM vascular density (p < 0.05), and low HDL was associated with thinner SOM thickness (p = 0.025) and reduced vascular density in TOM, inferior inner macula (IIM), and TIM (p < 0.05), as shown in Tables 4–7.
Elevated uric acid was correlated with thinner superior outer macula (SOM) and inferior outer macula (IOM) thickness (p < 0.05) and higher central subfield (CSF) vascular density (p = 0.032), a finding inconsistent with other biomarkers, as shown in Table 8.
Table 9 reveals that hypertensive subjects showed reduced retinal thickness in all regions (p < 0.05) and lower vascular density in SOM, the nasal outer macula (NOM), and the temporal inner macula (TIM) (p < 0.05).
As for prediabetes and diabetes, both groups exhibited progressive decreases in retinal thickness and vascular density compared with the normal group, with the most severe reductions in diabetes (e.g., SOM vascular density: 24.8 ± 11.0 in diabetes vs. 28.8 ± 11.6 in normal, p < 0.001), as shown in Table 10.
Discussion
This study demonstrates that early-stage CKM syndrome is associated with widespread retinal structural and vascular changes. To our knowledge, this is the first study that examines the relationship between CKM syndrome and retinal structure and function. The most consistent findings were reduced retinal thickness and vascular density across multiple macular regions, particularly in the superior and temporal regions. These findings align with prior research linking systemic health to retinal microvascular dysfunction (1, 2). Given that aging is associated with vessel density reduction (31) and thickness reduction (32) and that men tend to exhibit lower vessel density (33). We further performed a multivariate analysis to adjust for confounding factors such as age and gender. The multivariate analysis highlighted the outer temporal region thickness and the outer and inner superior vascular density as potential independent biomarkers, even after adjusting for age and gender, suggesting that OCTA can detect early retinal changes even in asymptomatic individuals.
Research on superficial vascular density in diabetes patients without signs of diabetic retinopathy has produced mixed results, with some studies reporting decreased vascular density (9, 34), while others found no significant changes (10, 35). Studies on deep vascular density showed more consistent results of decreased vascular density. In our study, we observed significantly reduced retinal thickness and vessel density across almost all ETDRS regions. Furthermore, we observed a gradient change from normal to prediabetes to diabetes, highlighting the dose-dependent impact of glycemic dysregulation on retinal structure and function.
Research on the effect of systemic hypertension on OCTA parameters has led to somewhat conflicting results. Although the majority of studies have reported a significant reduction in hypertensive patients (23, 24) in both superficial and deep vascular density, some reported non-significant change (25). In our study, we observed a similar trend that almost all ETDRS regions showed a significant reduction in thickness and vascular density.
Retinal structure and function changes vary according to the lipid profile. Low HDL, a marker of impaired lipid metabolism, was associated with focal retinal thinning (outer superior) and vascular loss (outer superior, outer temporal, inner temporal, and inner inferior), potentially reflecting endothelial injury caused by dyslipidemia, which is consistent with Wang’s study (27), who also reported significantly reduced superficial vascular density in the inferior and temporal regions of patients in the dyslipidemia group. In our study, we further categorized dyslipidemia into four subgroups and found that abnormal HDL and triglyceride groups showed more significant changes in thickness and vessel density, while abnormal LDL and total cholesterol groups showed no significant change. Further studies are needed to elucidate the different effects of lipid substances on retinal function.
Yang et al. found that high uric acid level was associated with lower vessel density in men (36). However, in our study, we observed somewhat contradictory results, with vessel density showing an increasing trend in the dysuricemia group, although most quadrants were not statistically significant. This unexpected increase in vascular density with dysuricemia may indicate compensatory vasodilation, though further research is needed to clarify this relationship.
In our study, after adjusting for age and gender, the only significant changes in retinal thickness and vascular density were observed in the temporal and superior regions. A study by Lin et al. revealed that the temporal and superior regions are more vulnerable in patients with type 2 diabetes (37). Similar findings were also reported in the literature for the severity of diabetic retinopathy, where total thickness in the temporal and superior regions showed the most prominent change related to DR severity (38). A histologic study conducted by Kern et al., in an animal model of diabetes mellitus (DM), found that vascular disorders were more common in the superior temporal retina compared to the inferior nasal retina (39). One possible explanation for this phenomenon is that the temporal side of the retina usually has the lowest vessel density among the four quadrants because it lies furthest away from the optic disc region and thus is more susceptible to ischemia or hypoxia.
Retinal alterations in early-stage CKM likely result from systemic processes such as inflammation, oxidative stress, and endothelial dysfunction, which affect both neural and vascular tissues. The retina, as an extension of the central nervous system, is highly susceptible to metabolic stress, making OCTA’s ability to visualize both structural (thickness) and functional (vascular density) changes critical for early detection of systemic health decline. Therefore, OCTA-derived biomarkers may serve as non-invasive tools to assess suboptimal CKM health, particularly in populations at risk for diabetes or hypertension. The identification of retinal regions, such as outer nasal and outer superior, as key sites of change could guide targeted screening strategies. However, longitudinal studies are needed to validate these markers for predicting future cardiovascular or metabolic events.
Limitations
This cross-sectional study cannot establish causality, and the single-center sample may limit generalizability. Additionally, the definition of early-stage CKM included multiple biomarkers, making it difficult to isolate individual effects. Only the total retina thickness and full retinal plexus vessel density were analyzed in the current study, while layer-specific thickness and plexus-specific vessel density were not analyzed. Future research should use longitudinal designs and mechanistic analyses to dissect the interplay between specific systemic abnormalities and retinal pathology.
Conclusion
Early-stage CKM syndrome is associated with detectable retinal structural and vascular changes via OCTA, particularly in the macular region. These findings support OCTA as a promising tool for evaluating systemic health status, with potential for early intervention in the early stages of metabolic and cardiovascular disease.
The reference list from the paper itself. Each links out to its DOI / PubMed record.
- 1London A Benhar I Schwartz M. The retina as a window to the brain-from eye research to CNS disorders. Nat Rev Neurol. (2013) 9:44–53. doi: 10.1038/nrneurol.2012.227, PMID: 23165340 · doi ↗ · pubmed ↗
- 2Wu JH Liu TYA. Application of deep learning to retinal-image-based Oculomics for evaluation of systemic health: a review. J Clin Med. (2022) 12:152. doi: 10.3390/jcm 12010152, PMID: 36614953 PMC 9821402 · doi ↗ · pubmed ↗
- 3Cheung CY Mok V Foster PJ Trucco E Chen C Wong TY. Retinal imaging in Alzheimer's disease. J Neurol Neurosurg Psychiatry. (2021) 92:983–94. doi: 10.1136/jnnp-2020-325347, PMID: 34108266 · doi ↗ · pubmed ↗
- 4Wu HQ Wu H Shi LL Yu LY Wang LY Chen YL. The association between retinal vasculature changes and stroke: a literature review and meta-analysis. Int J Ophthalmol. (2017) 10:109–14. doi: 10.18240/ijo.2017.01.18, PMID: 28149786 PMC 5225358 · doi ↗ · pubmed ↗
- 5Chan VT Tso TH Tang F Tham C Mok V Chen C. Using retinal imaging to study dementia. J Vis Exp. (2017) 6:56137. doi: 10.3791/56137 PMC 575532529155753 · doi ↗ · pubmed ↗
- 6Girach Z Sarian A Maldonado-García C Ravikumar N Sergouniotis PI Rothwell PM. Retinal imaging for the assessment of stroke risk: a systematic review. J Neurol. (2024) 271:2285–97. doi: 10.1007/s 00415-023-12171-6, PMID: 38430271 PMC 11055692 · doi ↗ · pubmed ↗
- 7Grzybowski A Barboni P eds. OCT and imaging in central nervous system diseases. Cham (Switzerland): Springer (2020).
- 8Arnould L Meriaudeau F Guenancia C Germanese C Delcourt C Kawasaki R. Using artificial intelligence to analyse the retinal vascular network: the future of cardiovascular risk assessment based on Oculomics? A narrative review. Ophthalmol Ther. (2023) 12:657–74. doi: 10.1007/s 40123-022-00641-5, PMID: 36562928 PMC 10011267 · doi ↗ · pubmed ↗