dandelionR: Single-cell immune repertoire trajectory analysis in R
Jiawei Yu, Xiaohan Xu, Nicholas Borcherding, Zewen Kelvin Tuong

TL;DR
dandelionR is an R package that enables the analysis of immune cell development using single-cell RNA and receptor sequencing data.
Contribution
dandelionR provides an R-based implementation of the VDJ-feature space method for trajectory analysis.
Findings
dandelionR integrates scRNA-seq and scVDJ-seq data using diffusion maps and absorbing Markov chains.
The package offers a new option for R users to analyze immune repertoire trajectories.
It replicates the workflow of the Python-based Dandelion package in R.
Abstract
Integration of single-cell RNA-sequencing (scRNA-seq) and adaptive immune receptor (AIR) sequencing (scVDJ-seq) is extremely powerful in studying lymphocyte development. A python-based package, Dandelion, introduced the VDJ-feature space method, which addresses the challenge of integrating single-cell AIR data with gene expression data and enhances trajectory analysis results. However, no R-based equivalent or similar methods currently exist. To fill this gap, we present dandelionR, an R implementation of Dandelion’s trajectory analysis workflow, bringing the VDJ feature space construction and trajectory analysis using diffusion maps and absorbing Markov chains to R, offering a new option for scRNA-seq and scVDJ-seq analysis to R users.
Genes, proteins, chemicals, diseases, species, mutations and cell lines named across the full text — each resolved to its canonical identifier and authoritative record.
Click any figure to enlarge with its caption.
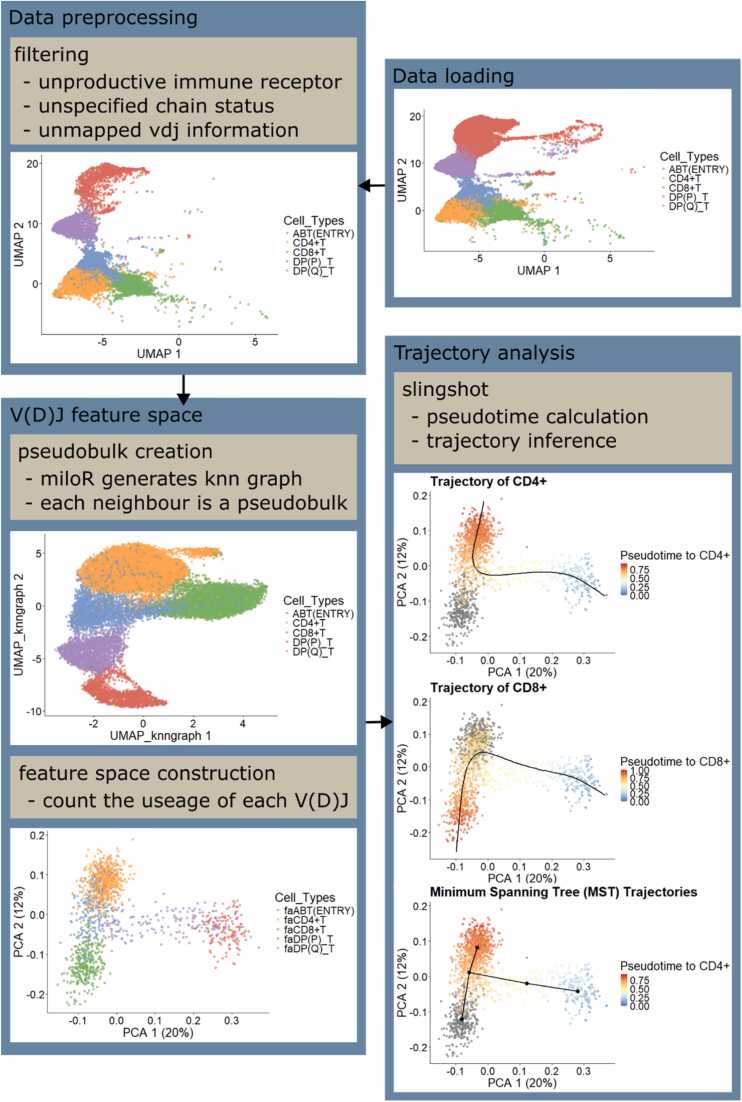 Figure 1
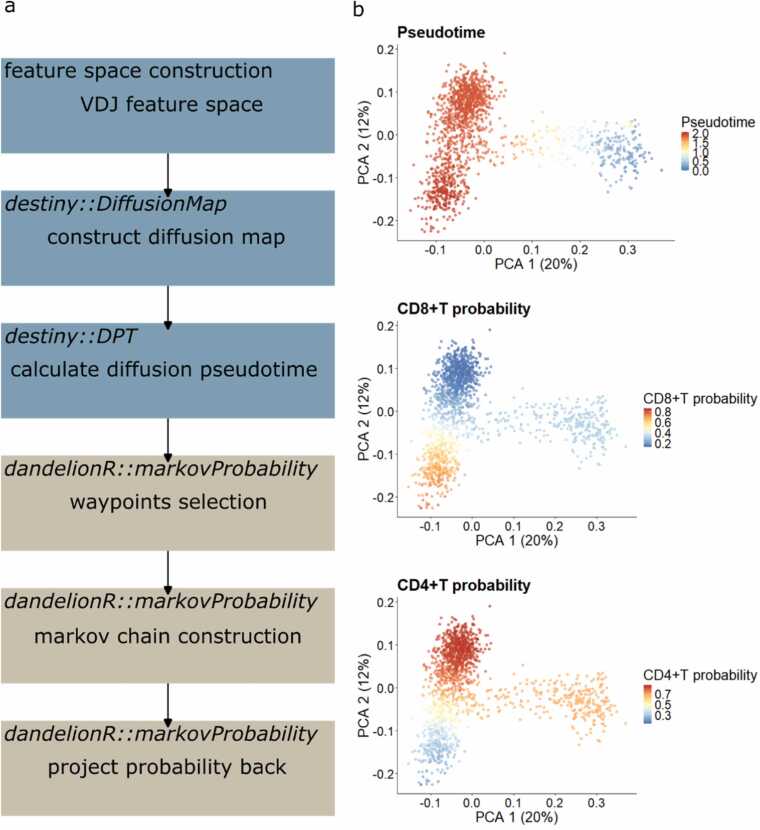 Figure 2
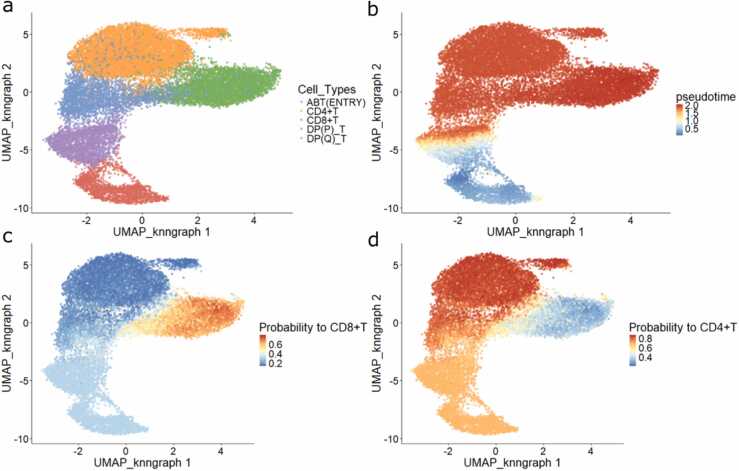 Figure 3
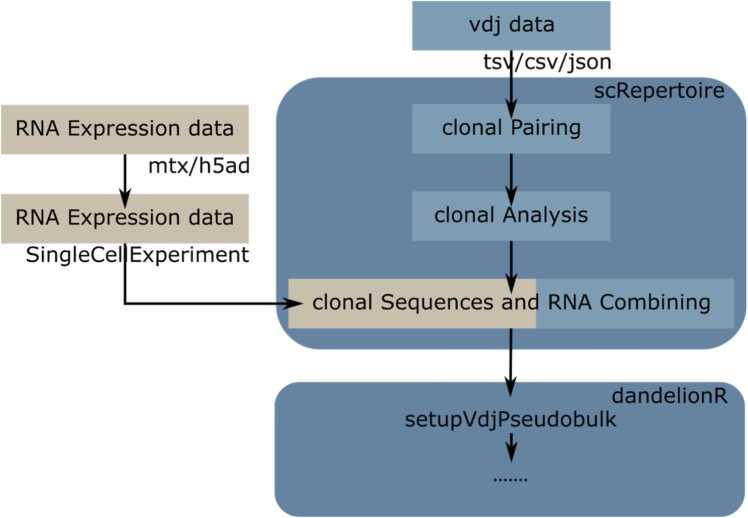 Figure 4
Peer Reviews
No public reviews on file for this paper yet. If you reviewed it on a platform where reviews are public (OpenReview, ICLR, NeurIPS, ICML), you can paste yours below so the community can read it here.
Videos
No videos yet. Explain this paper in a talk, walkthrough, or lecture? Add one.
Taxonomy
TopicsSingle-cell and spatial transcriptomics · Gene Regulatory Network Analysis · Immune Cell Function and Interaction
Introduction
1
During the development of T and B cells, variable (V), diversity (D) and joining (J) genes of adaptive immune receptors (AIRs) recombine stochastically, introducing variability in the joining region [8], [27]. This process, known as V(D)J recombination, plays a critical role in generating diversity of the AIR repertoire (AIRR) [6]. The diversity of AIRR is essential to adaptive immunity [18], but remains challenging for single-cell RNA sequencing (scRNA-seq) analysis [12]. This challenge necessitates the integration of scRNA-seq with AIR sequencing (scVDJ-seq) [13].
Scirpy[23], Dandelion[25], [20], and scRepertoire[29], [4] are widely used tools for conducting scVDJ-seq analysis. Among these, Dandelion's Python-based innovative strategy of creating a VDJ feature space addressed some challenges in integrating AIR data within scRNA-seq, arising from the mixture of categorical and continuous data characteristics inherent to AIRR data. The feature space was leveraged to enable trajectory analysis informed by both the gene expression and VDJ data, which improved the prediction accuracy of trajectories from double-positive T cells to CD4/CD8 T cells, demonstrating significant potential for future applications [25]. This improvement is particularly notable because most existing trajectory analysis tools rely solely on gene expression matrices. While this strategy is effective in many contexts, they may fall short in modelling lymphocyte development, where VDJ recombination critically determines the receptor-antigen affinity, which in turn influences the development direction and the final cell fate. Integrating VDJ features with transcriptomics profiles enables trajectory analysis tools to account for both gene expression and VDJ usage, offering a more comprehensive view of lymphocyte differentiation. However, no comparable integration method currently exists in R, limiting R users’ ability to perform such comprehensive analyses of lymphocyte trajectories.
Here, we introduce dandelionR, an R-based scVDJ-seq trajectory analysis tool replicating the trajectory analysis workflow of Dandelion. dandelionR enables the construction of the VDJ feature space to perform trajectory analysis using diffusion maps and absorbing Markov chains, with seamless interaction with scRepertoire. The current version is available on GitHub and through Bioconductor, along with user documentation and additional resources. This tool addresses existing gaps in functionality among current tools, offering researchers a more convenient solution for analysing immune repertoires and single-cell sequencing data in R. By doing so, it facilitates a deeper exploration of lymphocyte development and its functional mechanisms.
Methods
2
For trajectory analysis, Dandelion requires cell pseudobulks, typically with Milo [7], to construct the pseudobulked VDJ feature space. The feature space is then used as the input for Palantir [19], a trajectory analysis tool which employs diffusion maps and absorbing Markov chains to infer trajectory. Palantir produces pseudotime values and probabilities of each pseudobulk, which Dandelion subsequently projects back to each cell.
dandelionR is developed and tested in R v4.4.1 and is available through Bioconductor (from release 3.21) and can interact with scRepertoire v2.2.1 onwards. As an R implementation of Dandelion, it aims to reproduce the preprocessing, feature-space-building and result-projecting functions of the original software.
The typical workflow of dandelionR proceeds as follows:
Input
2.1
dandelionR uses a SingleCellExperiment object already combined with vdj data, such as from reading with scRepertoire [29], [4], or processed using the python package Dandelion with AnnData and converted to SingleCellExperiment.
Preprocessing
2.2
This step includes filtering cells with non-productive immune receptors and ambiguous VDJ chain status, e.g., orphan/incomplete or multiple TCRs in one cell, retaining only cells with relevant or complete VDJ data. Then, the remaining VDJ contigs that express the highest UMI counts in a cell are extracted for downstream analyses. Depending on the data source, some preprocessing steps may not be necessary and can be skipped or modified. For example, when using scRepertoire-derived data, the user should set ‘already.productive = TRUE’ to skip the productive filtering process, as the filtering has already been handled as part of the scRepertoire’s standard workflow. Additionally, there are many parameters that users can adjust according to their analysis requirements. For example, they can set ‘allowed_chain_status = NULL’ to skip checking whether a cell has relevant TCR chains and accept all contigs. This flexibility allows for a highly customizable preprocessing workflow as per user requirements. A default set of parameters has been defined based on the original Dandelion workflow to replicate the initial findings [25].
Pseudobulking and feature space constructing
2.3
Pseudobulking can be achieved through the miloR (v2.0.0) package [7]. Within each pseudobulk, dandelionR will tabulate the usage of each VDJ gene to create the VDJ feature space.
Trajectory analysis
2.4
Using the constructed VDJ feature space as input, we can utilise trajectory analysis tools to obtain pseudotime values and branching probabilities of each pseudobulk.
Projection
2.5
The calculated pseudotime values and probabilities of each pseudobulk are then projected back onto individual cells, generating the final trajectory analysis results.
Data
2.6
To evaluate the reproducibility of dandelionR, we converted the same data from Dandelion’s tutorial, into SingleCellExperiment format. The original data, derived from [25], represents a real-world single-cell-level map of immune systems development, and contains gene expression data with VDJ information. To analyse this dataset, Dandelion filtered out cells lacking TCR sequencing or belonging to the CD137 or MAIT-sorted populations. To illustrate the developmental trajectory of T cells, Dandelion further subsetted the dataset to retain only five cell types: DP(P), the double positive T cell undergoing active proliferation, DP(Q), the double positive T cell with limited proliferation and active VDJ recombination, ABT/ENTRY, the immature αβ T cell, CD4 +T, CD4 single positive T cell, and CD8 +T, CD8 single positive T cell.
Results
3
Replication of workflow before trajectory inference
3.1
To replicate the Dandelion workflow before trajectory analysis (Fig. 1), we implemented the following functions:Fig. 1. Overall workflow from preprocessing to trajectory analysis using dandelionR.Fig. 1
The dandelionR::setupVdjPseudobulk function preprocessed the single-cell VDJ data by Suo et al. [24]. It then filtered out cells with non-productive or unclearly mapped alpha-beta TCR chains, extracting the main productive chain and storing it in a new column within the colData slot of the SingleCellExperiment object. Out of 65102 cells in the data, 17308 cells were retained after filtering due to having complete TCR information necessary for downstream analyses.
Using MiloR [7], we constructed a k-nearest neighbour graph from the preprocessed data, treating each neighbour as a pseudobulk. This step allocated cells to pseudobulks based on the similarity of their gene expression profiles. Subsequently, the dandelionR::miloUmap function utilised the graph’s adjacency matrix to generate a UMAP (Uniform Manifold Approximation and Projection). The dandelionR::vdjPseudobulk function then created a VDJ feature space by counting the usage of each gene in each pseudobulk. With 160 V/D/J genes and 1516 pseudobulks, the VDJ feature space captured features from both gene expression and VDJ information in a continuous data format.
Implementing trajectory inference based on absorbing Markov chains
3.2
The Dandelion workflow originally used the constructed feature space as an input for Palantir, a trajectory analysis tool, treating each pseudobulk as a cell and VDJ usage as gene expression information. Palantir employs probabilistic methods [19], which are primarily implemented in Python-based tools [9]. However, most R-based tools do not incorporate such methods. Instead, TSCAN [15], [14] utilises a self-developed travelling salesman problem (TSP) algorithm, Slingshot [22] combines both minimum spanning tree with a self-modified principal curve, and destiny [1] applies a diffusion map. While Ouija [5] is a probabilistic method utilising a Bayesian latent variable model, it is unsuitable for our dataset. This is because Ouija is limited to data with a linear topology, whereas we are certain that our dataset exhibits a bifurcation between CD4 + and CD8 + cells.
Since there are no direct Palantir equivalent or similar methods in R, we first attempted to use Slingshot [22] for downstream analysis, following the comparison framework provided by dynverse [17]. However, Slingshot does not provide outputs analogous to branching probabilities (see Supplementary Information 1). To address this limitation, we sought to implement Palantir’s trajectory analysis function in R. We anticipate that this approach could not only address the lack of branching probability in our workflow but also help fill a critical gap in the R community, where probabilistic methods for trajectory analysis remain scarce.
In the original Dandelion workflow, Palantir first identifies waypoints after preprocessing and then uses a diffusion map to compute diffusion pseudotime on each cell [19]. These waypoints are subsequently employed to construct an absorbing Markov chain, which calculates transition probabilities. Finally, pseudotime and branch probabilities derived from the waypoints are projected onto individual cells.
We utilised the destiny package to calculate the diffusion map and pseudotime. Subsequent processes—including waypoint selection, absorbing Markov chain construction, probability calculation, and projection—were implemented independently and consolidated into a function called dandelionR::markovProbability (Fig. 2).Fig. 2. Trajectory analysis with Markov chain in dandelionR. (a) dandelionR’s trajectory analysis workflow that incorporates outputs from diffusion maps generated by destiny. (b) Pseudotime and branching probabilities of each pseudobulk after trajectory analysis.Fig. 2
Finally, the probabilities and pseudotime of each pseudobulk computed by VDJ feature space were projected back to individual cells through the dandelionR::projectPseudotimeToCell function (Fig. 3). A total of 39 cells were removed due to not belonging to any neighbourhoods.Fig. 3. Projection of pseudobulked trajectory results to single cells. (a) Single-cell UMAP plot coloured by cell types. (b, c, d) UMAP coloured by pseudotime, branching probabilities to CD8 +T and CD4 +T of individual cells.Fig. 3
Benchmarking
3.3
To evaluate the computational performance of dandelionR, we compared the total runtime time and the peak memory usage of the tutorial workflows in both dandelionR and Dandelion. The results are summarised in Supplementary Information.
To assess the agreement between dandelionR and the original Dandelion, we calculated several statistical metrics: the Pearson correlation coefficient, the Lin's Concordance Correlation Coefficient (CCC), the Kendall rank correlation coefficient, and the mean absolute error (MAE). In addition, we generated Bland-Altman plots to visualise the difference between outputs of the two implementations.
Benchmark 1: dandelionR (R) versus Dandelion (Python)
3.3.1
We first compared the outputs of the overall workflow. The dandelionR output includes 17,281 cells, while the original Dandelion output contains 17,234 cells, with 17,208 shared between the two. This discrepancy may stem from differences in random seed handling between R and Python, particularly during neighbour selection in the miloR step. For each intersecting cell, we compared both pseudotime and CD4 + branching probability between dandelionR and Dandelion (Fig. S1). As the dataset only has two terminal fates, the sum of CD4 +T probability and CD8 + probability from each cell equals one. Therefore, we report only the results of CD4 + probability.
The Pearson correlation coefficients are high for both pseudotime and CD4 + probability, indicating strong linear relationship between the two implementations. However, Lin's CCC for CD4 + probability (0.850) falls below the commonly accepted threshold of 0.9, suggesting room for improvement in agreement. Similarly, the Kendall rank correlation for pseudotime (0.684) indicates only moderate consistency in rank ordering. Moreover, the MAE values reflect a degree of bias between the outputs. We next explored which steps in the workflow contributed to these differences.
Benchmark 2: using Palantir’s diffusion map and pseudotime in both workflows
3.3.2
The absorbing Markov chain in dandelionR was implemented via self-developed functions, which allows flexible modification to improve the agreement between workflows. Moreover, as it and the projection step constitute the final stage of the pipeline, its performance can be assessed in isolation. These factors motivated us to examine the effect of this step first.
To evaluate the agreement of the absorbing Markov chain step, we used dandelionR to construct the VDJ feature space (Fig. S2). The resulting data were converted to AnnData format to serve as input for Palantir. The eigenvectors and eigenvalues of Palantir’s diffusion map were saved and transferred back to R to reconstruct the DiffusionMap object by destiny package. Additionally, the pseudobulk-level pseudotime computed by Palantir was also transferred back to R. The reconstructed DiffusionMap object and the pseudotime were used as the inputs of absorbing Markov chain of dandelionR. The resulting outputs were compared with those from Palantir, with both workflows using the same input feature space. Since both dandelionR and Dandelion use the same pseudobulk-level pseudotime, the possible discrepancy in final pseudotime could only originate from the projection step after absorbing Markov chain. With all three correlation coefficients equal to 1.000 and a negligible MAE (2.137 ×10⁻⁸), we confirmed that no difference arose in the projection step.
The remaining discrepancy observed in CD4 + probability therefore should have stemmed from differences in the absorbing Markov chain implementation itself. By using an identical diffusion map representation and pseudotime as input, we observed the improved agreement in all metrics except for MAE. Notably, the Kenall increased from 0.790 to 0.925, suggesting that ranking consistency of the branching probability is highly sensitive to differences in the diffusion map and pseudotime. Lin’s CCC also increased, but still remained below 0.9, indicating room for further improvement.
Benchmark 3: modifications in absorbing Markov chain implementation
3.3.3
After examining the exact procedures in Palantir’s and dandelionR’s absorbing Markov chain implementations, we hypothesized that the primary source of discrepancy lies in the K-nearest neighborhood (KNN) graph construction step within the Markov chain building process.
Palantir constructs the KNN graph using scikit-learn’s NearestNeighbors function, which applies K-dimensional (KD)-tree methods when the dataset is small. In contrast, dandelionR uses the makeKNNGraph function from the bluster package in Bioconductor, which relies on brute-force approach for small datasets.
To test this hypothesis, we substituted bluster with RANN, an R package which also employs KD-tree for KNN graph construction (Fig. S3). We observed substantial improvements in Pearson correlation, Lin’s CCC, and MAE for CD4 + probability. While the Kendall rank correlation is slightly lower than that in Benchmark 2 (0.925–0.895), it still indicates a high degree of ranking agreement and is considered acceptable.
Based on the improved benchmarking performance, we have elected to switch to RANN (from bluster) to be the default method for KNN construction in dandelionR’s function for calculating branch probabilities.
Benchmark 4: compatibility of diffusion map representations
3.3.4
Finally, we examined the agreement between destiny and Palantir in the diffusion map and pseudotime calculation step. Using dandelionR, we first constructed the VDJ feature space. This time, however, we used the eigenvectors and eigenvalues produced by destiny as the input to Palantir (Fig. S4).
Nevertheless, the pseudotime produced by Palantir under this setting is problematic. For example, DP(Q) cells are assigned the highest pseudotime value, which contradicts the expected developmental progression. As a result, all metrics are poor. This result indicates that the diffusion map representation produced by destiny is not compatible with Palantir’s framework.
However, the CD4 + fate probabilities, although less consistent to previous benchmarks, still retain a biological meaningful pattern and show relatively high Pearson correlation (0.959). This suggests that the absorbing Markov chain is somewhat robust to suboptimal pseudotime inputs, and that the destiny diffusion map still captures relevant biological structure in the feature space.
Integration with scRepertoire workflow
3.4
scRepertoire integrates VDJ information with gene expression, storing it in the colData of a SingleCellExperiment object. The VDJ usage we need lies in the column ‘CTgene’, where V, D, J genes are separated by periods and TRA and TRB chains are separated by an underscore. For instance, the entry ‘TRAV23.TRAJ21.TRAC_TRBV5–1.NA.TRBJ2–1.TRBC2’ indicates that the TRA chain has V gene TRAV23 and J gene TRAJ21, while TRB chain contains V gene TRBV5–1, unclear D gene, and J gene TRBJ2–1. If any of the chains is absent, it is represented as ‘NA’, such as ‘TRAV13–2.TRAJ23.TRAC_NA’, where the TRB chain is absent.
However, the calculation of VDJ feature space treats each V, D, and J gene separately. To address this, we developed an internal function that extracts the VDJ information from the ‘CTgene’ column generated by scRepertoire, splitting the V, D and J genes and storing them in individual columns. This function was incorporated in dandelionR::setupVdjPseudobulk to ensure compatibility with scRepertoire. Additionally, we introduced parameters to allow users to skip the additional filtering, as it is already performed within scRepertoire. To prevent errors from splitting the V, D, J genes correctly, users should first ensure that cells with multiple contigs have already been filtered by setting ‘filterMulti = TRUE’ during scRepertoire::combineTCR step.
Overall, the implementations above allowed dandelionR to function as a downstream tool for scRepertoire (Fig. 4), enabling further trajectory analysis after the combination of VDJ information with gene expression data.Fig. 4dandelionR’s integration with scRepertoire’s workflow. Users would perform preprocessing of the scVDJ-seq data as per standard scRepertoire workflow and this can then serve as input for dandelionR.Fig. 4
Discussion
4
We have successfully reproduced Dandelion’s trajectory analysis workflow, and incorporated it to scRepertoire’s workflow. These steps enable dandelionR to function as an R-based trajectory analysis tool that utilised both gene expression data and VDJ information combined by scRepertoire. The consistency between the outputs of dandelionR and the original Dandelion was evaluated through four benchmarking analyses. These comparisons include assessments of pseudotime and branching probability using multiple statistical metrics.
dandelionR implements part of Palantir’s trajectory analysis functions based on absorbing Markov chain. Originally, absorbing Markov chain, with the ability to define terminal states from the markov chain in an unsupervised step, allows the Palantir package to handle data with multifurcation topology. We have implemented the ability to define terminal states as well. However, the package we used to perform diffusion map, destiny, is only suitable for a dataset with a bifurcation or linear topology, which limits the versatility of dandelionR’s trajectory inference function on more complex developmental structures.
To overcome this limitation, users may choose to substitute the default trajectory inference step with other R-based tools such as Slingshot, which supports tree-like structures, although Slingshot does not produce branching probability (as discussed in Supplementary Information 1). Pseudotime values derived from such tools at the pseudobulk level can be projected back to single-cell resolution using the dandelionR::projectPseudotimeToCell function.
Moreover, dandelionR has not yet been applied to B cell development data, which involves more complex processes than T cell development. For instance, after V(D)J recombination, if an immature B cell is self-active, it may re-upregulate RAG to undergo additional rearrangements, a process known as receptor editing [11], [16], [26]. This forms a cyclic trajectory, which cannot be represented by absorbing Markov chains, as these inherently model unidirectional progression toward absorbing (terminal) states.
Adapting trajectory inference methods to account for cyclic developmental processes is non-trivial, requiring both algorithmic changes and appropriate datasets. Furthermore, the performance and assumptions of absorbing Markov chains in B cell development merit further investigation. In our search for suitable B cell datasets with paired BCR sequencing, we considered several published datasets. However, many did not meet key criteria: (1) derived from bone marrow, the site of B cell maturation; (2) sufficient cell numbers to capture intermediate developmental states; (3) availability of BCR sequencing to construct V(D)J feature space. For example, the Dong et al. dataset [10] could not be accessed due to restricted data access conditions and errors with the provided alternative accession number. The dataset from Tonglin et al., [28], although it includes healthy controls, only contained 972 healthy B cells, which is likely insufficient even for miloR neighbourhood construction. Two other papers e.g. Bandyopadhyay et al., [3] and Baccin et al., [2] contain suitable cell types and annotations but lack BCR sequencing. Finally, the paper from Strati and colleagues [21] focuses on immunotherapy of large B-cell lymphoma, making it less ideal for modeling normal development.
We also highlight the fundamental discrepancies in diffusion map construction and KNN graph construction between R and Python packages generally, which hinder our ability to fully implement the original Dandelion and Palantir workflow for TCR trajectory inference. In particular, for KNN graph construction, adopting a KD-tree-based approach yields results more consistent with the original Dandelion implementation. However, it remains unclear whether brute-force or KD-tree methods more accurately capture the underlying biological structure. Despite this ambiguity, our benchmarking demonstrates that the approaches are highly concordant in terms of global correlation, although subtle differences in cell trajectory ranking may persist. Based on the aforementioned limitations, future directions will focus on replacing destiny with alternative methods for conducting diffusion maps, which may improve interoperability and better capture underlying biological structures in the single-cell data.
Overall, while we have now developed a comparable TCR trajectory inference workflow compatible with R environments, available as a package through Bioconductor, we still recommend that users compare results against multiple trajectory inference tools, and where possible, across programming languages/environments, to assess the robustness of the inferred trajectories with respect to biological interpretation. Future work will explore implementing additional functionalities from the original Dandelion Python package e.g. filtering and network generation, as well as any future new functionalities, where possible.
Author contributions
ZKT conceived the project. JY, NB and ZKT wrote the code. JY, and XX performed data analysis. JY and ZKT wrote and edited the manuscript. ZKT supervised the work.
CRediT authorship contribution statement
Nicholas Borcherding: Writing – review & editing, Software. Zewen Kelvin Tuong: Writing – review & editing, Supervision, Software, Methodology, Conceptualization. Jiawei Yu: Writing – review & editing, Writing – original draft, Visualization, Software, Methodology, Investigation, Formal analysis, Data curation. Xiaohan Xu: Writing – review & editing, Data curation.
Declaration of Competing Interest
The authors declare the following financial interests/personal relationships which may be considered as potential competing interests: N.B. was previously employed by Santa Ana Bio, Inc and Omniscope, Inc. The remaining authors have no conflicts of interest to declare.
The reference list from the paper itself. Each links out to its DOI / PubMed record.
- 1Angerer P.Haghverdi L.Büttner M.Theis F.J.Marr C.Buettner F.destiny: diffusion maps for large-scale single-cell data in R Bioinforma (Oxf Engl)32820161241124310.1093/bioinformatics/btv 71526668002 · doi ↗ · pubmed ↗
- 2Baccin C.Al-Sabah J.Velten L.Helbling P.M.Grünschläger F.Hernández-Malmierca P.Nombela-Arrieta C.Steinmetz L.M.Trumpp A.Haas S.Combined single-cell and spatial transcriptomics reveal the molecular, cellular and spatial bone marrow niche organization Nat Cell Biol 221202038483187132110.1038/s 41556-019-0439-6PMC 7610809 · doi ↗ · pubmed ↗
- 3Bandyopadhyay S.Duffy M.P.Ahn K.J.Sussman J.H.Pang M.Smith D.Duncan G.Zhang I.Huang J.Lin Y.Xiong B.Imtiaz T.Chen C.-H.Thadi A.Chen C.Xu J.Reichart M.Martinez Z.Diorio C.…Tan K.Mapping the cellular biogeography of human bone marrow niches using single-cell transcriptomics and proteomic imaging Cell 18712202431203140.e 293871419710.1016/j.cell.2024.04.013PMC 11162340 · doi ↗ · pubmed ↗
- 4Borcherding N.Bormann N.L.Kraus G.sc Repertoire: an R-based toolkit for single-cell immune receptor analysis F 1000 Research 92020473278900610.12688/f 1000 research.22139.1PMC 7400693 · doi ↗ · pubmed ↗
- 5Campbell K.R.Yau C.A descriptive marker gene approach to single-cell pseudotime inference Bioinforma (Oxf Engl)3512019283510.1093/bioinformatics/bty 498PMC 629806029939207 · doi ↗ · pubmed ↗
- 6Carmona L.M.Schatz D.G.New insights into the evolutionary origins of the recombination-activating gene proteins and V(D)J recombination FEBS J 284112017159016052797373310.1111/febs.13990 PMC 5459667 · doi ↗ · pubmed ↗
- 7Dann E.Henderson N.C.Teichmann S.A.Morgan M.D.Marioni J.C.Differential abundance testing on single-cell data using k-nearest neighbor graphs Nat Biotechnol 40220222452533459404310.1038/s 41587-021-01033-z PMC 7617075 · doi ↗ · pubmed ↗
- 8Davis M.M.Bjorkman P.J.T-cell antigen receptor genes and T-cell recognition Nature 33461811988395402304322610.1038/334395 a 0 · doi ↗ · pubmed ↗