Intrinsic nutrients and defensive compounds drive coarse woody debris decay in five dominant subtropical tree species, China
Xiaoyu Wang, Tingsi Xie, Hui Chen, Shangbin Bai, Nan Wang

TL;DR
This study shows how different tree species in subtropical forests decompose at different rates, influenced by nutrients and chemical defenses in their wood.
Contribution
The study identifies how intrinsic wood traits, like nutrients and defensive compounds, drive decomposition rates in subtropical CWD.
Findings
Broadleaved species decomposed fastest, while conifers decomposed slowest.
Phosphorus was rapidly released in the first year, while nitrogen accumulated over time.
Defensive compounds like tannins had a weak effect on early-stage decay.
Abstract
Coarse woody debris (CWD) is crucial for carbon and nutrient cycling in forest ecosystems, with decomposition rates influenced by species-specific wood traits. This five-year study in a subtropical Chinese forest evaluated the CWD decomposition of five dominant species. Results showed that broadleaved species decomposed fastest (k = 0.230 years−1), followed by moso bamboo (0.168 years−1), and conifers slowest (0.022 years−1). Fast-decaying species were characterized by high hemicellulose, cellulose, and phosphorus (P) content, with rapid P release within the first decay year and nitrogen (N) accumulation over time. Tannin initially inhibited decay in fast-decaying species, but defensive compounds (tannins and phenolics) showed no sustained effect on decomposition rates. These findings indicate active CWD decomposition in subtropical forests, where P limitation outweighs N for…
Genes, proteins, chemicals, diseases, species, mutations and cell lines named across the full text — each resolved to its canonical identifier and authoritative record.
Click any figure to enlarge with its caption.
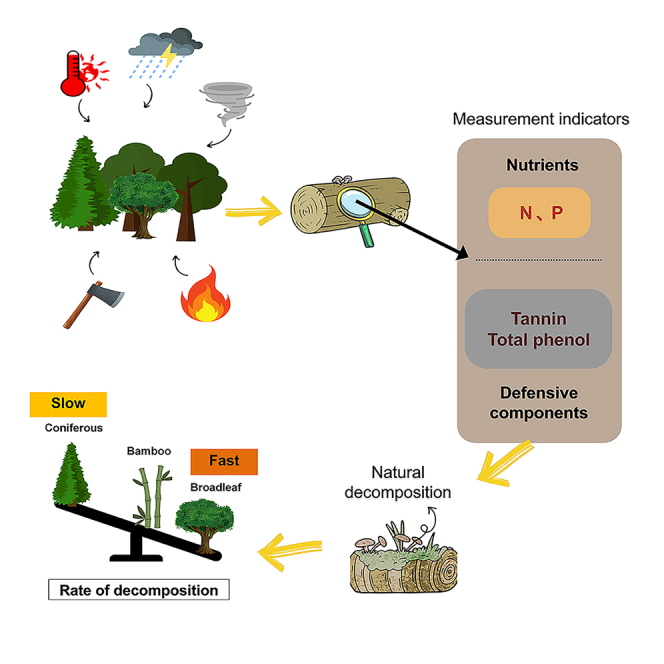 Figure 1
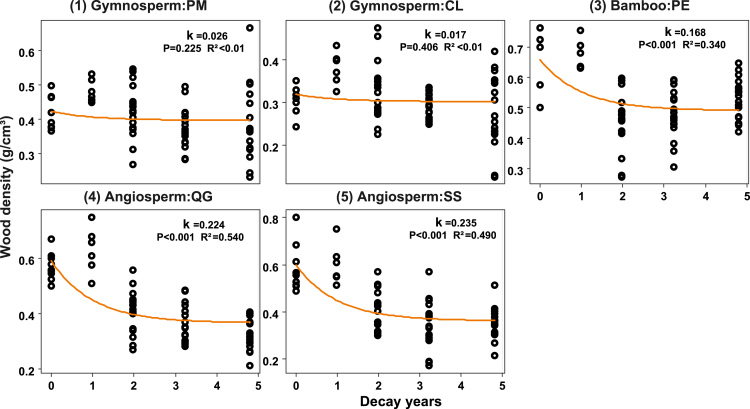 Figure 2
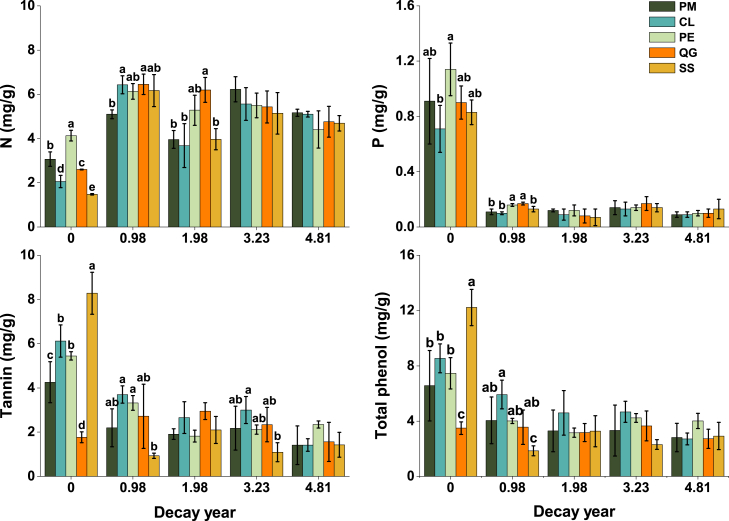 Figure 3
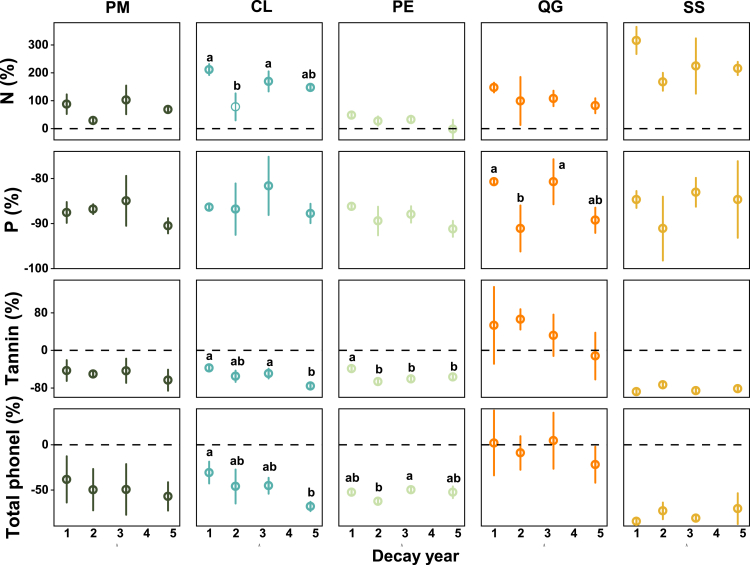 Figure 4
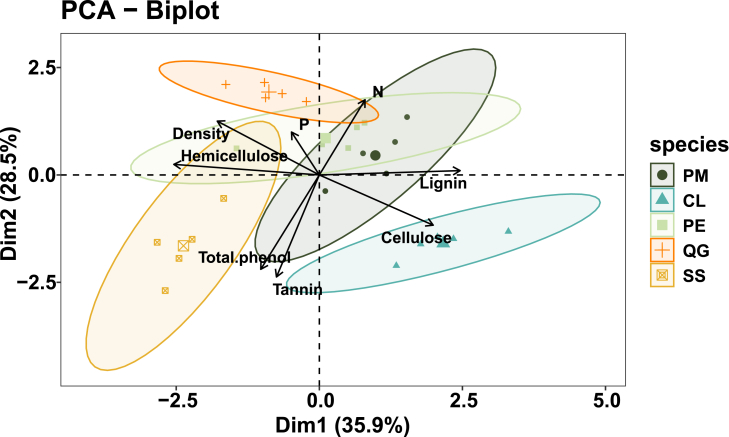 Figure 5
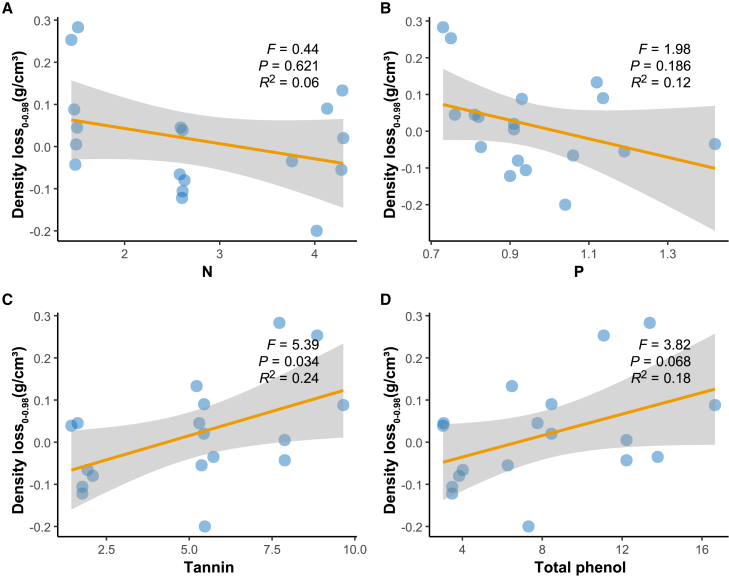 Figure 6
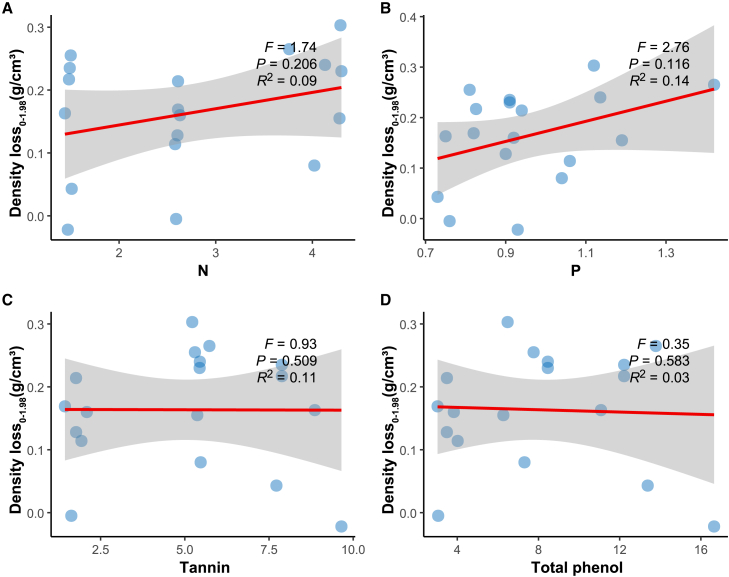 Figure 7
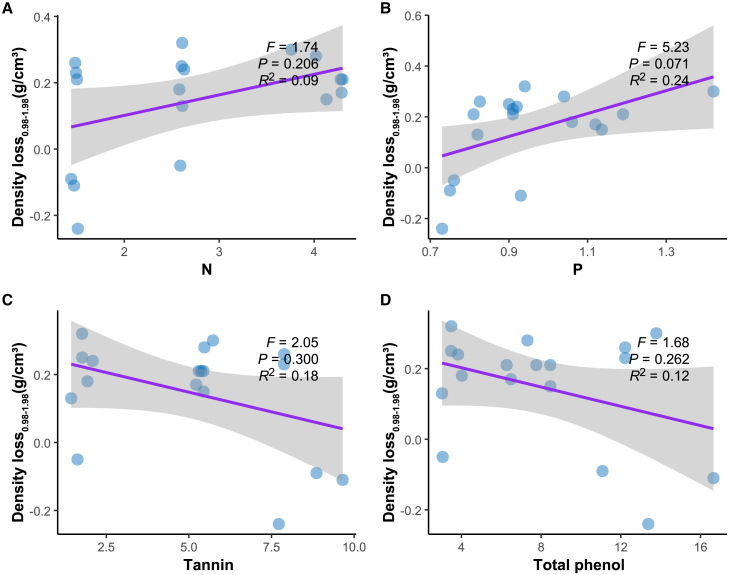 Figure 8
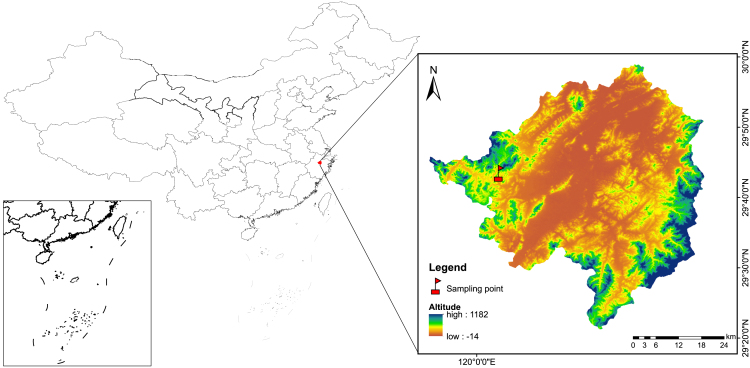 Figure 9
Peer Reviews
No public reviews on file for this paper yet. If you reviewed it on a platform where reviews are public (OpenReview, ICLR, NeurIPS, ICML), you can paste yours below so the community can read it here.
Videos
No videos yet. Explain this paper in a talk, walkthrough, or lecture? Add one.
Taxonomy
TopicsForest Ecology and Biodiversity Studies · Mycorrhizal Fungi and Plant Interactions · Forest Insect Ecology and Management
Introduction
Forests play a critical role in carbon sequestration and nutrient cycling in terrestrial ecosystems.1 Woody debris in forests includes snags (standing dead trees), logs, stumps, large branches, and twigs. Following Long-Term Ecological Research (LTER) standards, it is classified as coarse woody debris (CWD, diameter ≥10 cm) and fine woody debris (FWD, diameter >2 cm and <10 cm).2 Notably, CWD is a key ecological unit in forests due to its high structural and functional significance.3^,^4^,^5 Through decomposition, CWD mediates carbon transfer from vegetation to soil pools, regulating carbon cycling and balance in forest ecosystems.6^,^7 Globally, forest CWD stores 20–160 Pg C,8 comprising ∼8% of the total carbon pool.9^,^10 Decay classes serve as a common, time-efficient tool to estimate decay stages, reflect physicochemical changes in CWD, and are fundamental for accurate CWD carbon stock assessment, dynamic nutrient-cycling modeling, and understanding biological community succession.
CWD serves as a critical biodiversity reservoir in forest ecosystems, supporting an estimated 400,000–1,000,000 taxa across its surface and internal matrices. These biological communities include epiphytic flora (e.g., mosses, lichens, and ferns), microbial consortia (bacteria, fungi, archaea), invertebrates, plant seedlings, and vertebrates. As decomposition progresses, these assemblages undergo predictable successional shifts in composition and structure.11^,^12 For instance, bacterial species richness and diversity increase progressively with decay stage.13 CWD carbon stocks also vary significantly among decay classes,14 approximating a normal distribution across decomposition stages but exhibiting pronounced spatial heterogeneity.15^,^16 In most forest ecosystems, CWD in intermediate decay stages (II–III) constitutes a major carbon storage fraction.17 By contrast, Class V CWD is largely reduced to a fine, soil-integrated powder with low bulk density and carbon content, resulting in minimal carbon storage.
In forests, CWD is naturally input by tree competition and disturbance-induced forest decline and tree mortality, e.g., wind, snow, fire, insects, debris flows, fungal invasion, and human disturbances such as logging.18 Tree mortality is expected to increase and contribute to a larger CWD stock in global forests, as extreme events are predicted to occur with greater frequency and severity in the future.19^,^20 Therefore, researchers are increasingly concerned about changes in CWD stocks and ecological processes in forest ecosystems under climate change, in addition to their ecological roles.21^,^22
CWD decomposition is a complex ecological process influenced by intrinsic factors (e.g., substrate quality, including wood chemical and physiological properties), and external factors (e.g., climatic conditions such as temperature/moisture and decomposers such as fungi, bacteria, termites, beetles, and other invertebrates).23^,^24 Among these, substrate quality plays a critical role in the early decay stages.25^,^26 Consequently, decomposition rates vary significantly among tree species: higher lignin concentrations and dry-matter content enhance decay resistance. For instance, in the U.S. Pacific Northwest, Alnus logs exhibit a decomposition rate (k = 0.08 years^−1^) nearly an order of magnitude higher than Thuja logs (k = 0.007 years^−1^).4 Generally, angiosperms decompose faster than gymnosperms.
Gymnosperm wood is rich in lignin, which forms a barrier around the lignocellulosic complex due to its complex structure and high concentration. Additionally, gymnosperm logs contain abundant extractable organic compounds (e.g., terpenes and derivatives), which suppress fungal growth and degradation activities.27^,^28 These factors collectively hinder gymnosperm decomposition.29 In contrast, angiosperms are nutrient-dense (e.g., N and P), with high N/P concentration attracting decomposers and accelerating decay.26 Intrinsic defensive compounds (e.g., tannins and phenols) also influence decay rate. Cheng et al. showed that tannins alone explained 33–40% of decay rate variation in smooth cord-grass (Spartina alterniflora Loisel.).30 Tannins and phenolics inhibit decomposition by chelating proteins, toxic effects on microbes, and enzyme activity suppression.31^,^32 While previous research focused on defensive compounds in litter decomposition, their interactions with nutrient traits in deadwood decomposition remain underexplore.33
To answer these questions, we established a forest experimental platform in the subtropical region of southeastern China. The study included two coniferous species: Masson pine (Pinus massoniana Lamb.) and Chinese fir (Cunninghamia lanceolata (Lamb.) Hook.); two broadleaved species: Cyclobalanopsis glauca (Quercus glauca Thunb.) and Schima (Schima superba Gardner & Champ.); and moso bamboo (Phyllostachys edulis). Although Phyllostachys edulis forms extensive bamboo forests in the region, its deadwood decomposition dynamics are poorly understood. Compared to conifers and broadleaves, it exhibits distinct decay patterns due to large internodal cavities, high cortical silica content, and unique lignocellulose composition.34
In this study, we performed a five-year in situ field experiment on deadwood of five species to analyze dynamic changes in N, P, tannin, and total phenolics during decomposition. We explored the relationships between nutrients/defensive compounds and decay rates across different decay stages. We hypothesized that: (i) decomposition rates would differ significantly among species, with moso bamboo exhibiting an intermediate decay rate between fast-decaying broadleaves and slow-decaying conifers; (ii) in this subtropical ecosystem, high N and P contents in CWD would promote decomposition, whereas elevated tannin and phenolic levels would inhibit it.
Results
Decay rate difference among species
Over the 5-year decomposition period, the decomposition rate k was Schima superba (0.235 years^−1^) > Quercus glauca (0.224 years^−1^) > Phyllostachys edulis (0.168 years^−1^) > Pinus massoniana (0.026 years^−1^) > Cunninghamia lanceolata (0.017 years^−1^) (Figure 1). The angiosperm and bamboo deadwood exhibited rapid decomposition in the first two years, with mass loss reaching 53.32%(SS), 46.46% (QG), and 37.84% (PE), respectively.Figure 1CWD decomposition rates of the five studied species over 5-year periodDecomposition rate constant (k) was estimated using an exponential model. Pinus massoniana Lamb. (PM); Cunninghamia lanceolata (Lamb.) Hook. (CL); Quercus glauca Thunb. (QG); Schima superba Gardner & Champ. (SS); and Phyllostachys edulis (PE).
N and P change dynamics
N and P contents in CWD were primarily modulated by decomposition time rather than tree species (Tables 1 and 2). After one year of decay, all species showed N accumulated in deadwood, with Schima superba exhibiting the highest increase (2.5-fold of initial content) and Phyllostachys edulis the lowest (0.49-fold) (Figures 2 and 3). Conversely, P content decreased rapidly within the first year and stabilized thereafter, with no significant interspecific differences (Figures 2 and 3).Table 1. Two-way ANOVA analysis of nutrients (N, P) and defensive compounds (tannin and total phenol) affected by decay year (Y) and tree species (i.e., CWD type, S)ComponentsFactorsDfFp valuePEta.sqaNitrogen (N)Decay year (Y)459.30<0.001∗∗∗0.80Species (S)42.72<0.05∗0.15Y×S162.40<0.001∗∗∗0.39Phosphorus (P)Decay year (Y)4208.480.008∗∗0.93Species (S)41.930.1170.11Y×S161.590.1000.30TanninDecay year (Y)450.35<0.001∗∗∗0.77Species (S)44.710.002∗∗0.24Y×S169.00<0.001∗∗∗0.71Total phenolDecay year (Y)431.13<0.001∗∗∗0.68Species (S)43.54<0.05∗0.19Y×S164.27<0.001∗∗∗0.53aPEta.sq: Partial Eta squared which used to measure the effect size of different variables in ANOVA models.Table 2. One-way ANOVA of nutrients (N, P) and defensive compounds (tannin and total phenol) affected by decay year for each species (i.e., CWD type)SpeciesaComponentsFp valueEtabPEta.sqcPMN9.610.001∗∗∗0.870.76P17.30<0.001∗∗∗0.920.85Tannin3.530.04∗0.740.54Phenol2.550.090.680.46CLN37.31<0.001∗∗∗0.960.93P33.11<0.001∗∗∗0.960.92Tannin12.49<0.001∗∗∗0.900.81Phenol16.81<0.001∗∗∗0.920.85PEN5.78<0.01∗∗0.810.66P72.53<0.001∗∗∗0.980.96Tannin173.06<0.001∗∗∗0.990.98Phenol5.85<0.01∗∗0.810.66QGN8.03<0.01∗∗0.850.73P100.17<0.001∗∗∗0.990.97Tannin1.890.1810.620.38Phenol0.660.630.420.18SSN24.24<0.001∗∗∗0.940.89P103.46<0.001∗∗∗0.990.97Tannin36.18<0.001∗∗∗0.960.92Phenol17.93<0.001∗∗∗0.930.86aPM: Pinus massoniana; CL: Cunninghamia lanceolata; PE: Phyllostachys edulis; QG: Quercus glauca; SS: Schima superba.bEta is the arithmetic square root of the Eta square.cPEta.sq: Partial Eta squared which used to measure the effect size of different variables in ANOVA models.Figure 2. The N, P, tannins, and total phenols content (mean ± SD) in different tree species (i.e., CWD types) along with decay progressDifferent lower letters indicate statistically significant differences (p < 0.05) in the indicators among different tree species at certain decay year.Figure 3. Relative changes (compared to the first sampling) in N, P, tannins, and total phenols with decay process in different tree species (i.e., CWD types)Different lower letters indicate statistically significant differences (p < 0.05) in the indicators among different decay times.
As shown in Table 2, decay time (years since initial sampling) significantly influenced N and P concentrations (p < 0.01, PEta.sq = 0.66–0.97), explaining 66–97% of their variance. The dynamics of defensive compounds during decomposition were species-specific. Tannin and total phenol contents changed significantly over time in Pinus massoniana (tannin only), Cunninghamia lanceolata, Phyllostachys edulis, and Schima superba (p < 0.05, PEta.sq = 0.46–0.98), whereas no such trends were observed in Quercus glauca.
Tannin and total phenol change dynamics
During decomposition, all species except Quercus glauca exhibited significant declines in tannins (−37.53% to −88.25%) and total phenolics (−37 to −85%) in the first year. Quercus glauca had the lowest initial concentrations of both compounds, which remained stable throughout decay. Tannin and phenolic compounds in deadwood were released during the first year for Pinus massoniana, Phyllostachys edulis, and Schima superba, and continuously decreased until the fifth year for Cunninghamia lanceolata (Figures 2 and 3). Schima superba displayed the highest initial levels of tannins and phenolics, coupled with the steepest first-year decline.
Initial stem wood traits in relation to decay rate among different species
Principal component analysis showed that the cumulative contribution of the first and second principal axes to the decay rate was 35.9% and 28.5%, respectively (Figure 4). The relatively fast decomposition species clustered in the left upper panel, showing that wood with high wood density, high P, and high hemicellulose characteristics is more decomposed.Figure 4PCA of different tree species (i.e., CWD types) and influence factors including the wood density, C, N, P, cellulose, hemicellulose, lignin, tannin, and total phenol
Nutrients and defensive components in relation to decay rates
Over the 0–0.98 year period, mass loss rate was significantly and positively correlated only with initial tannin content in the three fast-decaying species (Phyllostachys edulis, Quercus glauca, and Schima superba) (Figure 5). The initial tannin content explained 24% of the density loss. However, N, P, and total phenolics showed no significant linear correlations during the 0–0.98 years (Figure 5), 0–1.98 years (Figure 6), or 0.98–1.98 years (Figure 7). Although not statistically significant, total phenolics trended similarly to tannins.Figure 5. Analysis of the relationship between initial N, P, tannins, and total phenols and density loss from 0 to 0.98 years using linear mixed modeling(A) Linear mixed model between initial N and 0-0.98 year density loss.(B) Linear mixed model between initial P and 0-0.98 year density loss.(C) Linear mixed model between initial tannin and 0-0.98 year density loss.(D) Linear mixed model between initial total phenol and 0-0.98 year density loss.Figure 6. Analysis of the relationship between initial N, P, tannins, and total phenols and density loss from 0 to 1.98 years using linear mixed modeling(A) Linear mixed model between initial N and 0-1.98 year density loss.(B) Linear mixed model between initial P and 0-1.98 year density loss.(C) Linear mixed model between initial tannin and 0-1.98 year density loss.(D) Linear mixed model between initial total phenol and 0-1.98 year density loss.Figure 7. Analysis of the relationship between initial N, P, tannins and total phenols and density loss from 0.98 to 1.98 years using linear mixed modeling(A) Linear mixed model between initial N and 0.98-1.98 year density loss.(B) Linear mixed model between initial P and 0.98-1.98 year density loss.(C) Linear mixed model between initial tannin and 0.98-1.98 year density loss.(D) Linear mixed model between initial total phenol and 0.98-1.98 year density loss.
Discussion
This study revealed significant interspecific variation in the CWD decomposition rates (k-value). Specifically, the broadleaved species Quercus glauca (k = 0.224 years^−1^) and Schima superba (k = 0.235 years^−1^) decomposed 1.4-fold faster than Phyllostachys edulis (k = 0.168 years^−1^). Coniferous species showed minimal mass loss over the five-year observation period, supporting our first hypothesis that angiosperm-derived CWD decays faster than conifer-derived CWD. A global synthesis of 295 k-value estimates revealed up to 244-fold variation in CWD decomposition rates, with species-level variation reaching 76-fold at individual sites. This aligns with previous findings that conifers exhibit significantly lower k-values than angiosperms.2 For bamboo, our results align with tropical forest studies showing moso bamboo decomposes more slowly than angiosperm trees.35
Previous studies have showed that initial N content in CWD is closely linked to interspecific decomposition rates variations.36 Higher initial N in plant residues stimulates microbial metabolism, growth, and reproduction, thereby accelerating substrate decomposition rates.37 However, Schima superba CWD decomposed fastest (Figure 3), indicating that factors other than initial N availability primarily regulate its decay. This rapid decomposition may be attributed to elevated microbial respiration, which converts CWD carbon into CO_2_, driving continuous decay. Additionally, N content increased significantly in all CWD species during decomposition, likely due to microbial N immobilization. In addition to N, P serves as a critical co-limiting nutrient in CWD decomposition.36 Our study found significant interspecific variation in the initial P content among CWD types. For instance, Phyllostachys edulis CWD (1.14 mg·g^−1^) had 61% higher P than Cunninghamia lanceolata (0.71 mg·g^−1^). This P availability difference correlated with decomposition rates, as higher P enhances microbial enzyme activity and substrate mineralization, accelerating mass loss. Among coniferous species, Cunninghamia lanceolata had lower P content and slower decay than Pinus massoniana (Figure 3), suggesting that available P may limit early decay in conifers. During decomposition, P followed a “release pattern,” likely due to nutrient release in the early stages of CWD decomposition.37
CWD consists of labile organic compounds (sugars, starches, proteins) and complex structural polymers (cellulose, hemicellulose, lignin). Interspecific variations in these components significantly influence CWD decomposition rates. During early decay, species-specific chemical profiles emerge due to CWD structural heterogeneity. As decomposition progresses and labile components are consumed, lignin becomes dominant, with the residual lignin concentration determining interspecific decay variation in later stages.38 Incorporating initial lignin content into decomposition models can greatly improve the accuracy of predicting decomposition rates (R^2^ = 0.55),39 consistent with this study’s findings. Cellulose is hydrolyzed by extracellular enzymes into small carbon compounds during pre-decomposition stages, which are easily absorbed and utilized by microorganisms.40 In contrast to other components, lignin is more difficult to decompose and therefore remains at a higher level in later stages of decomposition. This leads to an increase in the lignin/cellulose ratio over time.41 In this study, Pinus massoniana, Cunninghamia lanceolata, and Phyllostachys edulis with high initial lignin content exhibited lower decomposition rates compared to two angiosperms. Studies in the Indian Himalayan region showed litter C:N ratio and lignin content regulated the k-value,42 while in Karnataka’s southern dry agroclimatic zone, lignin content and the lignin:N ratio determined Ficus benghalensis litter decay rates.43 Lignin has a large and complex structure that makes it difficult to decompose. It may hinder the degradation of cellulose and hemicellulose embedded in cell wall structures containing lignins.39 On the other hand, most wood-degrading microorganisms primarily decompose cellulose; therefore, high levels of lignin prevent access for cellulose because wood-cell walls act as a physical barrier against non-lignocellulosic degrading microbes.25
Phenols and tannins, as secondary metabolites, represent another type of recalcitrant compound besides lignin, widely present in CWD.44^,^45 In this study, tannin and phenol content in CWD species (except Quercus glauca, which maintained a low level) showed an overall decrease. Significant interspecific differences in initial tannin and phenol content were observed, consistent with previous studies on subtropical tree species.46 Contrary to our hypothesis, tannins and phenols did not persist in CWD. Gymnosperms had low initial levels, while the angiosperm Schima superba, with the highest tannin and phenol content, decomposed fastest. This may be related to the rapid decline in tannin and phenol content within 0.98 years in Schima superba. Except for Quercus glauca, all tree species showed a rapid decrease in these compounds by 0.98 years, likely due to early-stage leaching.47 The rainfall at the research site (Figure 8) is mainly concentrated from May to August, which enhances the leaching of phenolic compounds,48^,^49 promoting their degradation. Additionally, angiosperms attract more early-colonzing bacteria and fungi,26 including microbes such as Staphylococcus, Klebsiella, Bacillus that utilize tannins as a carbon source for growth,50^,^51 indicating context-dependent roles of tannin in decomposition. Quercus glauca showed no significant change in tannin and total phenolic content over five years, with a decomposition rate secod only to Schima superba, suggesting that it xylem anatomical and physical structure may override chemical effects on decay.Figure 8. Geographical location of the study area
Conclusions
In a five-year controlled experiment simulating tree dumping, we measured the decay rates of CWD from five dominant subtropical tree species. Results showed significant interspecific variation in decay rates. Two broadleaf species decomposed 40% and 18% faster than bamboo, respectively, while coniferous species decay more slowly. P availability limited decomposition in this subtropical region, whereas defensive tannins and phenolics had weak inhibitory effects during early decay. Our findings enhance the understanding of CWD-driven carbon and nutrient fluxes in subtropical forests. Species-specific k-value and nutrient release quantification improve the estimates of CWD contributions to long-term carbon sequestration and soil organic matter formation. In Chinese subtropical forests dominated by broadleaved trees, targeted management strategies can optimize deadwood carbon sequestration, especially during the early post-mortality phase after natural disturbances or large-scale tree dumping. As a crucial link between vegetation and soil carbon pools, CWD dynamics regulate forest carbon balance. Future research should elucidate the interactions among CWD, vegetation, and soil carbon pools to better quantify CWD’s role in the forest carbon cycle.
Limitations of the study
Although this study conducted a 5-year in situ decomposition experiment to investigate interspecific CWD decay dynamics, integrating chemical analyses of cellulose, lignin, tannins, phenolics, and measurements of N and P nutrients, several limitations remain.
First, decay rates were calculated based on temporal changes in wood density, a method that overlooks volume loss from log morphological alterations during decomposition, potentially underestimating decay rates.
Second, bark, a common woody substrate covering tree trunks, exhibits distinct differences in nutrient concentration, density, structure, and function compared to wood. However, in experimental designs, bark and wood are often treated as a homogeneous substrate. This simplification hinders our understanding of how bark properties affect the decomposition processes of both bark and wood.
Resource availability
Lead contact
Further information and requests for resources and reagents should be directed to and will be fulfilled by the lead contact, Nan Wang ([email protected]).
Materials availability
This study did not generate new unique reagents.
Data and code availability
- •Data: The data reported in this article are available within the main text or supplemental information and will be shared by the lead contact upon request.
- •Code: This article does not report original code.
- •Other items: Any additional information required to reanalyze the data reported in this article will be shared by the lead contact upon request.
Acknowledgments
Research Foundation of Shaoxing 330 Overseas Talents Program.
Author contributions
N. W. and X. W. designed the study. T. X. performed the data analysis and statistical analyses. T. X. and H. C. performed experiments. S. B. assisted in carrying out the experiments. T. X. and N. W. wrote the article.
Declaration of interests
The authors declare no competing interests.
STAR★Methods
Key resources table
REAGENT or RESOURCESOURCEIDENTIFIERChemicals, peptides, and recombinant proteinsK_2_SO_4_Energy Chemical Ltd.Cat# 7778-80-5NaOHEnergy Chemical Ltd.Cat# 1310-73-2Na_2_CO_3_Energy Chemical Ltd.Cat# 497-19-8H_3_P(Mo_3_O_10_)4·xH_2_OEnergy Chemical Ltd.Cat# 51429-74-4Na_2_WO_4_·2H_2_OEnergy Chemical Ltd.Cat# 10213-10-2CuSO4·5H_2_OEnergy Chemical Ltd.Cat# 7757-99-8DNSEnergy Chemical Ltd.Cat# 34490-86-3Software and algorithmsR version 4.3.1R Core Teamhttps://www.r-project.org/
Method details
Study area and site
The study was conducted in Wuxie National Forest Park (29°72′N, 120°05′E) in Zhuji City, Zhejiang Province, China, with average elevation of 220 m (Figure 8). This area belongs to the subtropical monsoon climate zone, with warm and rainy summer and cold winter. The average annual air temperature is 16.3°C, the average annual rainfall is 1374 mm. The average annual rainfall is 158.3 days, mainly concentrated from May to August (70% occurred in this period). The soil type is mountain red and yellow, with pH of 4.5-5.3. The park’s land-use types include cropland, orchards, grassland, and forestland. The forestland spans 534 hectares, mainly comprising subtropical evergreen broadleaf forest, mixed conifer-broadleaf forest, and Moso bamboo forest. Evergreen broadleaf and mixed conifer-broadleaf forests together cover 377 hectares, accounting for 74.7% of the total forest area.
Experimental design and sample collection
In January 2018, mature trees of five species (Pinus massoniana, Cunninghamia lanceolata, Quercus glauca, Schima superba and Phyllostachys edulis), each in 8-10 individuals were harvested from the forest at the study site. The trees are naturally growing and healthy. The trunks were then cut into 1m-long logs and laid flat on the ground (as down wood). In this study, CWD was categorized by its origin species, with five CWD types representing the dominant coniferous and broadleaved trees in the study area. To maintain consistency and clarity, “CWD type” and “tree species” are used interchangeably in the text, tables, and figures. For example, the notation "tree species (i.e., CWD type)" is utilized to highlight their equivalence. Samples were then taken from the felled logs at yearly intervals at 0, 0.98, 2.39, 3.23 and 4.81 years. At the time of collection, 5-10 cm wood disk were cut from the logs and taken to the laboratory in self-sealing bags. The samples were dried naturally for five days, then nearly 1/4 of each sample was taken to measure dry weight and volume (drainage method). The bulk density can be defined as:
where, M is the dry weight of the sample (g); V is the volume of the sample (cm^3^); and is the bulk density of the sample (g/cm^3^).
Air-dried samples were oven-dried at 70°C until reaching a constant weight.52 The oven-dried materials were homogenized by ball-mill grinding to produce a fine powder for the quantitative analysis of chemical constituents.
Chemical analysis
The N content was analyzed by the semi-Kjeldahl method53 and P by atomic absorption spectrometry method.54 The total phenolic content was determined by the Folin–Ciocalteu method.55 Under alkaline conditions, the phenolic substances reduce tungstic molybdic acid to produce a blue compound with a characteristic absorption peak at 760 nm, and the absorbance value was read to calculate the total phenol content. The tannin content was determined by the microplate method.56^,^57 Tannins reduce phosphomolybdic acid under alkaline conditions to form a blue compound, and the resulting absorbance was measured at 650 nm. The lignocellulose fractions of the wood were also determined, these data are listed in the Appendix (Table S1; Figure S1), the data were only used for the final integrated analysis. Lignin was determined by the acetylation method.58^,^59 The cellulose content was determined by the anthrone colorimetric method.60 The xylose content was determined by colorimetric method,61 and then the hemicellulose content was calculated.
Quantification and statistical analysis
The wood decay rates among different tree species were calculated by wood loss estimated by wood density (WD) change with decay years. The negative exponential decay models were fitted separately for different trees species to estimate how wood density change with decay years.
where, t is time in years; A and k are the estimate of initial density and decay rate constant (/year) of the model, respectively. Parameter estimates are not statistically significant when P value >0.05 or low R^2^.
Two-way ANOVA was used to analyze the effects of tree species, decomposition time and their interactions on N, P, tannin and total phenol contents in CWD. One-way ANOVA was used to analyze the effects of decomposition time on their changes in each tree species, and the value of the Eta-squared was calculate.62 Principal Component Analysis (PCA) was used to detect differences in initial wood properties between species. Raw variables were Z-score standardized (mean = 0, SD = 1). Subsequently, a covariance matrix was calculated from the standardized data and subjected to eigenvalue decomposition to obtain eigenvalues and eigenvectors. Based on the Kaiser-Harris criterion, principal components with eigenvalues greater than 1 were selected for further analysis. To improve interpretability, Varimax rotation was performed to maximize variance in loading matrices, ensuring that each principal component was predominantly characterized by a reduced number of variables. Linear mixed model (LMM) was conducted to analyze the relationship between density loss rate in the first two years (because fast-decay species lost large mass in first two years), in relation to N, P, tannin and total phenol at initial (year 0) and the later (year 0.98). The LMM is an extension of the multiple linear models where covariates are assumed to have a linear relationship to the dependent variable. It is normally used when data is not independent. This model is considered more realistic or logical compare to a traditional linear model which only considers the fixed effects. Data analysis was conducted using R software, version 4.2.1 with RStudio. Originlab 2021 was used for plotting.
The reference list from the paper itself. Each links out to its DOI / PubMed record.
- 1Cao Y.You W.B.Wang F.Y.Wu L.Y.He D.J.Research progress on carbon storage of coarse woody debris in forest ecosystems Acta Ecol. Sin.4120217913792710.5846/stxb 202012293309 · doi ↗
- 2Harmon M.E.Fasth B.G.Yatskov M.Kastendick D.Rock J.Woodall C.W.Release of coarse woody detritus-related carbon: a synthesis across forest biomes Carbon Bal. Manag.15202012110.1186/s 13021-019-0136-6PMC 722711131940113 · doi ↗ · pubmed ↗
- 3Herrmann S.Kahl T.Bauhus J.Decomposition dynamics of coarse woody debris of three important central European tree species For. Ecosyst.220152710.1186/s 40663-015-0052-5 · doi ↗
- 4Freschet G.T.Weedon J.T.Aerts R.van Hal J.R.Cornelissen J.H.C.Interspecific differences in wood decay rates: insights from a new short-term method to study long-term wood decomposition J. Ecol.100201216117010.1111/j.1365-2745.2011.01896.x · doi ↗
- 5Chen J.Duan W.B.Qu M.X.Effects of uprooted treefalls and their microsites on decomposition rate and nutrient release of litters in Picea koraiensis-Abies nephrolepis-Pinus koraiensis forest Acta Ecol. Sin.4120219749975910.5846/stxb 202009302526 · doi ↗
- 6Bilous A.Matsala M.Radchenko V.Matiashuk R.Boyko S.Bilous S.Coarse woody debris in mature oak stands of Ukraine: carbon stock and decomposition features IDEAS 252019196219
- 7Hu H.Wang S.Guo Z.Xu B.Fang J.The stage-classified matrix models project a significant increase in biomass carbon stocks in China’s forests between 2005 and 2050 Sci. Rep.520151120310.1038/srep 11203 PMC 448014426110831 · doi ↗ · pubmed ↗
- 8Russell M.B.Fraver S.Aakala T.Gove J.H.Woodall C.W.D’Amato A.W.Ducey M.J.Quantifying carbon stores and decomposition in dead wood: A review For. Ecol. Manage.350201510712810.1016/j.foreco.2015.04.033 · doi ↗