Analytical dataset to determine squeezing potential of deep tunnels
Ferlien Margareth Mareyke Mombilia, Simon Heru Prassetyo, Yudhidya Wicaksana, Ridho Kresna Wattimena, Anatasya Claresta

TL;DR
This paper introduces a dataset and analytical method to assess and mitigate squeezing risks in deep tunnel construction using ground reaction curves and strain data.
Contribution
The novel contribution is the development of a dataset and analytical framework using ground reaction curves to estimate support pressure for deep tunnel stability.
Findings
480 ground reaction curves were developed and analyzed for various tunnel radii and depths.
Strain and stability factors were classified to estimate the minimum internal pressure ratio for tunnel stability.
A graph was created to determine optimal support pressure for different rock mass conditions.
Abstract
This article presents a dataset that consists of historical strain data from deep tunnel construction and an analytical study that uses the ground reaction curve (GRC) to calculate the support pressure required to lower the risk of squeezing potential. In deep tunnel excavation, high in-situ stress conditions can cause an instability phenomenon known as squeezing. Historical tunnel strain data are classified into categories based on the percentage of tunnel convergence observed. Furthermore, 480 ground reaction curves (GRC) were developed and analyzed: 5280 calculations were performed with tunnel radii of 3, 4, and 5 m, depths ranging from 100 to 1000 m (in increments of 100 m), uniaxial compressive strength (σci) values of 30 and 50 MPa, and Geological Strength Index (GSI) values from 20 to 90 (in increments of 10). Three primary factors were used to estimate support capacity: the…
Genes, proteins, chemicals, diseases, species, mutations and cell lines named across the full text — each resolved to its canonical identifier and authoritative record.
Click any figure to enlarge with its caption.
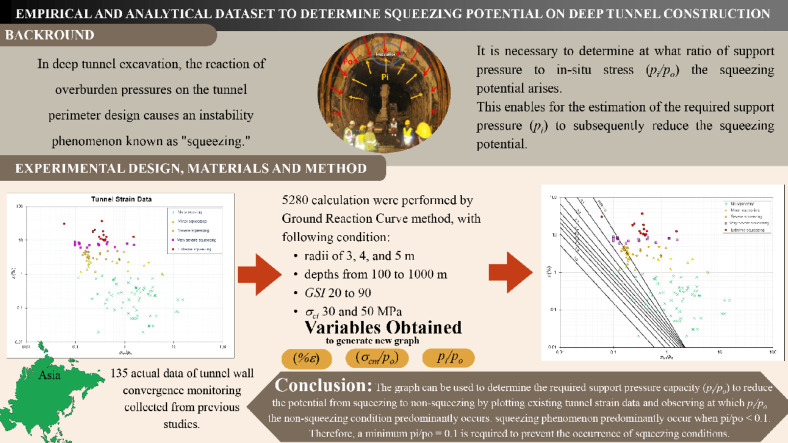 Figure 1
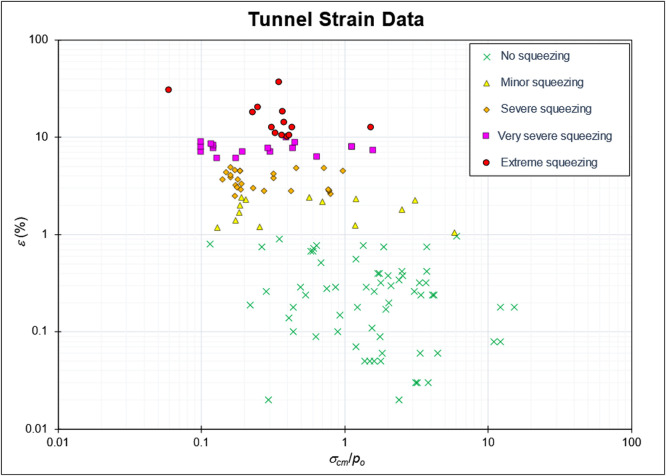 Figure 2
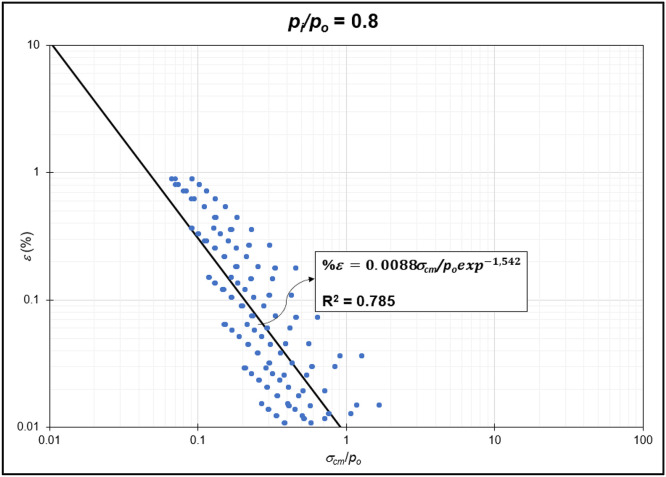 Figure 3
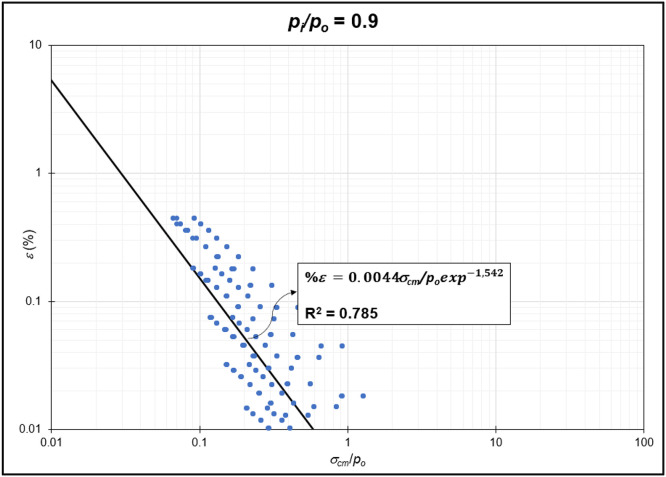 Figure 4
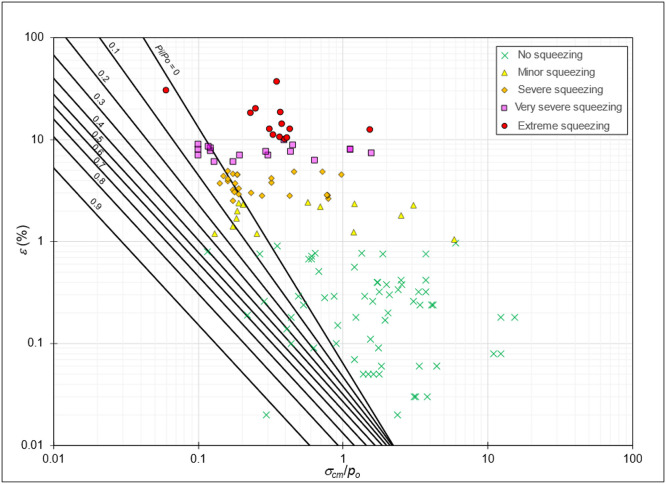 Figure 5
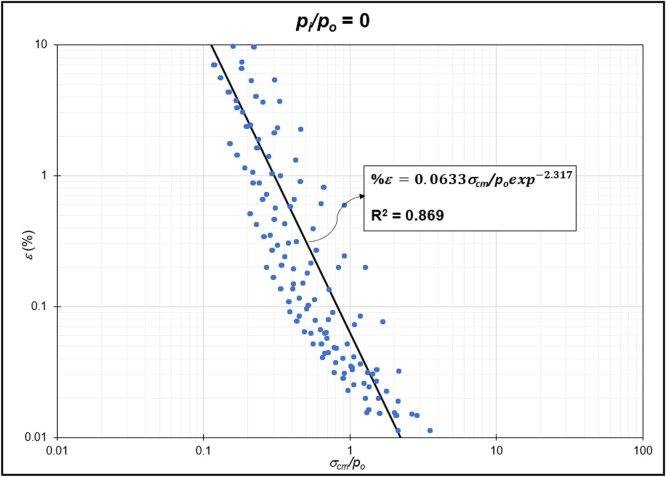 Figure 6
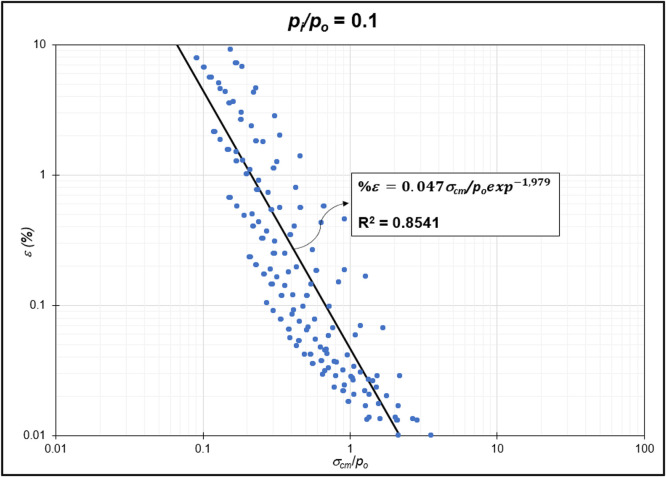 Figure 7
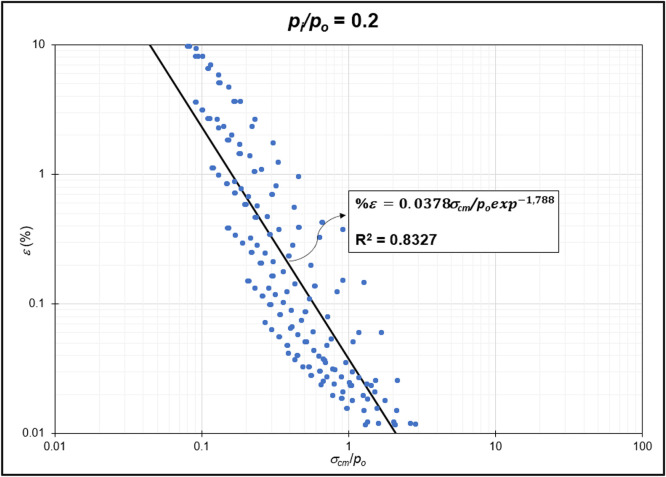 Figure 8
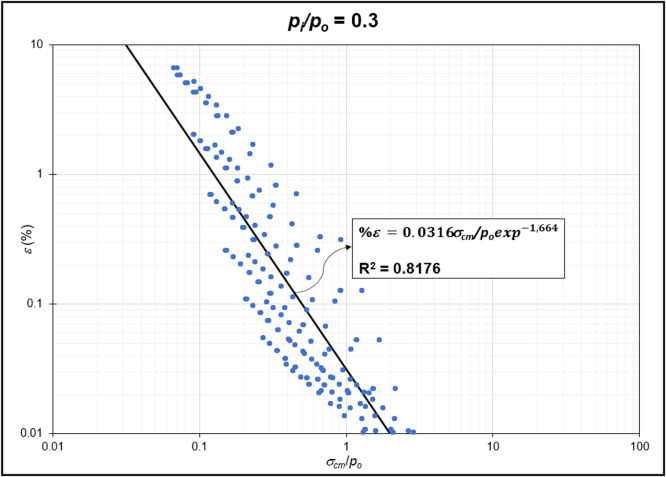 Figure 9
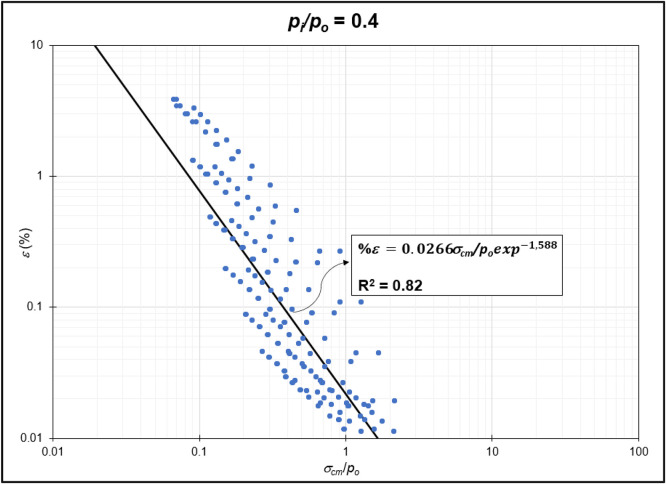 Figure 10
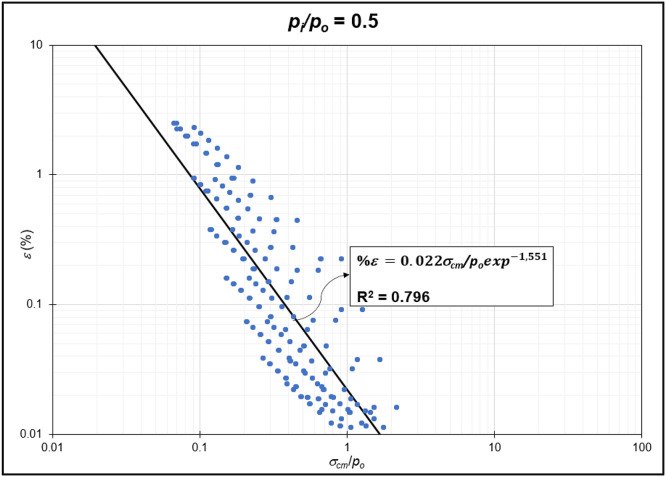 Figure 11
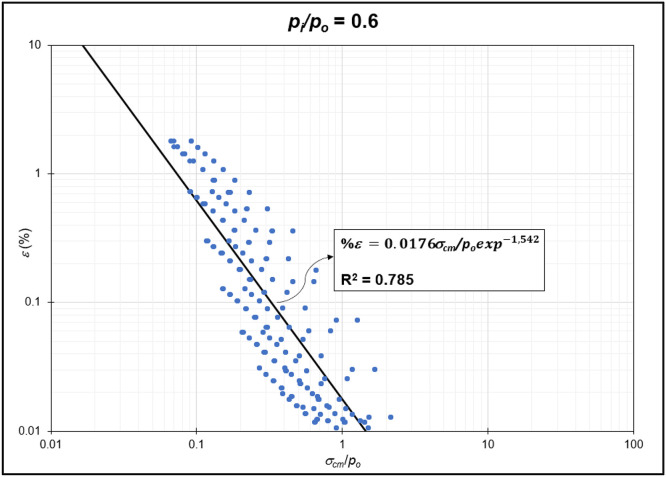 Figure 12
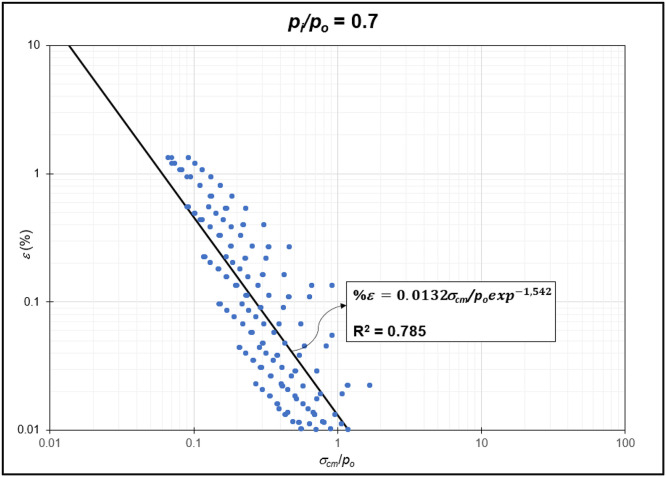 Figure 13
Peer Reviews
No public reviews on file for this paper yet. If you reviewed it on a platform where reviews are public (OpenReview, ICLR, NeurIPS, ICML), you can paste yours below so the community can read it here.
Videos
No videos yet. Explain this paper in a talk, walkthrough, or lecture? Add one.
Taxonomy
TopicsRock Mechanics and Modeling · Tunneling and Rock Mechanics · Drilling and Well Engineering
Specifications TableSubjectEngineering & Materials scienceSpecific subject areaCalculation of support capacity in deep tunnel construction to reduce squeezing potentialType of dataTable, raw, analyzed, Excel file, TIFF imagesData collectionA total 135 data points of tunnel strains were gathered from various literature sources, as indicated in the Excel table (file Dataset GRC.xlsx) and in the reference list. These data present the convergence on tunnel walls, obtained from actual field measurements. No previous study has collected tunnel convergence data in quantities equal to or exceeding those in this research. These data are highly valuable for analyzing the rock type factors that cause squeezing, determining the percentage of convergence that causes squeezing, and identifying the minimum support capacity based on the p_i_/p_o_ ratio to prevent squeezing occurrences.Data source locationTunnel strain data in this study are secondary data collected from various literature sources: 94 % of the points are from tunnel construction projects in Nepal, India, and Turkey, while the remaining 6 % come from tunnels in France and China. The literature sources from which the strain data were obtained are listed below:Barla G, Tunnelling in squeezing rock condition, Proceedings of ROCKSITE-99 India, (1999)Dehkordi MS, Shahriar K, Moarefvand P, Gharouninik M, Application of the strain energy to estimate the rock load in non-squeezing ground condition, Arch Min Sci 56:551–566 (2011)Dwivedi RD, Singh M, Prediction of tunnel deformation in squeezing grounds, Eng Geol 161: 55–64 (2013)Hoek E, Big tunnels in bad rock, J Geotech Geoenviron Eng 127(9): 726–740 (2001)Mhanna M, Hussein HH, Analysis of squeezing‐induced failure in a water tunnel and measure of rehabilitation: a case study of Tishreen Tunnel, Syria, Deep Undergr Sci Eng 2024: 1–13 (2024)Sharma S, Muthreja IL, Yerpude RR, Application and comparison of squeezing estimation methods for Himalayan tunnels, Bull Eng Geol Environ 79: 205–223 (2019)Singh M, Singh B, Choudhari J, Critical strain and squeezing of rock mass in tunnels, Tunn Undergr Space Technol 22: 343–350 (2006)Singh B, Jethwa JL, Dube AK, Singh B, Correlation between observed support pressure and rock mass quality, Tunn Undergr Space Technol 7: 59–74 (1992)Data accessibilityData provided in this article and supplementary material in Mendeley Data.DOI: https://doi.org/10.17632/w3yhkp6zxn.1Related research articleNone
Value of the Data
1
- •Tunnel convergence monitoring data (tunnel strains) were collected and classified into squeezing classifications according to Hoek and Marinos (2000). These data were used to evaluate the exponential graph from ground reaction curve (GRC) analysis to determine the ratio between the support pressure and the in-situ stress (p_i_/p_o_).
- •This empirical-analytical study by GRC analysis represents all rock conditions, conducted with Geological Strength Index (GSI) variations ranging from 20 to 90 (very poor to excellent) for tunnel constructions at depths of 100–1000 mbgl. These GSI variations generate elastic modulus values, which influence the strain variations. Tunnel depth provides variations in material in-situ stress values, impacting the stability factor (σ_cm_/p_o_).
- •The GRC analysis dataset can be utilized to better understand rock mass instability mechanisms during deep tunnel construction.
- •This dataset is valuable for researchers and engineers in studying support capacity design for tunnels that indicate squeezing potential. They only need to collect two primary variables from the field: (1) tunnel convergence data in the form of strain (%ε) and (2) the stability factor (σ_cm_/p_o_).
Background
2
Squeezing is one of the instability phenomena in tunnel construction. It is a time-dependent deformation of rock that occurs around the perimeter of the opening and is usually associated with creep caused by exceeding the limiting shear stress of rock [12]. The identification and quantification of squeezing phenomena are generally conducted using empirical or semi-empirical approaches.
Previously, Hoek (1999) published a detailed analysis showing that the ratio of uniaxial compressive strength of the rock mass (σ_cm_) to in-situ stress (p_o_) can be used as an indicator of potential tunnel squeezing issues [13]. Following Sakurai’s (1983) recommendation, an analysis was conducted to determine the relationship between (σ_cm_/p_o_) and tunnel strain percentage [11]. Later, Hoek and Marinos (2000) expanded this analysis by incorporating internal pressure (p_i_) to simulate the effect of support pressure [9]. Building upon previous research, actual tunnel strain data and stability factors (σ_cm_/p_o_) were collected as a study of tunnel squeezing criteria, alongside ground reaction curve (GRC) calculations.
Under undisturbed conditions, the rock mass possesses its own strength, known as in-situ stress (p_o_). During tunnel excavation, the boundary strength—referred to as internal pressure (p_i_), acts radially outward from the tunnel wall and gradually decreases until maximum deformation is reached. The ratio of internal pressure to in-situ stress (p_i_/p_o_) is utilized as a key parameter in this study.
Furthermore, this study incorporates GSI values ranging from 20 to 90 in GRC calculations, representing the range of rock mass conditions as an improvement over the study by Hoek and Marinos (2000), which was limited to GSI 10-30.
Data Description
3
The compressed file in the dataset consists of a folder of GRC analytical calculations in a file titled Dataset GRC.xlsx. This Excel spreadsheet is a compilation of data on tunnel strains from the literature, processed calculations of GRC, and p_i_/p_o_ graphs generated from the GRC calculation.
In the GRC calculation sheet, the GRC computation is outlined to determine p_i_/p_o_, strain (%ε), and the stability factor (σ_cm_/p_o_). The GRC incorporates the influence of rock mass strength on underground construction. The analytical process was conducted for an intact UCS (σ_ci_) of 30 MPa, which yields varying cohesion (C_rm_) and internal friction angle (ϕ_rm_) values across a GSI range of 20-90 [Table 1]. The tunnel geometry is analyzed for radii (a) = 5 m, 4 m, and 3 m, with an overburden thickness (H) ranging from 100 to 1000 m below ground level (mbgl). A similar approach is applied to the calculations using an intact UCS (σ_ci_) of 50 MPa. The material attributes are based on the Mohr-Coulomb Duncan-Fama technique [10], which is explained in detail in the GRC Calculation Sheet.Table 1. Material properties of rock.Table 1σ_ci_ (MPa)γ (MN/m^3^)ΝRockmass ParametersGSI2030405060708090300.0250.2**C_rm_ (MPa)0.570.740.91.11.41.752.43.8ϕ_rm_ (°)21242730333537.539E_rm_ (MPa)67016403980934020360388306117079635K2.122.372.663.003.393.694.114.40σ_cm_ (MPa)1.662.282.943.815.166.729.7315.93500.0250.2**C_rm_ (MPa)0.750.981.201.461.822.433.585.89ϕ_rm_ (°)2327303336394142E_rm_ (MPa)67016403980934020360388306117079635K2.312.663.023.423.874.334.765.06σ_cm_ (MPa)2.293.194.175.397.1510.1015.6426.50Note: σ_ci_ = UCS intact; γ = Rock density; ν = Poisson’s Ratio; GSI = Geological Strength Index; C = Rock mass cohesion; ϕ = Rock mass internal friction angle; E_rm_ = Modulus elasticity of rock mass; K = Slope from Mohr envelope; σ_cm_ = UCS of Rock mass H = Tunnel depth from surface; p_o_ = In-situ stress.
The actual dataset from the tunnel wall convergence monitoring comprises 135 strain data points collected from previous studies on tunnels located in Nepal, India, Iran, Turkey, China, Japan, and Italy (see Data Strain Literature sheet) [[1], [2], [3], [4], [5], [6], [7], [8]]. The dataset in each column contains: Number (No), Name of tunnel, References, Location, Rock Type, Q, RMR, m_i_, GSI, Density (ɣ), Tunnel radius (a), Overburden height (H), UCS Intact σ_ci_, UCS Rock mass σ_rm_, p_o_ (In-situ stress), Tunnel strain (%ε), Deformation modulus of rock mass (E_rm_), Deformation modulus of intact rock (E_i_), Rock stability (σ_cm_/p_o_), Squeezing category, and Literature Sources. These tunnels are intended for both civil construction and underground mining purposes, with an average depth of 300 mbgl, an average tunnel radius (a) of 4 m, and a rock density (γ) of 2.6 t/m³. The rock lithologies, which include schist, dolomite, limestone, gneiss, phyllite, clay, sandstone, and shale, vary as a result of the tunnel’s locations. According to lithological analysis, strain that has >1 % convergence in tunnels found in phyllites and clay formations can range from 1 % to 36.7 %. These data were classified using Hoek and Marinos’ squeezing classification [9] based on tunnel strains (Fig. 1). The classification of squeezing percentage is presented in Table 2.Fig. 1. Distribution of tunnel strains from 135 tunnels that experienced squeezing and non-squeezing conditions.Fig 1. Table 2Squeezing classification by Hoek (2000).Table 2. NoSqueezing classificationStrain (%)1No Squeezing0–12Minor Squeezing1–2.53Severe Squeezing2.5–54Very Severe Squeezing5–105Extreme Squeezing10–100
Analytical calculation
3.1
The GRC calculation concept based on the Mohr-Coulomb failure criterion [10] was used to generate the reduction of internal pressure relative to in-situ stress (p_i_/p_o_) from elastic to plastic conditions at maximum displacement. Since p_i_/p_o_ = 1 represents the condition of the rock mass without disturbance (in-situ rock mass), the p_i_/p_o_ interval was generated from 0 to 0.9. In the same Excel file, p_i_/p_o_ from GRC calculations were classified into p_i_/p_o_ = 0, p_i_/p_o_ = 0.1, p_i_/p_o_ = 0.2, p_i_/p_o_ = 0.3, p_i_/p_o_ = 0.4, p_i_/p_o_ = 0.5, p_i_/p_o_ = 0.6, p_i_/p_o_ = 0.7, p_i_/p_o_ = 0.8, and p_i_/p_o_ = 0.9 for the specific strain (%ε) and stability factor (σ_cm_/p_o_) variables (Fig. 2) to (Fig. 11). The relationship between two variables can be observed through the correlation coefficient for each p_i_/p_o_, which was plotted in a power regression graph. It is evident that the relationship between the variables falls within the strong category (0.78–0.87), indicating that the p_i_/p_o_ exponential graph in relation to strain (%ε) and the stability factor (σ_cm_/p_o_) is reliable for use [Table 3] (Fig. 3, Fig. 4, Fig. 5, Fig. 6, Fig. 7, Fig. 8, Fig. 9, Fig. 10).Fig. 2. Regression of stability factor vs. strain for p_i_/p_o_ = 0.Fig 2. Table 3Strain GRC exponential equation.Table 3p_i_/p_o_EquationEquation No0 (1)0.1 (2)0.2 (3)0.3 (4)0.4 (5)0.5 (6)0.6 (7)0.7 (8)0.8 (9)0.9 (10)Fig. 3. Regression of stability factor vs. strain for p_i_/p_o_ = 0.1.Fig 3. Fig. 4Regression of stability factor vs. strain for p_i_/p_o_ = 0.2.Fig 4. Fig. 5Regression of stability factor vs. strain for p_i_/p_o_ = 0.3.Fig 5. Fig. 6Regression of stability factor vs. strain for p_i_/p_o_ = 0.4.Fig 6. Fig. 7Regression of stability factor vs. strain for p_i_/p_o_ = 0.5.Fig 7. Fig. 8Regression of stability factor vs. strain for p_i_/p_o_ = 0.6.Fig 8. Fig. 9Regression of stability factor vs. strain for p_i_/p_o_ = 0.7.Fig 9. Fig. 10Regression of stability factor vs. strain for p_i_/p_o_ = 0.8.Fig 10. Fig. 11Regression of stability factor vs. strain for p_i_/p_o_ = 0.9.Fig 11
The 135 tunnel strain data are plotted on the exponential graph derived from GRC data (Fig. 12). As a graph representing the support effect, the tunnel strain data indicate that tunnels experiencing the squeezing phenomenon predominantly occur when p_i_/p_o_ < 0.1. Therefore, a minimum p_i_/p_o_ = 0.1 is required to prevent the occurrence of squeezing conditions.Fig. 12. The plot of 135 tunnel strains data points, along with p_i_/p_o_ lines derived from GRC.Fig 12
Limitations
The analysis was conducted using the ground reaction curve method, which is limited to 2D analysis under a hydrostatic condition, and the tunnel strain data consist mainly of tunnel construction in Asia, with a few points from Europe.
Ethics Statement
The authors have read and followed the ethical requirements for publication in Data in Brief and confirm that the current work does not involve human subjects, animal experiments, or any data collected from social media platforms.
CRediT Author Statement
Ferlien Margareth Mareyke Mombilia: Conceptualization, Methodology, Calculation, Writing – Original draft; Simon Heru Prassetyo: Conceptualization, Methodology, Supervision, Writing – Review and Editing; Yudhidya Wicaksana: Supervision, Methodology, Data Curation; Ridho Kresna Wattimena: Supervision, Validation Data, Review; Anatasya Claresta: Collecting Data, Review and Editing
Acknowledgments
The authors acknowledge funding from the ITB Excellent Research Program 2024, grant number 959/IT1.B07.1/TA.00/2024.
Declaration of Competing Interest
The authors declare that they have no known competing financial interests or personal relationships that could have appeared to influence the work reported in this paper.
The reference list from the paper itself. Each links out to its DOI / PubMed record.
- 1Barla G.Tunnelling in squeezing rock condition Proceedings of ROCKSITE-99 India 1999
- 2Dehkordi M.S.Shahriar K.Moarefvand P.Gharouninik M.Application of the strain energy to estimate the rock load in non-squeezing ground condition Arch. Min. Sci.562011551566
- 3Dwivedi R.D.Singh M.Prediction of tunnel deformation in squeezing grounds Eng. Geol.16120135564
- 4Hoek E.Big tunnels in bad rock J. Geotech. Geoenviron. Eng.12792001726740
- 5Mhanna M.Hussein H.H.Analysis of squeezing-induced failure in a water tunnel and measure of rehabilitation: a case study of Tishreen Tunnel, Syria Deep Undergr. Sci. Eng.20242024113
- 6Sharma S.Muthreja I.L.Yerpude R.R.Application and comparison of squeezing estimation methods for Himalayan tunnels Bull. Eng. Geol. Environ.792019205223
- 7Singh M.Singh B.Choudhari J.Critical strain and squeezing of rock mass in tunnels Tunn. Undergr. Space Technol.222006343350
- 8Singh B.Jethwa J.L.Dube A.K.Singh B.Correlation between observed support pressure and rock mass quality Tunn. Undergr. Space Technol.719925974