Self-Reported Resilience During the COVID-19 Pandemic
Oluwabunmi Ogungbe, Tianyou Wang, Pallavi P. Balte, Sarah E. Slone, Diane Meyer, Norrina Bai Allen, Russell G. Buhr, Jana A. Hirsch, Karen Hinckley Stukovsky, Anna Kucharska-Newton, Kelley Pettee Gabriel, Elizabeth A. Regan, Vanessa Xanthakis, Carmen R. Isasi, Gregory Talavera

TL;DR
This study found that self-reported resilience during the pandemic varied by race, ethnicity, and socioeconomic factors, with Black and Hispanic individuals showing higher resilience compared to White individuals.
Contribution
The study identifies racial and ethnic disparities in resilience and links them to sociodemographic and structural factors during the pandemic.
Findings
Black and Hispanic participants had higher resilience compared to White participants.
American Indian and East Asian participants had lower resilience compared to White participants.
Higher education, income, and private insurance were associated with greater resilience.
Abstract
What factors are associated with self-reported resilience during the COVID-19 pandemic across racial and ethnic groups in a US cohort? In this cross-sectional study of 31 045 participants from 14 US prospective cohorts, 74.4% of participants self-reported resilience. Black and Hispanic participants had statistically significantly higher prevalence ratios of resilience compared with White participants, while American Indian and East Asian participants had lower prevalence ratios (10% and 24%); higher education, being married, higher income, and private insurance were associated with greater resilience. These findings suggest that resilience is shaped by individual and structural factors, and these findings can guide targeted interventions for future public health crises. This cross-sectional study examines factors associated with self-reported resilience during the COVID-19 pandemic…
Genes, proteins, chemicals, diseases, species, mutations and cell lines named across the full text — each resolved to its canonical identifier and authoritative record.
Click any figure to enlarge with its caption.
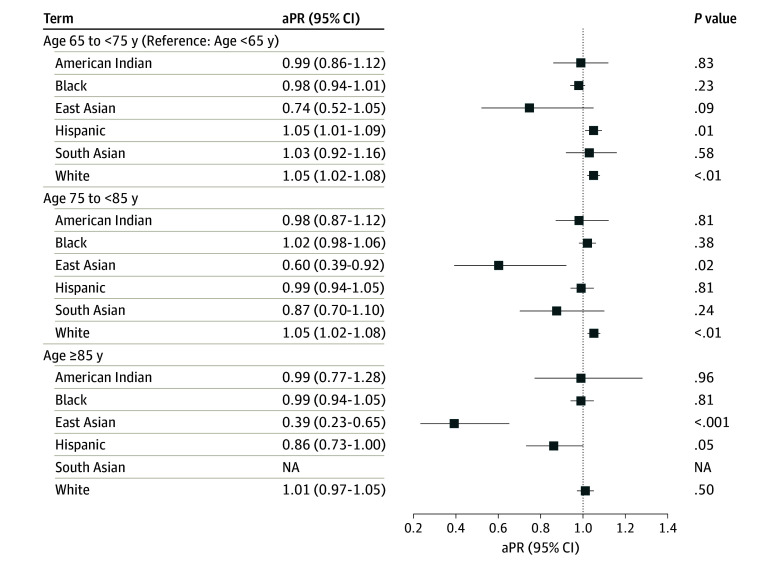 Figure 1
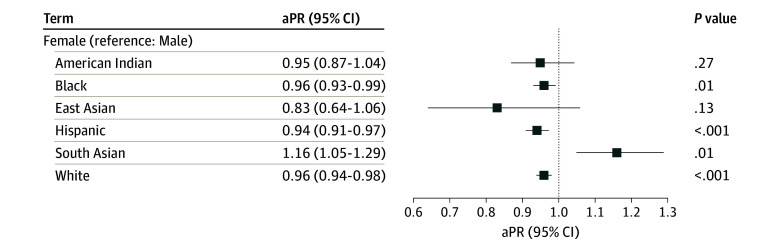 Figure 2
| Characteristic | Participants, No. (%) | |||||||
|---|---|---|---|---|---|---|---|---|
| American Indian (n = 1185 [3.8%]) | Black (n = 6724 [21.7%]) | East Asian (n = 293 [0.9%]) | Hispanic (n = 6307 [20.3%]) | South Asian (n = 565 [1.8%]) | White (n = 15 933 [51.3%]) | Other (n = 38 [0.1%]) | Total (N = 31 045 [100%]) | |
| Resilience | ||||||||
| Disagree | 394 (33.2) | 1599 (23.8) | 132 (45.1) | 1556 (24.7) | 138 (24.4) | 4110 (25.8) | 13 (34.2) | 7942 (25.6) |
| Agree | 791 (66.8) | 5125 (76.2) | 161 (54.9) | 4751 (75.3) | 427 (75.6) | 11823 (74.2) | 25 (65.8) | 23 103 (74.4) |
| Sex | ||||||||
| Female | 804 (67.8) | 4399 (65.4) | 155 (52.9) | 4060 (64.4) | 322 (57.0) | 8915 (56.0) | 17 (44.7) | 18 672 (60.1) |
| Male | 381 (32.2) | 2325 (34.6) | 138 (47.1) | 2247 (35.6) | 243 (43.0) | 7016 (44.0) | 21 (55.3) | 12 371 (39.8) |
| Missing | 0 | 0 | 0 | 0 | 0 | 2 (<0.1) | 0 | 2 (<0.1) |
| Age, y | ||||||||
| <65 | 630 (53.2) | 2045 (30.4) | 15 (5.1) | 3805 (60.3) | 325 (57.5) | 3909 (24.5) | 17 (44.7) | 10 746 (34.6) |
| 65-74 | 177 (14.9) | 2021 (30.1) | 133 (45.4) | 1552 (24.6) | 170 (30.1) | 4189 (26.3) | 8 (21.1) | 8250 (26.6) |
| 75-84 | 226 (19.1) | 1958 (29.1) | 95 (32.4) | 796 (12.6) | 70 (12.4) | 5542 (34.8) | 11 (28.9) | 8698 (28.0) |
| ≥85 | 43 (3.6) | 685 (10.2) | 50 (17.1) | 154 (2.4) | 0 | 2270 (14.2) | 2 (5.3) | 3204 (10.3) |
| Missing | 109 (9.2) | 15 (0.2) | 0 | 0 | 0 | 23 (0.1) | 0 | 147 (0.5) |
| BMI | ||||||||
| <18.5 | 7 (0.6) | 41 (0.6) | 7 (2.4) | 37 (0.6) | 1 (0.2) | 145 (0.9) | 0 | 238 (0.8) |
| 18.5-24.9 | 157 (13.2) | 981 (14.6) | 177 (60.4) | 1036 (16.4) | 222 (39.3) | 4412 (27.7) | 18 (47.4) | 7003 (22.6) |
| 25.0-29.9 | 351 (29.6) | 2133 (31.7) | 94 (32.1) | 2494 (39.5) | 251 (44.4) | 5977 (37.5) | 11 (28.9) | 11 311 (36.4) |
| 30.0-39.9 | 500 (42.2) | 2821 (42.0) | 15 (5.1) | 2393 (37.9) | 86 (15.2) | 4289 (26.9) | 8 (21.1) | 10 112 (32.6) |
| ≥40.0 | 169 (14.3) | 739 (11.0) | 0 | 343 (5.4) | 5 (0.9) | 608 (3.8) | 0 | 1864 (6.0) |
| Missing | 1 (0.1) | 9 (0.1) | 0 | 4 (0.1) | 0 | 502 (3.2) | 1 (2.6) | 517 (1.7) |
| Smoking status | ||||||||
| Never | 459 (38.7) | 3477 (51.7) | 215 (73.4) | 3830 (60.7) | 459 (81.2) | 7094 (44.5) | 23 (60.5) | 15 557 (50.1) |
| Former | 296 (25.0) | 2134 (31.7) | 72 (24.6) | 1578 (25.0) | 93 (16.5) | 7368 (46.2) | 6 (15.8) | 11 547 (37.2) |
| Current | 427 (36.0) | 1050 (15.6) | 6 (2.0) | 873 (13.8) | 13 (2.3) | 1428 (9.0) | 2 (5.3) | 3799 (12.2) |
| Missing | 3 (0.3) | 63 (0.9) | 0 | 26 (0.4) | 0 | 43 (0.3) | 7 (18.4) | 142 (0.5) |
| Diabetes | ||||||||
| No | 740 (62.4) | 4763 (70.8) | 227 (77.5) | 4777 (75.7) | 276 (48.8) | 13256 (83.2) | 29 (76.3) | 24 068 (77.5) |
| Yes | 442 (37.3) | 1932 (28.7) | 66 (22.5) | 1530 (24.3) | 289 (51.2) | 2467 (15.5) | 9 (23.7) | 6735 (21.7) |
| Missing | 3 (0.3) | 29 (0.4) | 0 | 0 | 0 | 210 (1.3) | 0 | 242 (0.8) |
| Hypertension | ||||||||
| No | 474 (40.0) | 1642 (24.4) | 122 (41.6) | 3044 (48.3) | 306 (54.2) | 6409 (40.2) | 22 (57.9) | 12 019 (38.7) |
| Yes | 711 (60.0) | 5081 (75.6) | 171 (58.4) | 3263 (51.7) | 259 (45.8) | 9395 (59.0) | 16 (42.1) | 18 896 (60.9) |
| Missing | 0 | 1 (<0.1) | 0 | 0 | 0 | 129 (0.8) | 0 | 130 (0.4) |
| Vaccine status at completion of C4R survey | ||||||||
| No | 226 (19.1) | 637 (9.5) | 22 (7.5) | 1047 (16.6) | 181 (32.0) | 2486 (15.6) | 11 (28.9) | 4610 (14.8) |
| Yes | 900 (75.9) | 5784 (86.0) | 264 (90.1) | 5161 (81.8) | 383 (67.8) | 13239 (83.1) | 26 (68.4) | 25 757 (83.0) |
| Missing | 59 (5.0) | 303 (4.5) | 7 (2.4) | 99 (1.6) | 1 (0.2) | 208 (1.3) | 1 (2.6) | 678 (2.2) |
| Infection status at completion of C4R survey | ||||||||
| No | 724 (61.1) | 6025 (89.6) | 282 (96.2) | 4350 (69.0) | 534 (94.5) | 14 254 (89.5) | 31 (81.6) | 26 200 (84.4) |
| Yes | 461 (38.9) | 682 (10.1) | 11 (3.8) | 1956 (31.0) | 31 (5.5) | 1640 (10.3) | 6 (15.8) | 4787 (15.4) |
| Missing | 0 | 17 (0.3) | 0 | 1 | 0 | 39 (0.2) | 1 (2.6) | 58 (0.2) |
| Education | ||||||||
| <High school | 157 (13.2) | 685 (10.2) | 65 (22.2) | 2275 (36.1) | 6 (1.1) | 522 (3.3) | 1 (2.6) | 3711 (12.0) |
| High school | 514 (43.4) | 1669 (24.8) | 42 (14.3) | 1533 (24.3) | 16 (2.8) | 2919 (18.3) | 3 (7.9) | 6696 (21.6) |
| Some college | 291 (24.6) | 1467 (21.8) | 59 (20.1) | 958 (15.2) | 27 (4.8) | 3103 (19.5) | 5 (13.2) | 5910 (19.0) |
| ≥College | 208 (17.6) | 2790 (41.5) | 127 (43.3) | 1503 (23.8) | 516 (91.3) | 8530 (53.5) | 23 (60.5) | 13 697 (44.1) |
| Missing | 15 (1.3) | 113 (1.7) | 0 | 38 (0.6) | 0 | 859 (5.4) | 6 (15.8) | 1031 (3.3) |
| Marital status | ||||||||
| Single | 264 (22.3) | 750 (11.2) | 4 (1.4) | 1374 (21.8) | 8 (1.4) | 1190 (7.5) | 4 (10.5) | 3594 (11.6) |
| Married or living as married | 601 (50.7) | 3122 (46.4) | 241 (82.3) | 3427 (54.3) | 525 (92.9) | 10172 (63.8) | 23 (60.5) | 18 111 (58.3) |
| Widowed | 74 (6.2) | 792 (11.8) | 32 (10.9) | 85 (1.3) | 20 (3.5) | 1264 (7.9) | 0 | 2267 (7.3) |
| Divorced or separated | 232 (19.6) | 1415 (21.0) | 16 (5.5) | 1393 (22.1) | 12 (2.1) | 1652 (10.4) | 6 (15.8) | 4726 (15.2) |
| Missing | 14 (1.2) | 645 (9.6) | 0 | 28 (0.4) | 0 | 1655 (10.4) | 5 (13.2) | 2347 (7.6) |
| Employment status | ||||||||
| Employed | 256 (21.6) | 3923 (58.3) | 117 (39.9) | 2969 (47.1) | 416 (73.6) | 7976 (50.1) | 25 (65.8) | 15 682 (50.5) |
| Other than employed | 100 (8.4) | 2666 (39.6) | 176 (60.1) | 3303 (52.4) | 141 (25.0) | 7360 (46.2) | 8 (21.1) | 13 754 (44.3) |
| Missing | 829 (70.0) | 135 (2.0) | 0 | 35 (0.6) | 8 (1.4) | 597 (3.7) | 5 (13.2) | 1609 (5.2) |
| Health insurance | ||||||||
| No insurance | 103 (8.7) | 427 (6.4) | 7 (2.4) | 1525 (24.2) | 33 (5.8) | 277 (1.7) | 5 (13.2) | 2377 (7.7) |
| Private insurance only | 134 (11.3) | 1965 (29.2) | 75 (25.6) | 291 (4.6) | 442 (78.2) | 4258 (26.7) | 16 (42.1) | 7181 (23.1) |
| Public insurance only | 37 (3.1) | 599 (8.9) | 107 (36.5) | 299 (4.7) | 48 (8.5) | 770 (4.8) | 5 (13.2) | 1865 (6.0) |
| Private and public insurance | 18 (1.5) | 351 (5.2) | 98 (33.4) | 186 (2.9) | 37 (6.5) | 1016 (6.4) | 1 (2.6) | 1707 (5.5) |
| Unknown insurance type | 23 (1.9) | 2999 (44.6) | 6 (2.0) | 3981 (63.1) | 0 | 7985 (50.1) | 7 (18.4) | 15 001 (48.3) |
| Missing | 870 (73.4) | 383 (5.7) | 0 | 25 (0.4) | 5 (0.9) | 1627 (10.2) | 4 (10.5) | 2914 (9.4) |
| Household income, $ | ||||||||
| <50 000 | 761 (64.2) | 3376 (50.2) | 188 (64.2) | 4750 (75.3) | 51 (9.0) | 5044 (31.7) | 4 (10.5) | 14 174 (45.7) |
| 50 000-100 000 | 249 (21.0) | 1568 (23.3) | 58 (19.8) | 776 (12.3) | 65 (11.5) | 4074 (25.6) | 5 (13.2) | 6795 (21.9) |
| >100 000 | 48 (4.1) | 1097 (16.3) | 47 (16.0) | 216 (3.4) | 435 (77.0) | 4298 (27.0) | 8 (21.1) | 6149 (19.8) |
| Missing | 127 (10.7) | 683 (10.2) | 0 | 565 (9.0) | 14 (2.5) | 2517 (15.8) | 21 (55.3) | 3927 (12.6) |
| Region | ||||||||
| Middle Atlantic | 8 (0.7) | 838 (12.5) | 3 (1.0) | 1649 (26.1) | 0 | 2254 (14.1) | 8 (21.1) | 4760 (15.3) |
| Midwest | 581 (49.0) | 652 (9.7) | 118 (40.3) | 995 (15.8) | 232 (41.1) | 3466 (21.8) | 0 | 6044 (19.5) |
| New England | 21 (1.8) | 90 (1.3) | 0 | 60 (1.0) | 0 | 2606 (16.4) | 17 (44.7) | 2794 (9.0) |
| South Asian | 2 (0.2) | 4365 (64.9) | 8 (2.7) | 1676 (26.6) | 0 | 5187 (32.6) | 2 (5.3) | 11240 (36.2) |
| Southwest | 566 (47.8) | 118 (1.8) | 4 (1.4) | 11 (0.2) | 0 | 430 (2.7) | 0 | 1129 (3.6) |
| West | 7 (0.6) | 603 (9.0) | 159 (54.3) | 1794 (28.4) | 333 (58.9) | 1561 (9.8) | 2 (5.3) | 4459 (14.4) |
| Missing | 0 | 58 (0.9) | 1 (0.3) | 122 (1.9) | 0 | 429 (2.7) | 9 (23.7) | 619 (2.0) |
| Characteristic | Participants, No. (%) | ||
|---|---|---|---|
| Response to “I tend to bounce back quickly after hard times” | Total | ||
| Agree or strongly agree | Neutral, disagree, or strongly disagree | ||
| Total | 23 102 (74.4) | 7941 (25.6) | 31 043 (100) |
| Race and ethnicity | |||
| American Indian | 791 (3.4) | 394 (5.0) | 1185 (3.8) |
| Black | 5128 (22.2) | 1600 (20.1) | 6728 (21.7) |
| East Asian | 161 (0.7) | 132 (1.7) | 293 (0.9) |
| Hispanic | 4753 (20.6) | 1558 (19.6) | 6311 (20.3) |
| South Asian | 427 (1.8) | 138 (1.7) | 565 (1.8) |
| White | 11 842 (51.3) | 4119 (51.9) | 15 961 (51.4) |
| Age group, y | |||
| <65 | 8084 (35.0) | 2744 (34.6) | 10 828 (34.9) |
| 65-74 | 6190 (26.8) | 2085 (26.3) | 8275 (26.7) |
| 75-84 | 6522 (28.2) | 2204 (27.8) | 8726 (28.1) |
| ≥85 | 2306 (10.0) | 907 (11.4) | 3213 (10.4) |
| Sex | |||
| Female | 13 591 (58.8) | 5081 (64.0) | 18 672 (60.1) |
| Male | 9511 (41.2) | 2860 (36.0) | 12 371 (39.9) |
| BMI | |||
| <18.5 | 176 (0.8) | 72 (0.9) | 248 (0.8) |
| 18.5-24.9 | 5223 (22.6) | 1945 (24.5) | 7168 (23.1) |
| 25.0-29.9 | 8688 (37.6) | 2790 (35.1) | 11 478 (37.0) |
| 30.0-39.9 | 7669 (33.2) | 2575 (32.4) | 10 244 (33.0) |
| ≥40.0 | 1346 (5.8) | 559 (7.0) | 1905 (6.1) |
| Smoking status | |||
| Never | 11 591 (50.2) | 4042 (50.9) | 15 633 (50.4) |
| Former | 8763 (37.9) | 2831 (35.7) | 11 594 (37.3) |
| Current | 2748 (11.9) | 1067 (13.4) | 3815 (12.3) |
| Diabetes | 4902 (21.2) | 1866 (23.5) | 6768 (21.8) |
| Hypertension | 14 028 (60.7) | 4914 (61.9) | 18 942 (61.0) |
| Vaccinated at completion of C4R survey | 19 616 (84.9) | 6713 (84.5) | 26 329 (84.8) |
| COVID-19 infection at completion of C4R survey | 3589 (15.5) | 1206 (15.2) | 4795 (15.4) |
| Education | |||
| <High school | 2655 (11.5) | 1161 (14.6) | 3816 (12.3) |
| High school | 5092 (22.0) | 1861 (23.4) | 6953 (22.4) |
| Some college | 4540 (19.7) | 1600 (20.1) | 6140 (19.8) |
| ≥College | 10 815 (46.8) | 3319 (41.8) | 14 134 (45.5) |
| Marital status | |||
| Single | 2890 (12.5) | 1106 (13.9) | 3996 (12.9) |
| Married or living as married | 14 628 (63.3) | 4764 (60.0) | 19 392 (62.5) |
| Widowed | 1821 (7.9) | 657 (8.3) | 2478 (8.0) |
| Divorced or separated | 3763 (16.3) | 1413 (17.8) | 5176 (16.7) |
| Employed | 12 889 (55.8) | 4018 (50.6) | 16 907 (54.5) |
| Health insurance | |||
| No insurance | 2208 (9.6) | 794 (10.0) | 3002 (9.7) |
| Private insurance only | 6084 (26.3) | 1808 (22.8) | 7892 (25.4) |
| Public insurance only | 1438 (6.2) | 644 (8.1) | 2082 (6.7) |
| Private and public insurances | 1322 (5.7) | 472 (5.9) | 1794 (5.8) |
| Unknown type of insurance | 12 050 (52.2) | 4223 (53.2) | 16 273 (52.4) |
| Household income, $ | |||
| <50 000 | 11 845 (51.3) | 4559 (57.4) | 16 404 (52.8) |
| 50 000-100 000 | 5804 (25.1) | 1841 (23.2) | 7645 (24.6) |
| >100 000 | 5453 (23.6) | 1541 (19.4) | 6994 (22.5) |
| Region | |||
| Middle Atlantic | 3577 (15.5) | 1275 (16.1) | 4852 (15.6) |
| Midwest | 4615 (20.0) | 1547 (19.5) | 6162 (19.8) |
| New England | 2057 (8.9) | 880 (11.1) | 2937 (9.5) |
| South | 8660 (37.5) | 2757 (34.7) | 11 417 (36.8) |
| Southwest | 829 (3.6) | 309 (3.9) | 1138 (3.7) |
| West | 3364 (14.6) | 1173 (14.8) | 4537 (14.6) |
| Study | |||
| ARIC | 3260 (14.1) | 849 (10.7) | 4109 (13.2) |
| CARDIA | 1353 (5.9) | 445 (5.6) | 1798 (5.8) |
| COPDGene | 1896 (8.2) | 472 (5.9) | 2368 (7.6) |
| FHS | 2209 (9.6) | 907 (11.4) | 3116 (10.0) |
| HCHS/SOL | 4161 (18.0) | 1205 (15.2) | 5366 (17.3) |
| JHS | 1250 (5.4) | 330 (4.2) | 1580 (5.1) |
| MASALA | 427 (1.8) | 138 (1.7) | 565 (1.8) |
| MESA | 1402 (6.1) | 507 (6.4) | 1909 (6.1) |
| NOMAS | 317 (1.4) | 297 (3.7) | 614 (2.0) |
| PrePF | 392 (1.7) | 133 (1.7) | 525 (1.7) |
| REGARDS | 5076 (22.0) | 2087 (26.3) | 7163 (23.1) |
| SARP | 168 (0.7) | 84 (1.1) | 252 (0.8) |
| SHS | 760 (3.3) | 379 (4.8) | 1139 (3.7) |
| SPIROMICS | 431 (1.9) | 108 (1.4) | 539 (1.7) |
| Variable | Model 1 | Model 2 | ||
|---|---|---|---|---|
| PR (95% CI) | PR (95% CI) | |||
| Race and ethnicity | ||||
| American Indian | 0.90 (0.87-0.94) | <.001 | 0.90 (0.86-0.94) | <.001 |
| Black | 1.03 (1.01-1.05) | <.001 | 1.04 (1.02-1.06) | <.001 |
| East Asian | 0.74 (0.67-0.82) | <.001 | 0.76 (0.68-0.84) | <.001 |
| Hispanic | 1.02 (1.00-1.03) | .09 | 1.08 (1.06-1.11) | <.001 |
| South Asian | 1.01 (0.97-1.06) | .57 | 0.96 (0.91-1.01) | .10 |
| White | 1 [Reference] | NA | 1 [Reference] | NA |
| Age group, y | ||||
| <64 | 1 [Reference] | NA | 1 [Reference] | NA |
| 65-74 | 1.00 (0.98-1.02) | .88 | 1.02 (1.00-1.04) | .08 |
| 75-84 | 1.00 (0.98-1.02) | .91 | 1.01 (0.99-1.04) | .21 |
| Age >85 | 0.96 (0.94-0.99) | .003 | 0.98 (0.95-1.01) | .13 |
| Sex | ||||
| Male | 1 [Reference] | NA | 1 [Reference] | NA |
| Female | 0.95 (0.93-0.96) | <.001 | 0.96 (0.95-0.97) | <.001 |
| BMI | ||||
| <18.5 | NA | NA | 0.99 (0.91-1.08) | .83 |
| 18.5-24.9 | 1 [Reference] | NA | 1 [Reference] | NA |
| 25.0-29.9 | NA | NA | 1.03 (1.01-1.05) | .003 |
| 30.0-39.9 | NA | NA | 1.02 (1.00-1.04) | .02 |
| ≥40.0 | NA | NA | 0.98 (0.95-1.01) | .19 |
| Smoking status | ||||
| Never | 1 [Reference] | NA | 1 [Reference] | NA |
| Former | NA | NA | 1.02 (1.01-1.04) | .002 |
| Current | NA | NA | 0.99 (0.97-1.01) | .48 |
| Diabetesa | NA | NA | 0.97 (0.96-0.99) | .002 |
| Hypertensiona | NA | NA | 0.99 (0.97-1.00) | .10 |
| Vaccinated at completion of C4R surveya | NA | NA | 0.99 (0.97-1.01) | .49 |
| COVID-19 infection at completion of C4R surveya | NA | NA | 1.01 (0.99-1.03) | .47 |
| Education | ||||
| <High school | NA | NA | 1 [Reference] | NA |
| High school | NA | NA | 1.07 (1.04-1.09) | <.001 |
| Some college | NA | NA | 1.07 (1.05-1.10) | <.001 |
| ≥College | NA | NA | 1.09 (1.07-1.12) | <.001 |
| Marital status | ||||
| Single | NA | NA | 0.97 (0.95-0.99) | .02 |
| Married or living as married | NA | NA | 1 [Reference] | NA |
| Widowed | NA | NA | 1.03 (1.00-1.06) | .03 |
| Divorced or separated | NA | NA | 0.98 (0.96-1.00) | .05 |
| Employment status | ||||
| Employed | NA | NA | 1 [Reference] | NA |
| Other than employed | NA | NA | 0.96 (0.94-0.97) | <.001 |
| Health insurance | ||||
| No insurance | NA | NA | 1.04 (1.00-1.08) | .08 |
| Public insurance only | NA | NA | 1 [Reference] | NA |
| Private insurance only | NA | NA | 1.07 (1.03-1.10) | <.001 |
| Private and public insurances | NA | NA | 1.05 (1.00-1.09) | .04 |
| Unknown type of insurance | NA | NA | 1.02 (0.99-1.06) | .20 |
| Income, $ | ||||
| <50 000 | NA | NA | 1 [Reference] | NA |
| 50 000-100 000 | NA | NA | 1.03 (1.01-1.04) | .01 |
| >100 000 | NA | NA | 1.05 (1.03-1.07) | <.001 |
| Region | ||||
| Middle Atlantic | NA | NA | 0.98 (0.96-1.01) | .18 |
| Midwest | NA | NA | 1 [Reference] | NA |
| New England | NA | NA | 0.90 (0.88-0.93) | <.001 |
| South | NA | NA | 0.99 (0.97-1.01) | .37 |
| Southwest | NA | NA | 1.03 (0.99-1.08) | .12 |
| West | NA | NA | 0.98 (0.96-1.01) | .15 |
Peer Reviews
No public reviews on file for this paper yet. If you reviewed it on a platform where reviews are public (OpenReview, ICLR, NeurIPS, ICML), you can paste yours below so the community can read it here.
Videos
No videos yet. Explain this paper in a talk, walkthrough, or lecture? Add one.
Taxonomy
TopicsResilience and Mental Health · Health disparities and outcomes · COVID-19 and Mental Health
Introduction
Resilience, defined as overcoming adversity or bouncing back from hardship, is linked to health and well-being.^1,2,3^ Acute and chronic stress can accelerate biological aging and chronic disease risk through inflammatory, metabolic, and behavioral pathways.^4,5^ Resilience capabilities that mitigate distress severity, support stress recovery, and promote wellness behaviors may influence such downstream effects.^6,7,8^ For example, higher resilience has been associated with reduced hypertension risk over 10 years in middle-aged adults.^9,10,11^ Psychosocial resilience may be a promising target for improving stress-related health outcomes.^12^
The COVID-19 pandemic came with prolonged, widespread hardship spanning health, economic, and social spheres.^13,14,15^ Whereas qualitative studies have explored individual experiences of resilience during the pandemic,^16^ quantitative indicators of coping capacity and resilience manifestations remain underexplored. The impact of the COVID-19 pandemic has been particularly severe among racial and ethnic groups disproportionately affected by systemic inequities, who faced greater burdens of chronic diseases, social strain, and limited public health resources. Consequently, these populations have experienced disproportionately higher rates of COVID-19 infection, hospitalization, and mortality.^17^ Disparities are rooted in longstanding systemic inequities, including unequal access to health care, higher rates of underlying health conditions, and socioeconomic disadvantages, such as employment in essential worker positions and crowded living conditions.^18,19^ Such disparities may influence resilience in complex ways: while the added burden of pandemic-related stressors and social strain could diminish resilience, histories of overcoming adversity and strong community ties might instead foster it.^20^ Understanding these dynamics is crucial for developing focused interventions, strengthening support systems, and guiding resource allocation during future disaster events.
Previous research on resilience has shown inconsistent patterns across demographic groups, with findings varying by measurement approaches and contextual factors. Some studies suggest that socioeconomically disadvantaged groups demonstrate greater resilience despite facing greater adversities,^21^ while others report lower resilience using different measurement tools.^22^ These mixed findings likely reflect both methodological differences and the complex interplay between individual capacities and structural resources. While previous studies on resilience have predominantly focused on clinical populations with chronic illness or mental health conditions, our study examines resilience in a large, population-based sample across multiple US regions, representing one of the most extensive racially and ethnically diverse assessments of resilience during the COVID-19 pandemic in the US. Resilience may also manifest differently across life stages and cultural contexts, highlighting the need to consider both individual and social determinants.^23^ Additionally, measuring resilience presents challenges due to its complex nature. Researchers have conceptualized resilience diversely—as a personality trait, a dynamic process, or a socioecological phenomenon—leading to varied assessment approaches.^24^ In this study, we specifically focus on the bounce-back dimension of resilience, ie, the self-perceived ability to recover from adversity, which represents the core element of resilience as conceptualized by the Brief Resilience Scale (BRS).
We used data from 14 US prospective cohorts participating in the Cohort of Cohorts for COVID-19 Research (C4R) to assess correlates of self-reported resilience during the COVID-19 pandemic. To inform future resource allocation and support during crisis, we examined differences in resilience and its associated factors across major racial and ethnic groups.
Methods
Study Sample
This cross-sectional study leveraged data from the C4R study, which includes 14 established US prospective cohort studies^25^ initially designed to study cardiovascular, pulmonary, and neurological health: Atherosclerosis Risk in Communities,^26,27^ Coronary Artery Risk Development in Young Adults,^28^ Genetic Epidemiology of COPD,^29^ Framingham Heart Study,^30^ Hispanic Community Health Study/Study of Latinos,^31,32^ Jackson Heart Study,^33,34^ Mediators of Atherosclerosis in South Asians Living in America,^35^ Multi-Ethnic Study of Atherosclerosis,^36^ Northern Manhattan Study,^37^ Prevent Pulmonary Fibrosis,^38^ Reasons for Geographic and Racial Differences in Stroke,^39^ Severe Asthma Research Program,^40^ Subpopulations and Intermediate Outcome Measures in COPD Study,^41^ and the Strong Heart Study.^42,43^ The study was approved by cohort-specific institutional review boards as well as the Columbia University institutional review board. Participants provided informed consent for COVID-19–related follow-up activities according to cohort-specific procedures, including verbal, remote, and written informed consent. Data access was governed by an Analysis Commons model to facilitate data sharing while maintaining confidentiality and aligning with cohort-specific data use agreements.^25^ This report includes participants who responded to the resilience question on C4R questionnaires completed between January 2021 and February 2023 (eFigure 1 in Supplement 1). This study follows the Strengthening the Reporting of Observational Studies in Epidemiology (STROBE) reporting guideline for cross-sectional studies. Details on each included cohort are provided in the eMethods in Supplement 1.
Outcome
The primary outcome was self-reported resilience during the COVID-19 pandemic, assessed via a single item from the BRS: “I tend to bounce back quickly after hard times.”^44^ Although the BRS is a standardized 6-item questionnaire, only 1 item was included in the C4R survey to ensure consistent, efficient data collection across cohorts and to minimize participant burden. Previous research supports the validity of shortened resilience measures. For example, Vaishnavi et al^45^ found that a 2-item version of the Connor-Davidson Resilience Scale correlated strongly with the full scale (r = 0.78; P < .001), suggesting that carefully selected items for practical purposes may effectively represent the broader construct of resilience.^45^ For this study, participants rated their agreement on a 5-point scale. Responses were dichotomized as resilient (agree or strongly agree) or not resilient (neutral, disagree, or strongly disagree).^46^
Exposures
Factors considered potentially associated with resilience were race and ethnicity, demographic variables, clinical and behavioral factors, and social determinants of health. Race and ethnicity were self-reported using US 2000 census^47^ categories: Hispanic, non-Hispanic Asian (further divided into East Asian and South Asian), non-Hispanic American Indian (hereafter, American Indian), non-Hispanic Black (hereafter, Black), and non-Hispanic White (hereafter, White).^25^ Region (Midwest, Middle Atlantic, New England, South, Southwest, or West) was also included. Demographic variables included sex and age at C4R survey completion. Finer stratifications of age (<45, 45-54, 55-64, 65-74, 75-84, or ≥85 years) was initially explored, but no significant differences were found. Thus, age was grouped as younger than 65 years, 65 to 74 years, 75 to 84 years, and 85 years or older for final analyses (eTable 1 in Supplement 1). Clinical and behavioral factors were assessed at the most recent prepandemic examination, including body mass index (BMI), smoking status (never, former, or current), hypertension (self-reported blood pressure reading of ≥140/90 mm Hg or use of antihypertensive medications), diabetes (self-reported fasting blood glucose ≥126 mg/dL [to convert to millimoles per liter, multiply by 0.0555] or use of hypoglycemic medications), COVID-19 vaccination status at C4R survey completion, and self-reported COVID-19 infection status at C4R survey completion. Social determinants of health assessed prior to the pandemic included educational attainment (<high school, high school, some college, or college graduate), marital status (single, married or living as married, widowed, divorced, or separated), employment status (employed or other than employed), health insurance (private insurance only [eg, employer-provided or individually purchased plans], public insurance only [eg, Medicare or Medicaid], both private and public insurance, no insurance, or unknown insurance type [reported having insurance but the specific type was not identified]), and consumer price index–adjusted annual household income (<50 000-100 000, or >$100 000).
Statistical Analysis
Associations of self-reported resilience with potential correlates were examined using modified Poisson regression models. This approach was chosen to directly estimate prevalence ratios (PRs), which are more appropriate for common outcomes in cross-sectional studies. A minimally adjusted model included race and ethnicity, age, and sex. The fully adjusted model incorporated BMI, smoking status, hypertension, diabetes, COVID-19 vaccination status at questionnaire completion, infection status at questionnaire completion, region, and social determinants of health (education, marital status, employment status, health insurance, and income). Association modification by race and ethnicity was tested via multiplicative interaction terms and fully stratified models.
Missing data were minimal for most variables (<5%), with the exception of marital status (7.6%), household income (12.6%), and insurance status (9.4%) (Table 1). To account for missing covariate data, multiple imputation was implemented using the Multiple Imputation by Chained Equations (MICE)^48^ package in R software version 4.2.0 (R Project for Statistical Computing).^48^ Analyses were first conducted independently in 10 imputed datasets, then pooled using the PROC MIANALYZE procedure in SAS software version 9.4 (SAS Institute) under Rubin Rule.^49^ Complete-case analyses were included as secondary analyses. The timing of socioeconomic variable collection varied across cohorts, with some measures collected years before resilience assessment. To address potential bias from this temporal discordance, we conducted additional sensitivity analyses adjusting for the time between covariate measurement and resilience assessment. Time-to-measurement variables (in years) for marital status, employment status, insurance, and income were included in models, along with interactions terms to test whether associations with resilience varied by the timing of socioeconomic variable measurement.
All analyses were conducted using SAS software. Statistical significance was defined as a 2-tailed α = .05. Data were initially analyzed from October 2023 to May 2024, with updated analyses performed from August 2024 to April 2025.
Results
Participant characteristics are provided in Table 1 by self-reported race and ethnicity and in Table 2 by self-reported resilience. Of 31 043 participants in the imputed dataset, 10 828 (34.9%) were younger than 65 years, 18 672 (60.1%) were female, and 23 102 (74.4%) were classified as resilient. In the imputed sample, 1185 participants (3.8%) were American Indian, 6728 participants (21.7%) were Black, 6311 participants (20.3%) were Hispanic, 293 participants (0.9%) were East Asian, and 565 participants (1.8%) were South Asian, and 15 961 participants (51.4%) were White. The prevalence of self-reported resilience differed significantly across racial and ethnic groups, ranging from 76.2% for Black participants to 54.9% for East Asian participants (P < .001) (Table 1). Differences in self-reported resilience were also observed across BMI category, smoking status, hypertension, diabetes, COVID-19 vaccination status, COVID-19 infection status, education, marital status, employment status, health insurance, and income level (Table 2).
Factors Associated With Self-Reported Resilience
Factors associated with resilience are presented in Table 3. In the fully adjusted model and compared with White participants, American Indian participants had 10% lower prevalence of self-reported resilience (aPR, 0.90; 95% CI, 0.86-0.94), Black participants had 4% higher prevalence (aPR, 1.04; 95% CI, 1.02-1.06), Hispanic participants had 8% higher prevalence (aPR, 1.08; 95% CI, 1.06-1.11), and East Asian participants had 24% lower prevalence (aPR, 0.76; 95% CI, 0.68-0.84).
Higher prevalences of resilience were observed in participants with a high school degree (aPR, 1.07; 95% CI, 1.04-1.09), some college (aPR, 1.07; 95% CI, 1.05-1.10), or a college degree (aPR, 1.09; 95% CI, 1.07-1.12), compared with those with less than a high school education. Single participants reported lower prevalence of resilience compared with married or living as married participants (aPR, 0.97; 95% CI, 0.95-0.99). Not being employed was associated with lower prevalence of resilience (aPR, 0.96; 95% CI, 0.94-0.97).
Compared with participants with public insurance only, participants with private insurance only reported 7% higher prevalence of resilience (aPR, 1.07; 95% CI, 1.03-1.10). Compared with participants earning less than 50 000 to 100 000 annually (aPR, 1.05; 95% CI, 1.03-1.07) had higher prevalence of resilience. Regional differences in self-reported resilience were observed. Compared with the Midwest region, participants from New England reported 10% lower prevalence of resilience (aPR, 0.90; 95% CI, 0.88-0.93).
Analyses Stratified by Race and Ethnicity
Results were similar in models stratified by race and ethnicity, although there was evidence to suggest association modification for several factors. A significant interaction observed between race and ethnicity and age (P for interaction < .001) indicated that age-related patterns of resilience differed by groups (Figure 1). East Asian participants demonstrated a notable decline in resilience with age, with lower resilience among those aged 75 to 84 years (aPR, 0.60; 95% CI, 0.39-0.92) and 85 years or older (aPR, 0.39; 95% CI, 0.23-0.65) compared with those younger than 65 years. In contrast, no similar age-related decline were observed in American Indian, Black, or White participants. In fact, resilience were slightly higher among Black (aPR, 1.05; 95% CI, 1.01-1.09) and White (aPR, 1.05; 95% CI, 1.02-1.08) participants aged 75 to 84 years. Compared with males, females reported lower prevalence of resilience among Black (aPR, 0.96; 95% CI, 0.93-0.99), Hispanic (aPR, 0.94; 95% CI, 0.91-0.97), and White (aPR, 0.96; 95% CI, 0.94-0.98) participants and higher prevalence of resilience among South Asian participants (aPR, 1.16; 95% CI, 1.05-1.29) (P for interaction = .02) (Figure 2). Hypertension was associated with lower resilience in Hispanic participants only (aPR, 0.95; 95% CI, 0.92-0.98; P for interaction < .001) (eFigure 2 in Supplement 1). Regional variation was significant (P for interaction < .001). Compared with the Midwest, while Hispanic individuals in the South and West had higher resilience, while White participants in these regions had lower resilience. American Indian participants in the South demonstrated significantly greater resilience (eFigure 3 in Supplement 1).
Associations of Age Groups With Self-Reported Resilience by Race and Ethnicity
Associations of Sex With Self-Reported Resilience by Race and Ethnicity
Health insurance modified associations with resilience (P for modification < .001) (eFigure 4 in Supplement 1). Among Hispanic participants, no insurance was associated with higher prevalence of resilience (aPR, 1.24; 95% CI, 1.11-1.39), while opposite associations were seen in other racial and ethnical groups. BMI also was associated with resilience (eFigure 5 in Supplement 1). Notably, obesity was associated with lower resilience among American Indian participants (aPR, 0.86; 95% CI, 0.77-0.96;) but higher resilience among White participants (aPR, 1.04; 95% CI, 1.01-1.07). Diabetes interacted significantly with race and ethnicity (P for interaction = .03), with American Indian participants showing the strongest negative association (aPR, 0.91; 95% CI, 0.82-0.99) (eFigure 6 in Supplement 1). Furthermore, marital status was only significant among Black participants, among whom single participants had lower prevalence of resilience (aPR, 0.92; 95% CI, 0.88-0.97; P = .01) (eFigure 7 in Supplement 1). No significant interactions were observed for education, income, smoking status, COVID-19 vaccination status, or infection status.
Complete Case and Sensitivity Analyses
Participant characteristics for complete cases were similar to the primary (imputed) analysis sample (eTable 2 in Supplement 1). Sensitivity analyses comparing complete case analysis for 23 154 participants with our multiple imputation approach showed consistent patterns of association (eTable 3 and eFigure 8 in Supplement 1). In sensitivity analyses adjusting for the time between covariate measurement and resilience assessment, patterns of association remained largely consistent. While the time-to-income variables were statistically significant, their effect sizes were minimal. None of the interactions between time-to-measurement variables and social determinants of health variables reached statistical significance (eTable 4 in Supplement 1).
Discussion
In this cross-sectional study of a nationwide meta-cohort of US adults, self-reported resilience was remarkably high but differed by sociodemographic and clinical factors. Greater self-reported resilience was observed among Black and Hispanic participants, individuals with higher education, married individuals, and individuals with higher income, whereas being female or unemployed was associated with lower resilience.
These findings should be interpreted in the context of the COVID-19 pandemic, which created an unprecedented global crisis that intensified existing social, economic, and health disparities.^50^ The strain on health care systems, widespread job losses, and disruptions to daily life likely had profound impacts on individuals’ perception of their ability to cope with and bounce back from adversity.^14,51,52^ In this context, the observed differences in self-reported resilience show a complex interplay between systemic inequities and adaptations.^53,54^ For example, the lower prevalence of resilience among East Asian participants may relate to increased discrimination and stigma during the pandemic.^55^ Similarly, lower resilience among persons with lower education and income may reflect disproportionate economic hardship and limited resource access.^56,57^
The high prevalence of self-reported resilience among Black and Hispanic participants, despite the well-documented health and social inequities faced by these communities,^58^ may indicate the complex nature of resilience. This finding, in particular, shows the importance of considering resilience as a dynamic process shaped by the interaction between individuals and their environment.^59,60^ Resilience in marginalized populations reflects collective strengths, resources, and coping strategies developed in response to historical and ongoing adversity.^61,62^ These collective strengths, such as strong community networks, religious engagement and spirituality, extended family systems, and cultural practices, may foster resilience. Recognizing and building on theses community-level assets is essential, alongside addressing structural inequities.
Our findings align with previous research that used multi-item resilience measures and similarly found positive associations of resilience with education, income, and social support.^11,63,64^ Our study extends this knowledge, examining resilience specifically during the COVID-19 pandemic across a large cohort spanning multiple US regions. Research during the pandemic has found varied responses, with some populations showing significant psychological distress while others demonstrated remarkable adaptability despite ongoing stressors.^11^ Our findings contribute to this emerging literature by identifying specific factors associated with resilience during crisis that can inform targeted interventions for vulnerable groups in future public health emergencies. The persistent racial and ethnic differences in self-reported resilience after adjustment shows the need to identify and address unique challenges and resources that shape resilience in various populations, potentially leading to more effective interventions and policies. Other factors, such as varied interpretations of resilience across cultures, community contexts, and life-course experiences, also influence individuals’ ability to cope with adversity.^65,66^
Resilience is complex and has been defined and operationalized in various ways. It is often described as the ability to bounce back or recover from adversity, stress, or trauma.^1,59^ However, there is ongoing debate about the precise definition and measurement of resilience. Some researchers conceptualize resilience as a trait; others view it as a dynamic and evolving process.^67,68,69^ Findings of this study suggest resilience may not be solely an individual trait but, rather, a product of the complex interplay among individuals, their environment, and their current sociopolitical context, in this case, during the COVID-19 pandemic. The temporal nature of resilience development remains unclear, such as whether it responds rapidly to events like the pandemic or evolves more slowly over time.
Although reports of resilience in this study may reflect individuals’ ability to cope with and adapt to the pandemic, resilience levels and associated factors could differ in other contexts or noncrisis times. Resilience could also be conceptualized as healthy vs unhealthy resilience. Healthy resilience promotes overall well-being and growth, whereas unhealthy resilience relies on short-term coping mechanisms that ultimately may have detrimental effects on mental and physical health.^70,71^ Understanding this distinction requires consideration of both immediate coping ability and long-term outcomes. Our cross-sectional design, based on a single assessment during the pandemic, limits the ability to distinguish between short-term temporary coping and more enduring resilience processes that support long-term well-being.
Modification analyses revealed important nuances across racial and ethnic groups. Hypertension was associated with lower resilience only among Hispanic participants, suggesting possible cultural differences in how chronic conditions impact resilience. Similarly, while private insurance was associated with more resilience among most groups, patterns differed among Hispanic participants, pointing to potential differences in how health system engagement influences resilience across cultural contexts. These interactions demonstrate that resilience resources and vulnerabilities are not uniform across populations; therefore, culturally tailored approaches are needed to support resilience during crisis situations.
The findings of this study have important implications for interventions and policies aimed at promoting resilience in future crises. Whereas most participants in our study reported being resilient during the pandemic, it is unclear whether this resilience was healthy or unhealthy. Distinguishing between these different types of resilience requires validated multidimensional measures and longitudinal studies that examine long-term outcomes. Notably, the development of resilience is not solely an individual responsibility, it is also influenced by the broader social, economic, and political contexts. While our focus on individual-level social determinants provides important insights, structural and community-level factors, such as neighborhood characteristics, community resources, institutional racism, and historical inequities, likely play substantial roles but were not directly measured in the study.
Nevertheless, the observed socioeconomic disparities in resilience show the associations of systemic inequities and underinvestment in communities with individuals’ capacity to cope with adversity. Therefore, efforts to promote resilience must address structural inequities and social determinants of health through policies that ensure equitable access to health care, education, and economic opportunities and interventions that build community-level resilience through social support, collective action, and advocacy.^72,73^ Although individual-level interventions, such as teaching coping skills and stress management techniques, are beneficial, a comprehensive approach that recognizes the complex interplay among individual, community, and societal factors is necessary to foster resilience and promote health equity.^60,73,74^ It is important to note that the higher resilience observed among Black and Hispanic participants may reflect unmeasured community supports, such as strong social networks, cultural practices, or community organizations, which warrant further understanding.
Therefore, efforts to promote resilience should address not only individual-level factors but also select social determinants of health that may constrain or enable resilience in different populations.^75^ Recognizing the social and economic underpinnings of resilience is essential for designing interventions that promote health equity.
Limitations
This study has several limitations. Although the sample was large and diverse, it was not nationally representative. Some additional factors related to resilience were not captured in this study, such as personality traits, coping strategies, and community-level factors. The cross-sectional design precludes causal inference and prevents assessment of pandemic-related changes in resilience. Timing of covariates measurements varied across cohorts, with some data collected years before the pandemic. However, sensitivity analyses adjusting for timing suggest this did not substantially bias our results.
A key limitation is our use of a single-item measure from the BRS.^44^ Although this allowed a snapshot of each participant’s perceived ability to bounce back from adversity and contributed to minimizing participant burden in the large-scale data collection across all 14 large cohorts during the pandemic, we recognize that although the BRS primarily measures a unidimensional construct focused on recovery from adversity,^44^ a single item may not capture all relevant aspects of this construct. Single-item measures have shown utility in large epidemiological studies where brevity is essential,^76^ and the specific item we used captured the core conceptual element of resilience—the ability to recover from adversity. While single-item measures typically demonstrate lower reliability compared with multi-item scales,^77^ our large sample size helps mitigate concerns about measurement error. The selected item directly captures the core theoretical concept of resilience as recovery from adversity, which is identified as the central construct measured by the BRS.^44,77^ Nevertheless, we acknowledge that our single-item approach may limit precision in measuring this important construct.
Furthermore, self-reported resilience introduces potential biases in how participants perceive and report their ability to bounce back from adversity. Cultural differences in interoperating resilience, social desirability, and varying perceptions of what it means to bounce back quickly may influence responses. Future research should incorporate objective measures of resilience, behavioral assessments, longitudinal designs, and mixed-methods approaches to triangulate findings. Additionally, some subgroup analysis were based on small sample sizes, leading to wider CIs and greater uncertainty. These estimates should be interpreted with caution.
Conclusions
This cross-sectional study provided important insights into factors associated with self-reported resilience during the COVID-19 pandemic in a large, diverse US sample. Our findings highlight significant racial and ethnic differences in self-reported resilience and underscore the importance of social and structural factors. Higher education, income, and social support were consistently associated with greater resilience across racial and ethnic groups, highlighting the need for policies and interventions that promote access to these resources. The partial mediation of racial and ethnic disparities by social determinants of health further emphasizes the role of systematic inequities and the need for equity-focused approaches to promoting resilience in the face of adversity.
As the world continues to grapple with the impacts of the COVID-19 pandemic and other crises, understanding and promoting healthy resilience is important. The findings of this study illustrate the complex interplay of individual, social, and structural factors that shape resilience and emphasize the need for strategies that move beyond individual-level interventions to address broader systemic inequities. Building a more resilient, equitable, and just society requires not only supporting individuals but also dismantling the structural barriers that create vulnerability.
The reference list from the paper itself. Each links out to its DOI / PubMed record.
- 1Southwick SM, Bonanno GA, Masten AS, Panter-Brick C, Yehuda R. Resilience definitions, theory, and challenges: interdisciplinary perspectives. Eur J Psychotraumatol. 2014;5(1):25338. doi:10.3402/ejpt.v 5.2533825317257 PMC 4185134 · doi ↗ · pubmed ↗
- 2Lasota A, Mróz J. Positive psychology in times of pandemic-time perspective as a moderator of the relationship between resilience and meaning in life. Int J Environ Res Public Health. 2021;18(24):13340. doi:10.3390/ijerph 18241334034948949 PMC 8707410 · doi ↗ · pubmed ↗
- 3Chan ACY, Piehler TF, Ho GWK. Resilience and mental health during the COVID-19 pandemic: findings from Minnesota and Hong Kong. J Affect Disord. 2021;295:771-780. doi:10.1016/j.jad.2021.08.14434517251 PMC 8422274 · doi ↗ · pubmed ↗
- 4Adameova A, Abdellatif Y, Dhalla NS. Role of the excessive amounts of circulating catecholamines and glucocorticoids in stress-induced heart disease. Can J Physiol Pharmacol. 2009;87(7):493-514. doi:10.1139/Y 09-04219767873 · doi ↗ · pubmed ↗
- 5Sethi P, Peiris CD. A review of catecholamine associated cardiomyopathies and channelopathies. Cureus. 2020;12(2):e 6957. doi:10.7759/cureus.695732195067 PMC 7071842 · doi ↗ · pubmed ↗
- 6Bavel JJV, Baicker K, Boggio PS, . Using social and behavioural science to support COVID-19 pandemic response. Nat Hum Behav. 2020;4(5):460-471. doi:10.1038/s 41562-020-0884-z 32355299 · doi ↗ · pubmed ↗
- 7Zhang N, Yang S, Jia P. Cultivating resilience during the COVID-19 pandemic: a socioecological perspective. Annu Rev Psychol. 2022;73(1):575-598. doi:10.1146/annurev-psych-030221-03185734579547 · doi ↗ · pubmed ↗
- 8Pollock A, Campbell P, Cheyne J, . Interventions to support the resilience and mental health of frontline health and social care professionals during and after a disease outbreak, epidemic or pandemic: a mixed methods systematic review. Cochrane Database Syst Rev. 2020;11(11):CD 013779. doi:10.1002/14651858.CD 01377933150970 PMC 8226433 · doi ↗ · pubmed ↗