Exploring the oncogenic impact of heteroplasmic de novo MT-ND5 truncating mutations
Yuanyuan Wu, Jiangbin Ye, Zhenglong Gu

TL;DR
This study shows that mutations in the MT-ND5 mitochondrial gene can lead to cancer by increasing harmful oxygen molecules and disrupting cell stability.
Contribution
The novel use of DddA-derived cytosine base editors to induce and study heteroplasmic MT-ND5 mutations in cancer.
Findings
Low heteroplasmic MT-ND5 mutations impair mitochondrial function and increase ROS.
Mutations promote oncogenesis through genome instability and altered redox balance.
Transcriptomic analysis shows upregulated cancer pathways and downregulated ROS scavenging.
Abstract
Numerous mitochondrial DNA (mtDNA) variants are associated with cancers, yet the causal link remains inconclusive. Using DddA-derived cytosine base editors, we induced de novo truncating mutations in MT-ND5 in HEK293 cells, establishing heteroplasmy, the coexistence of mutant and wild-type mtDNA. This study aimed to investigate the full molecular etiology following these deleterious mtDNA mutations, particularly in oncogenesis. We found that low to moderate heteroplasmic levels of the mutants were sufficient to impair mitochondrial functions and alter cellular redox status. Cellular adaptation to elevated ROS (Reactive Oxygen Species), energy crisis, and altered redox status was observed across varying heteroplasmy levels. Increased oncogenic potential was confirmed through in vitro oncogenesis and in vivo xenograft assays. Transcriptomic analysis revealed upregulated migration,…
Genes, proteins, chemicals, diseases, species, mutations and cell lines named across the full text — each resolved to its canonical identifier and authoritative record.
Click any figure to enlarge with its caption.
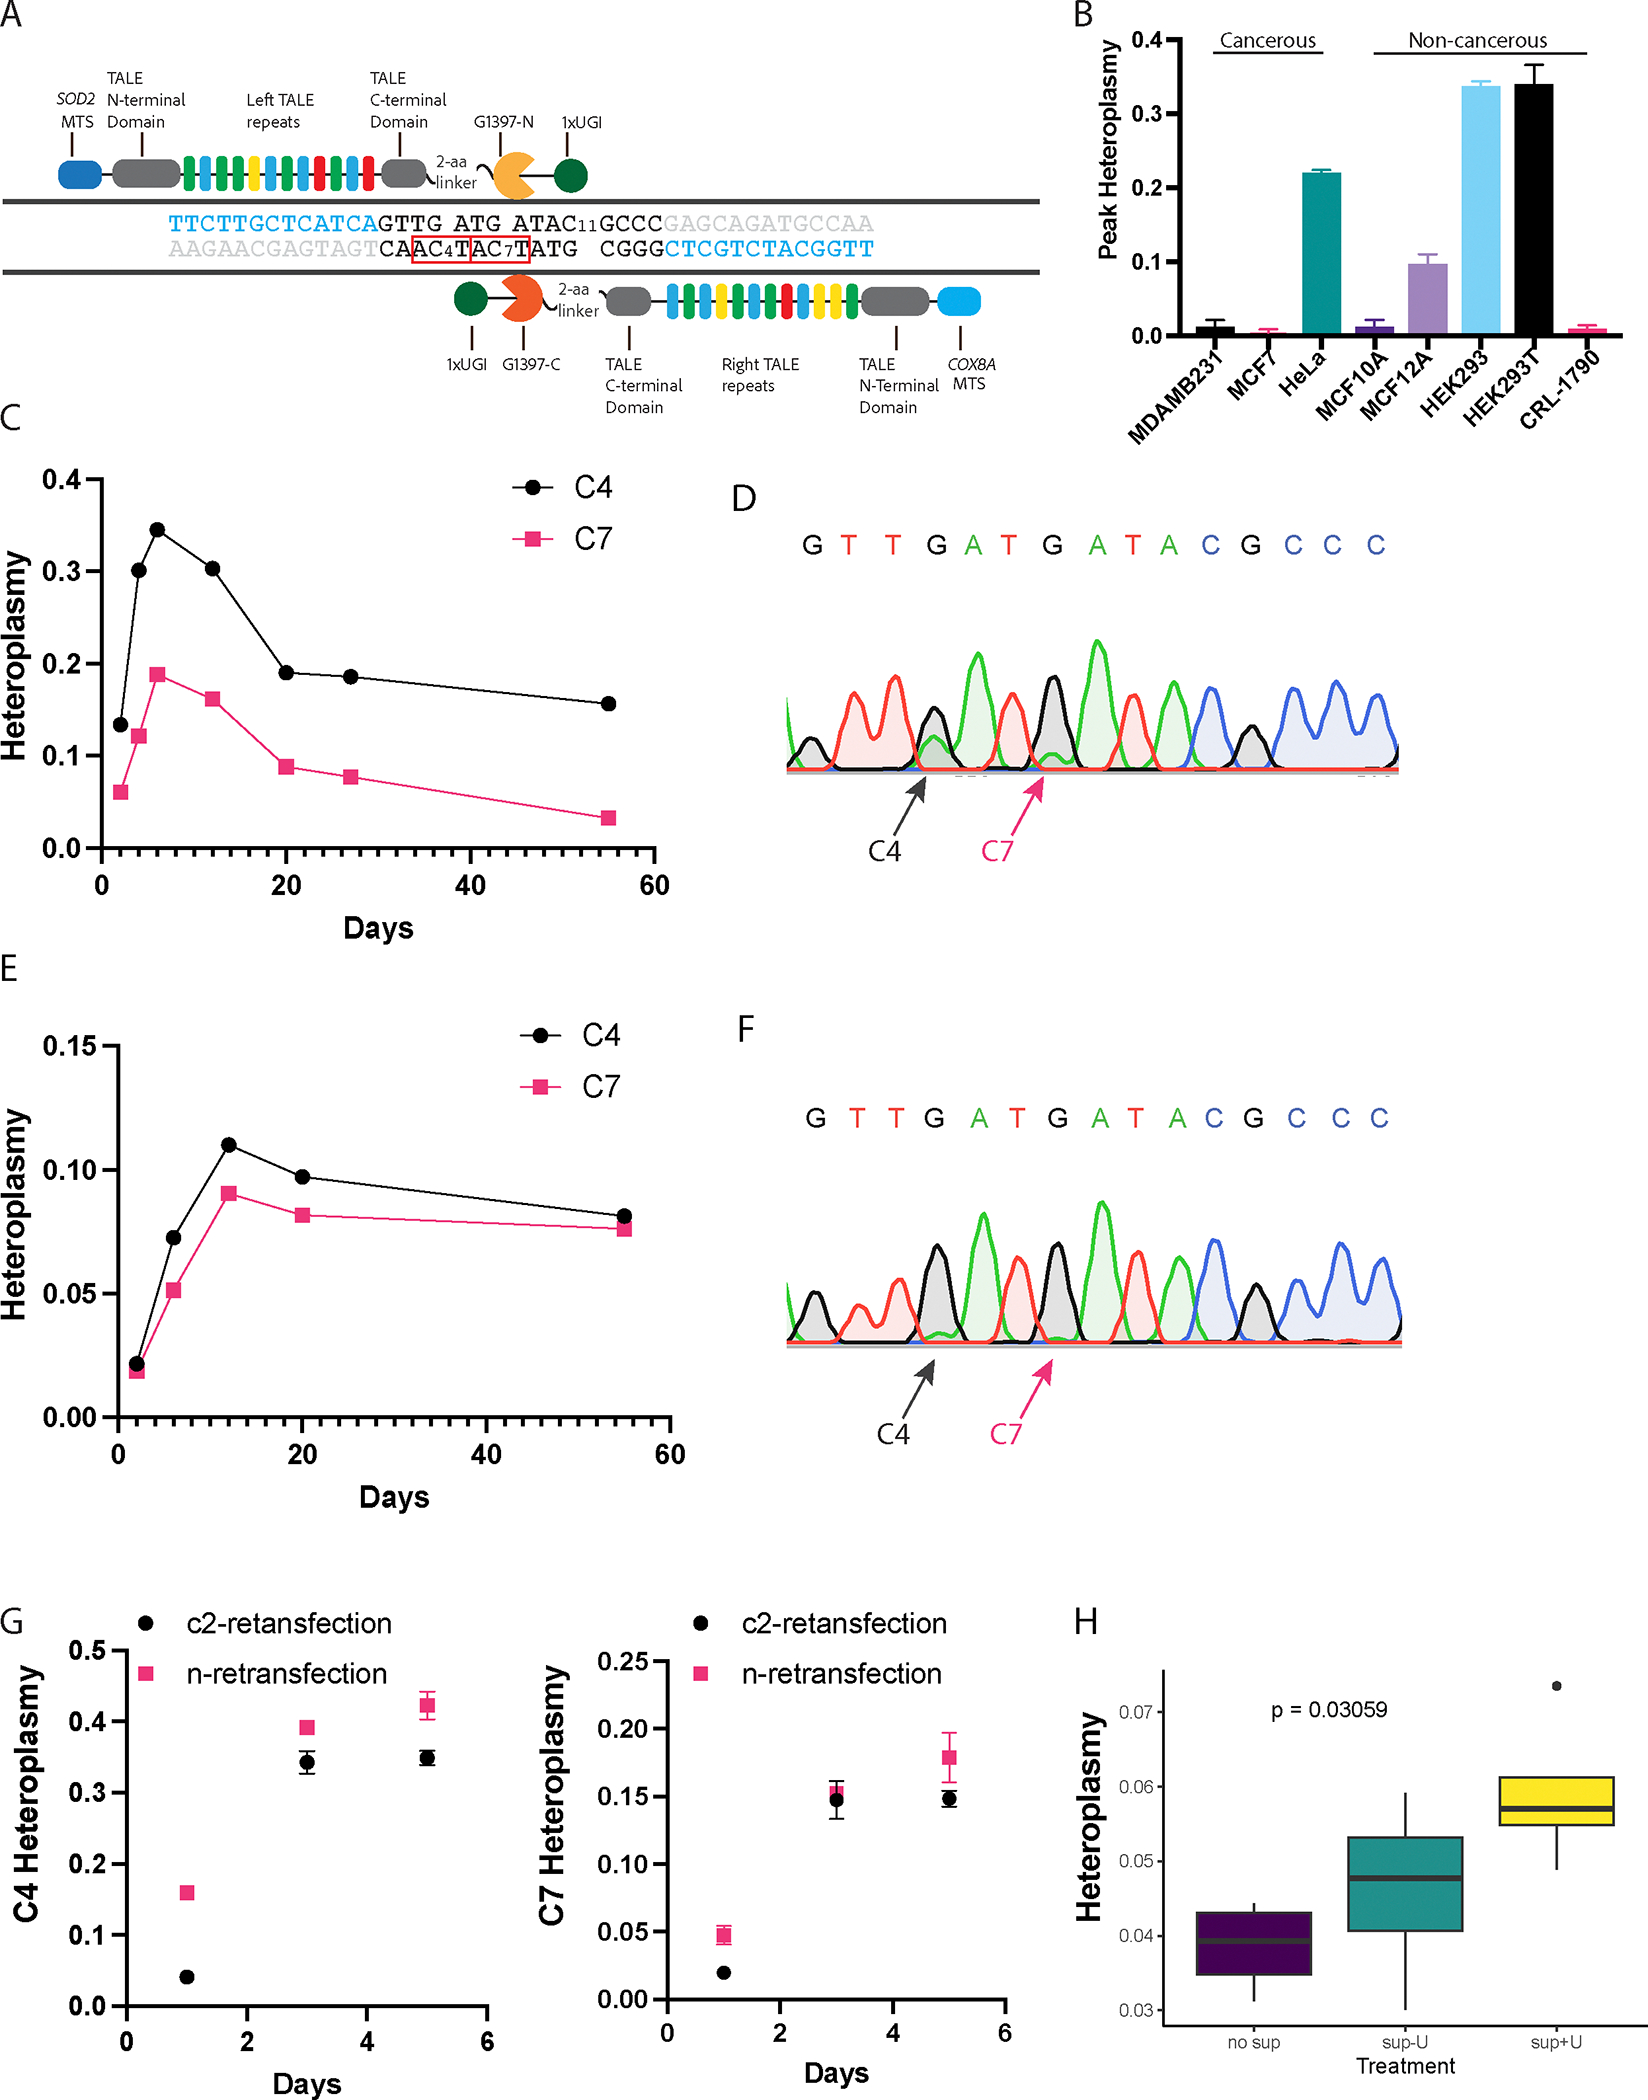 Figure 1
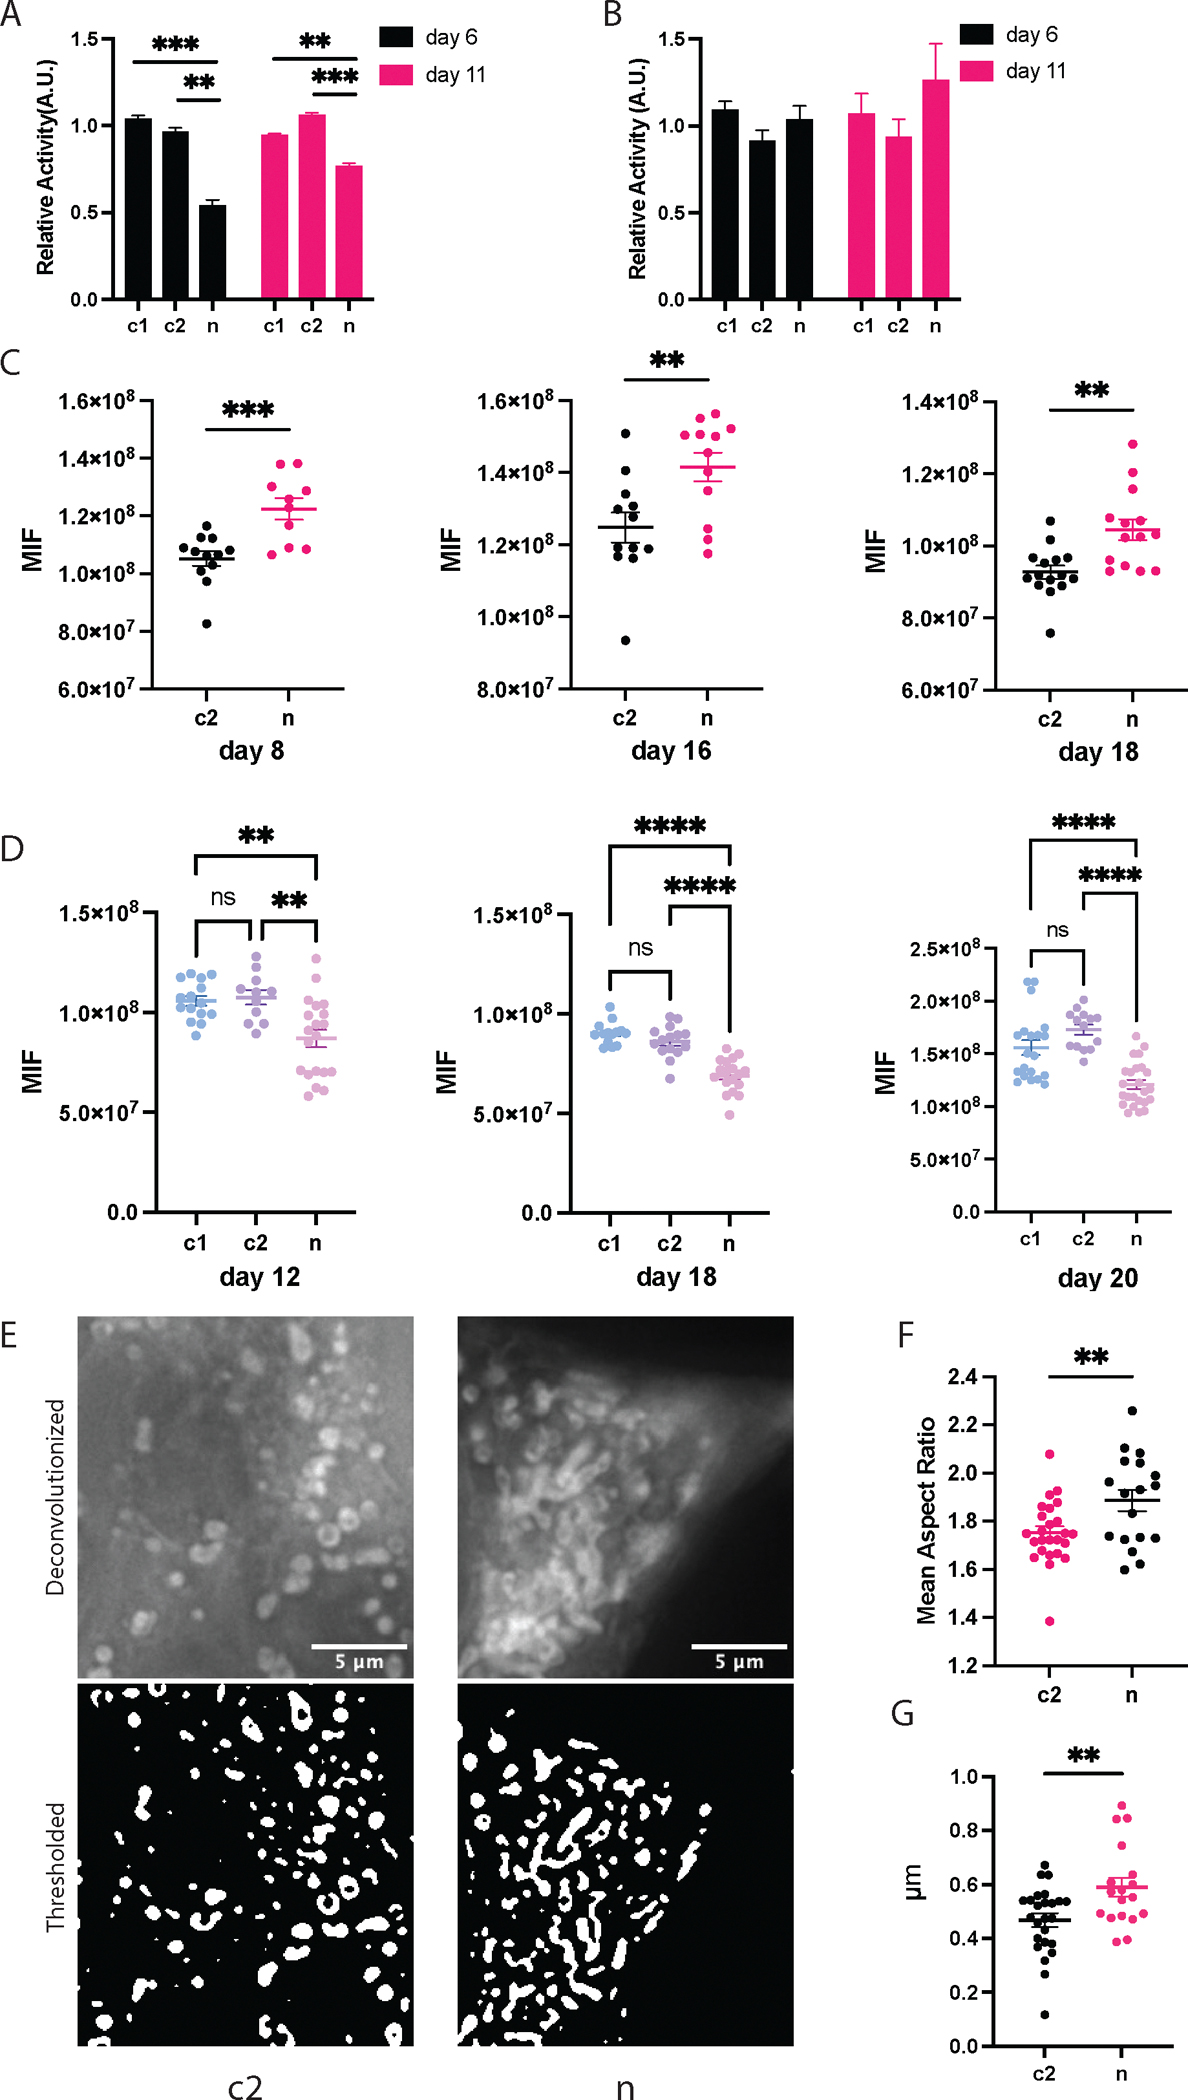 Figure 2
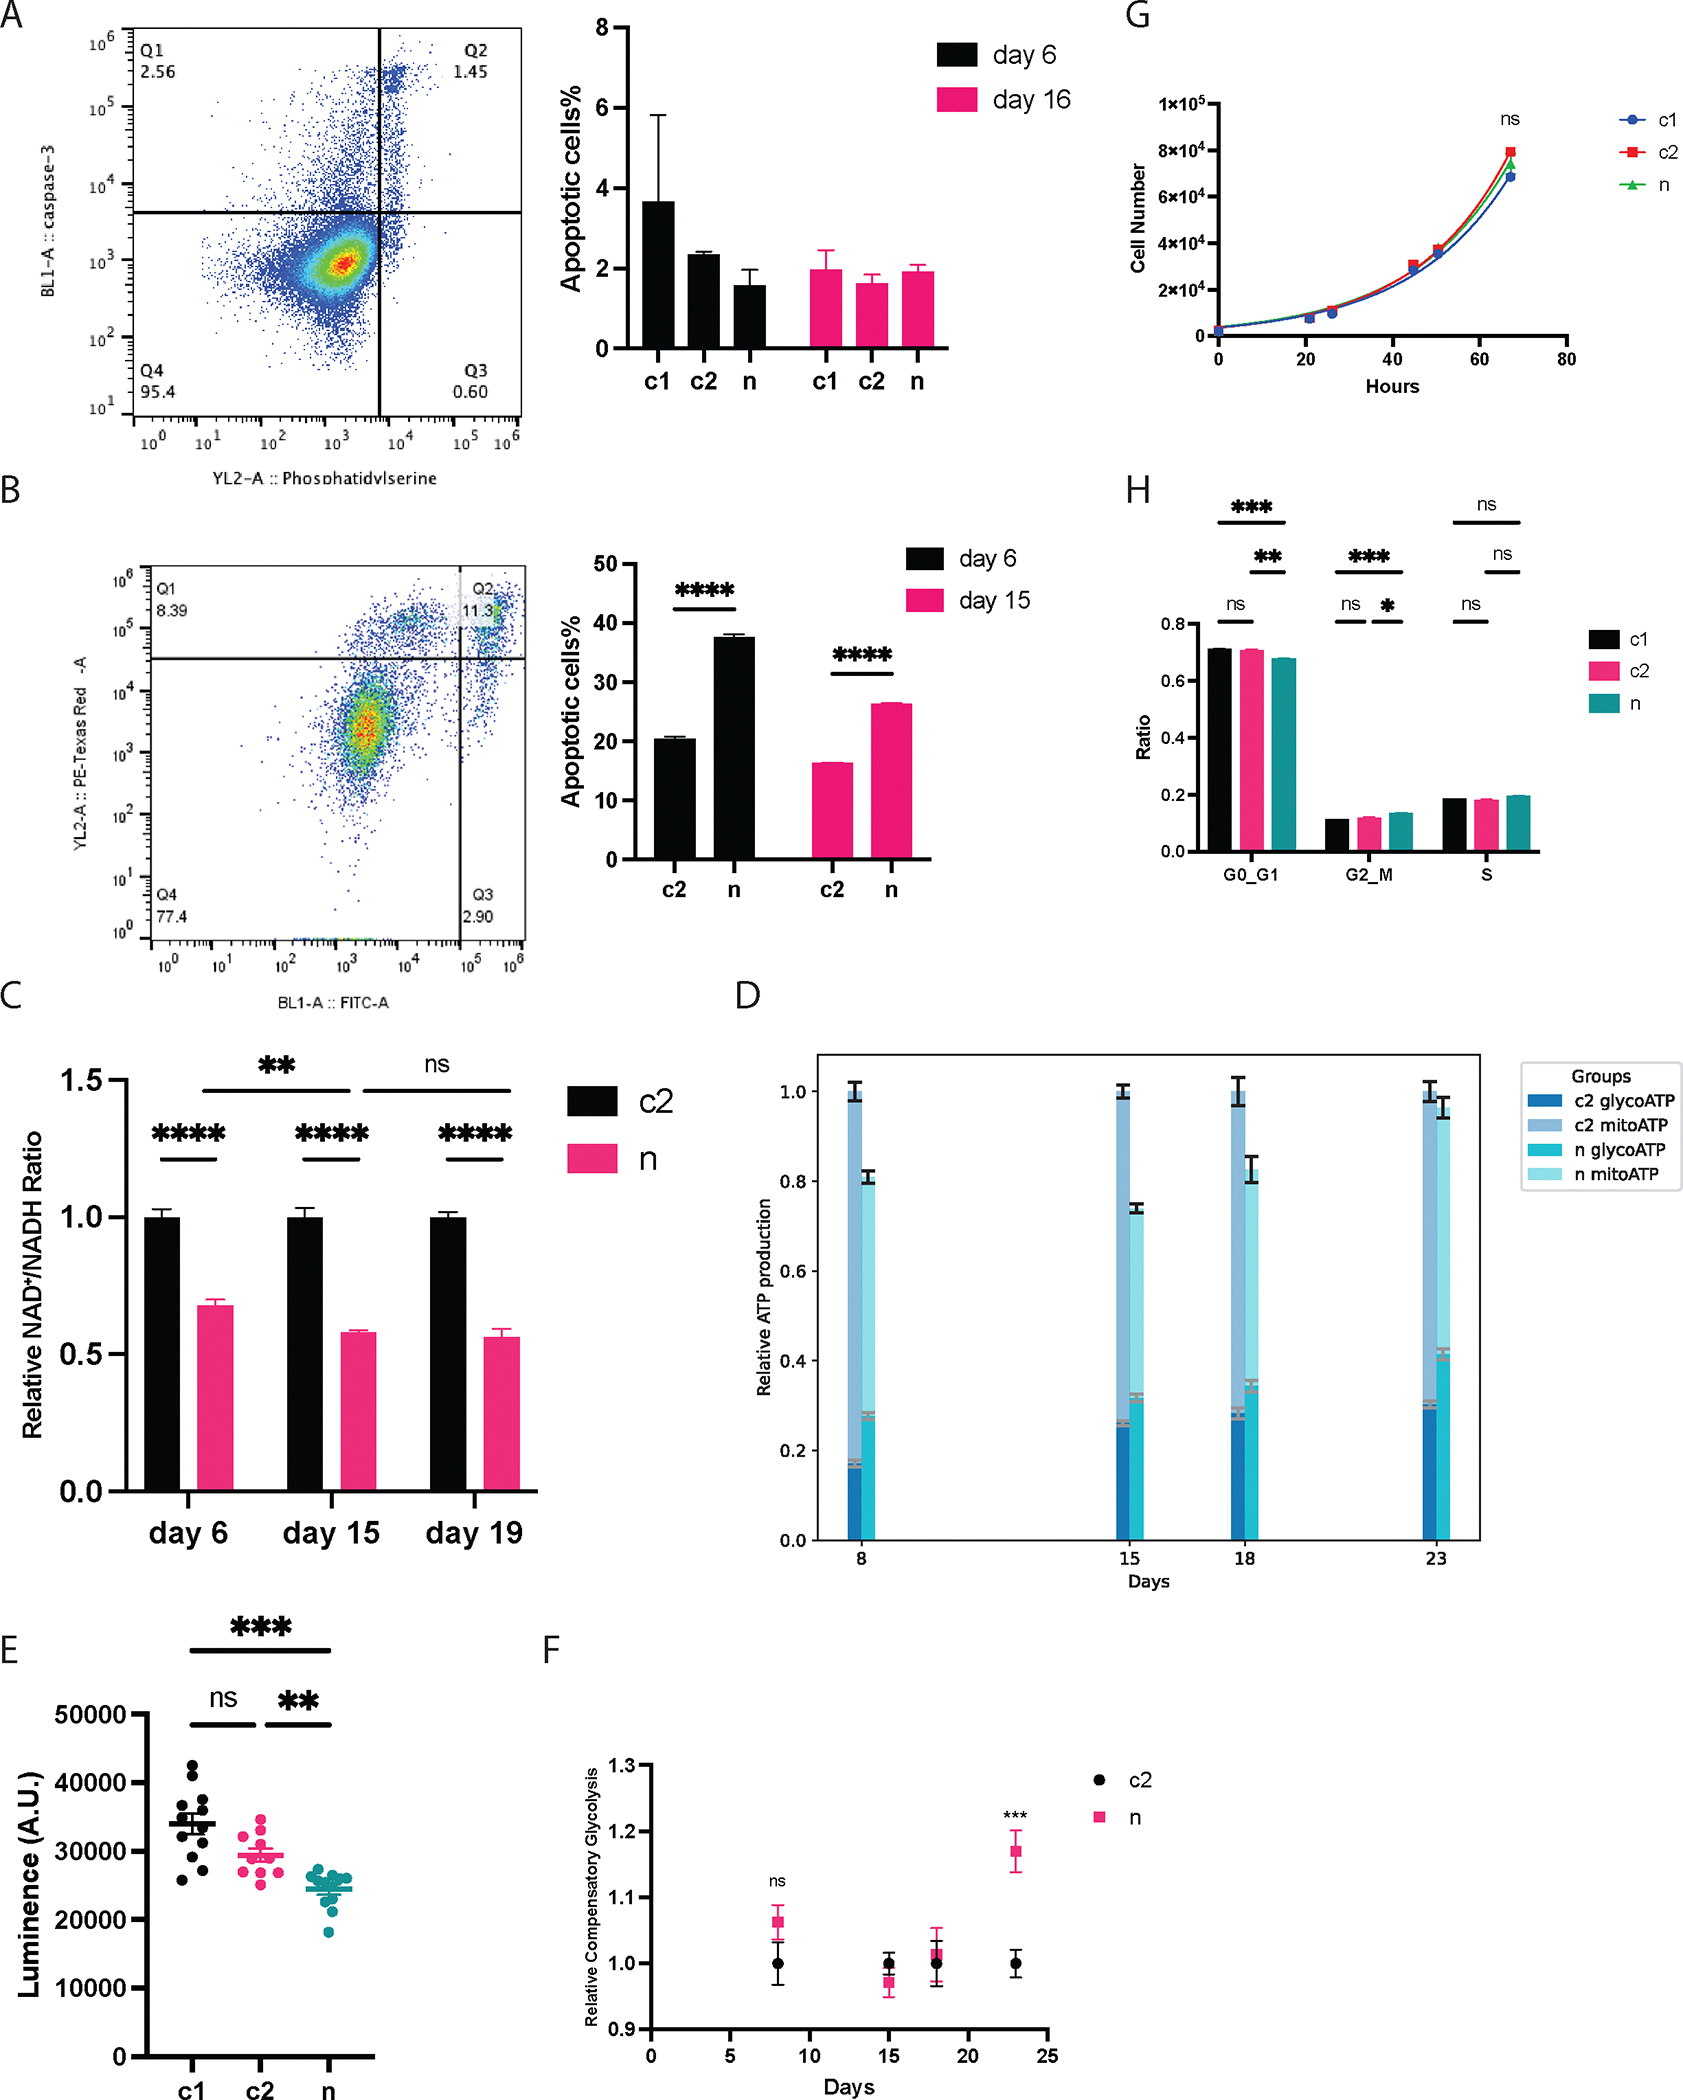 Figure 3
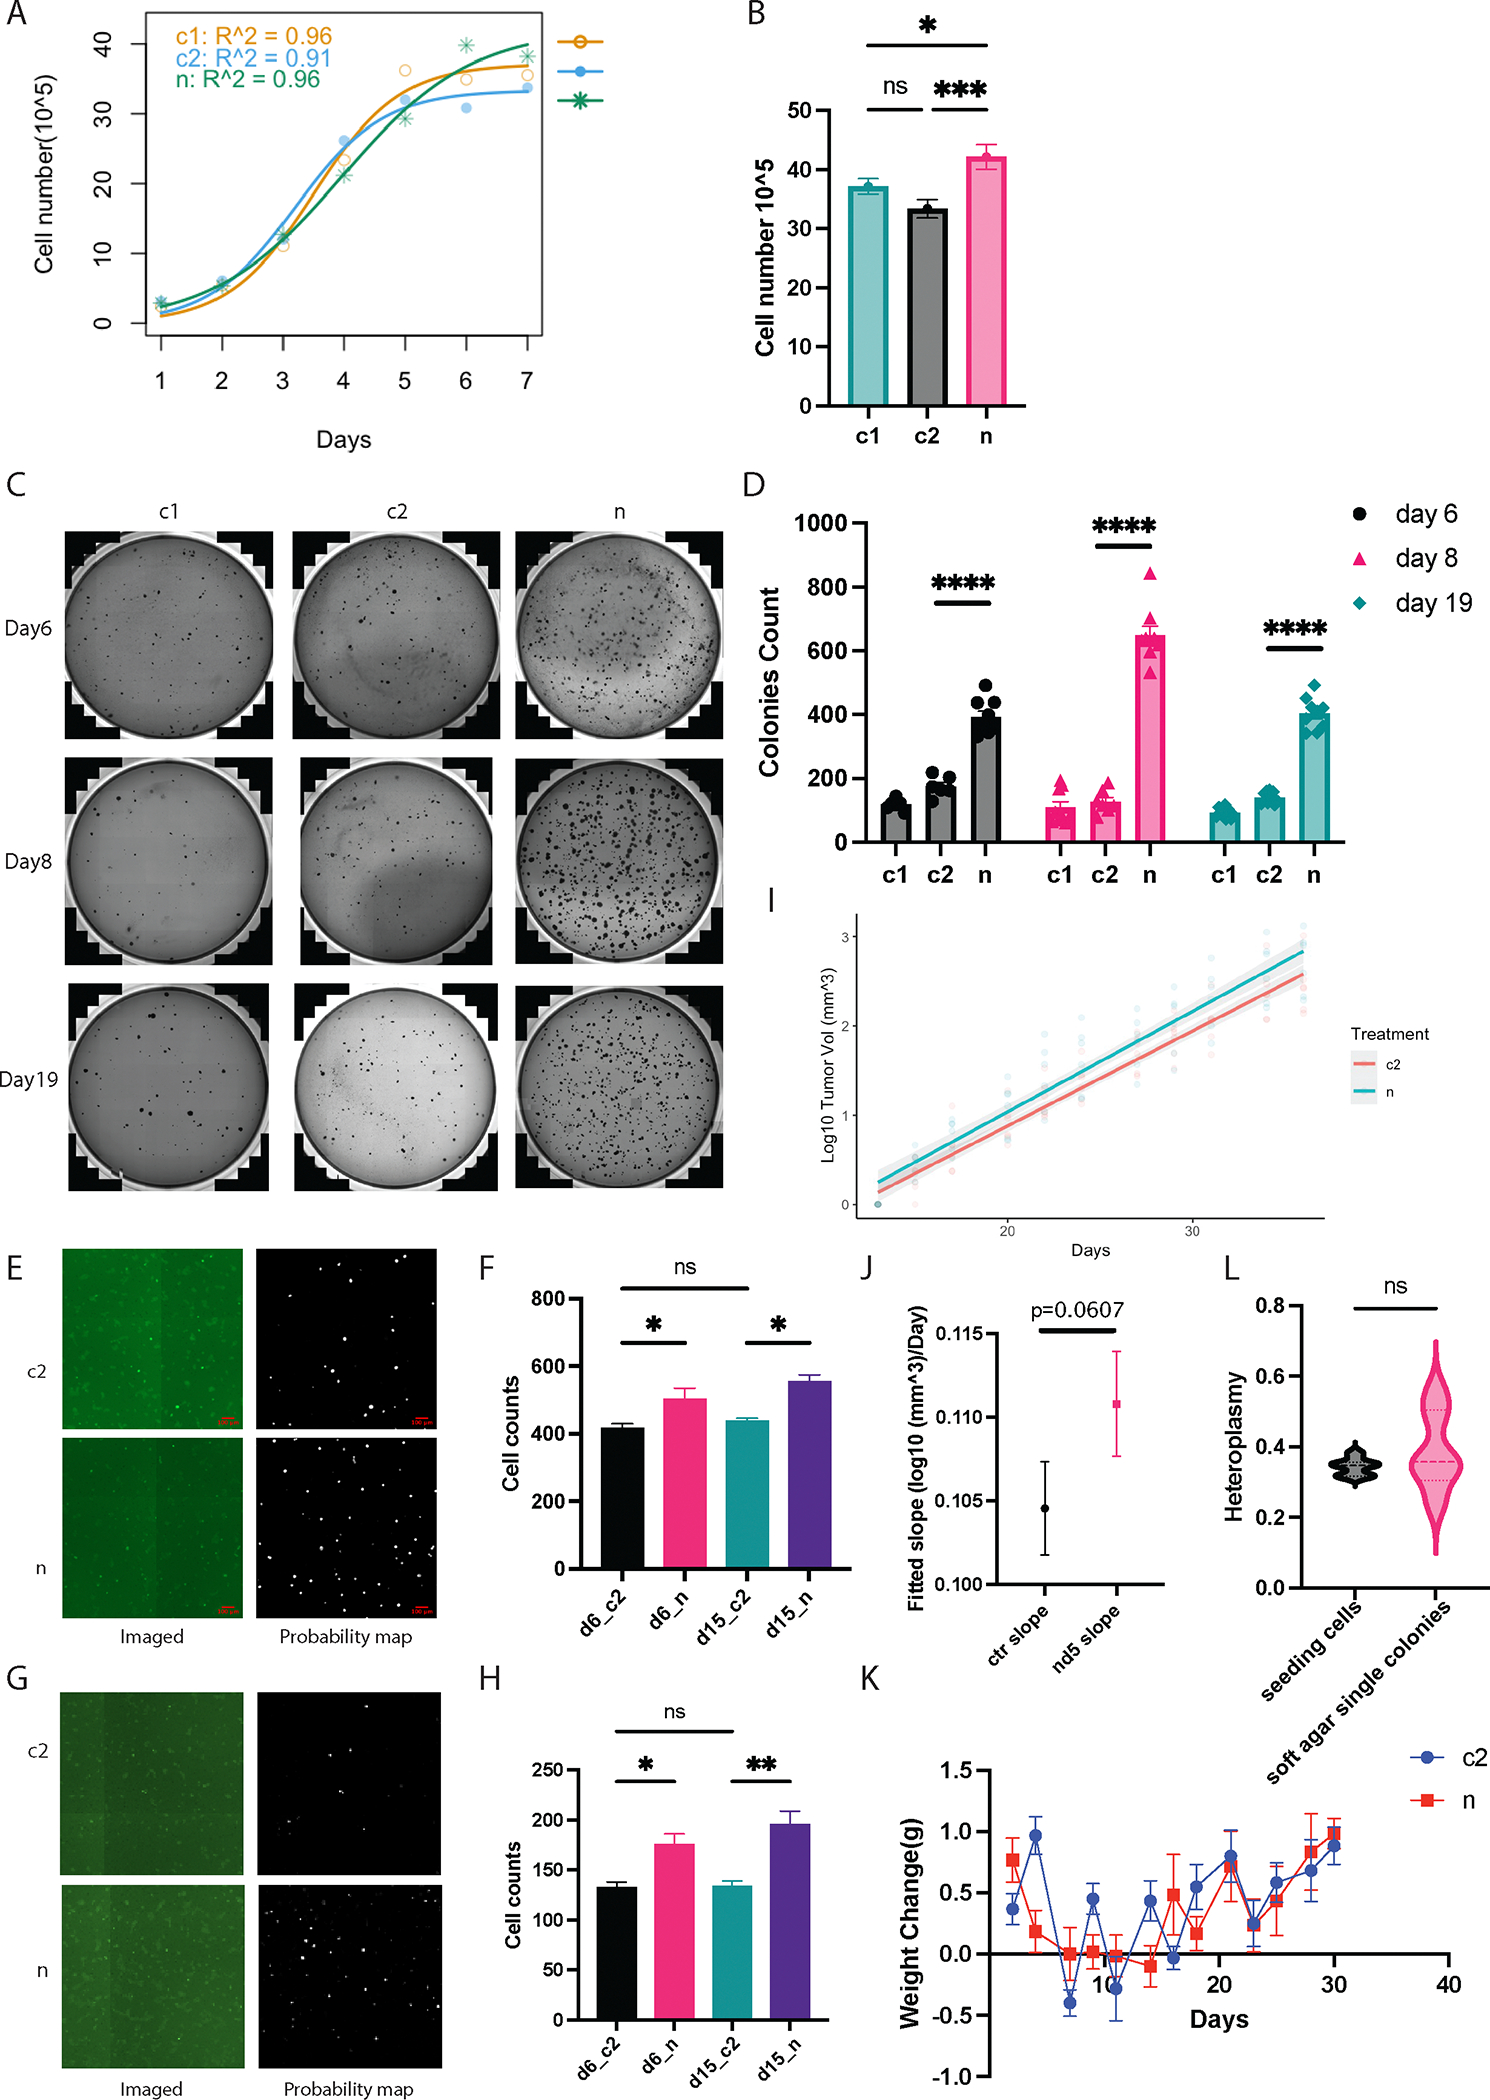 Figure 4
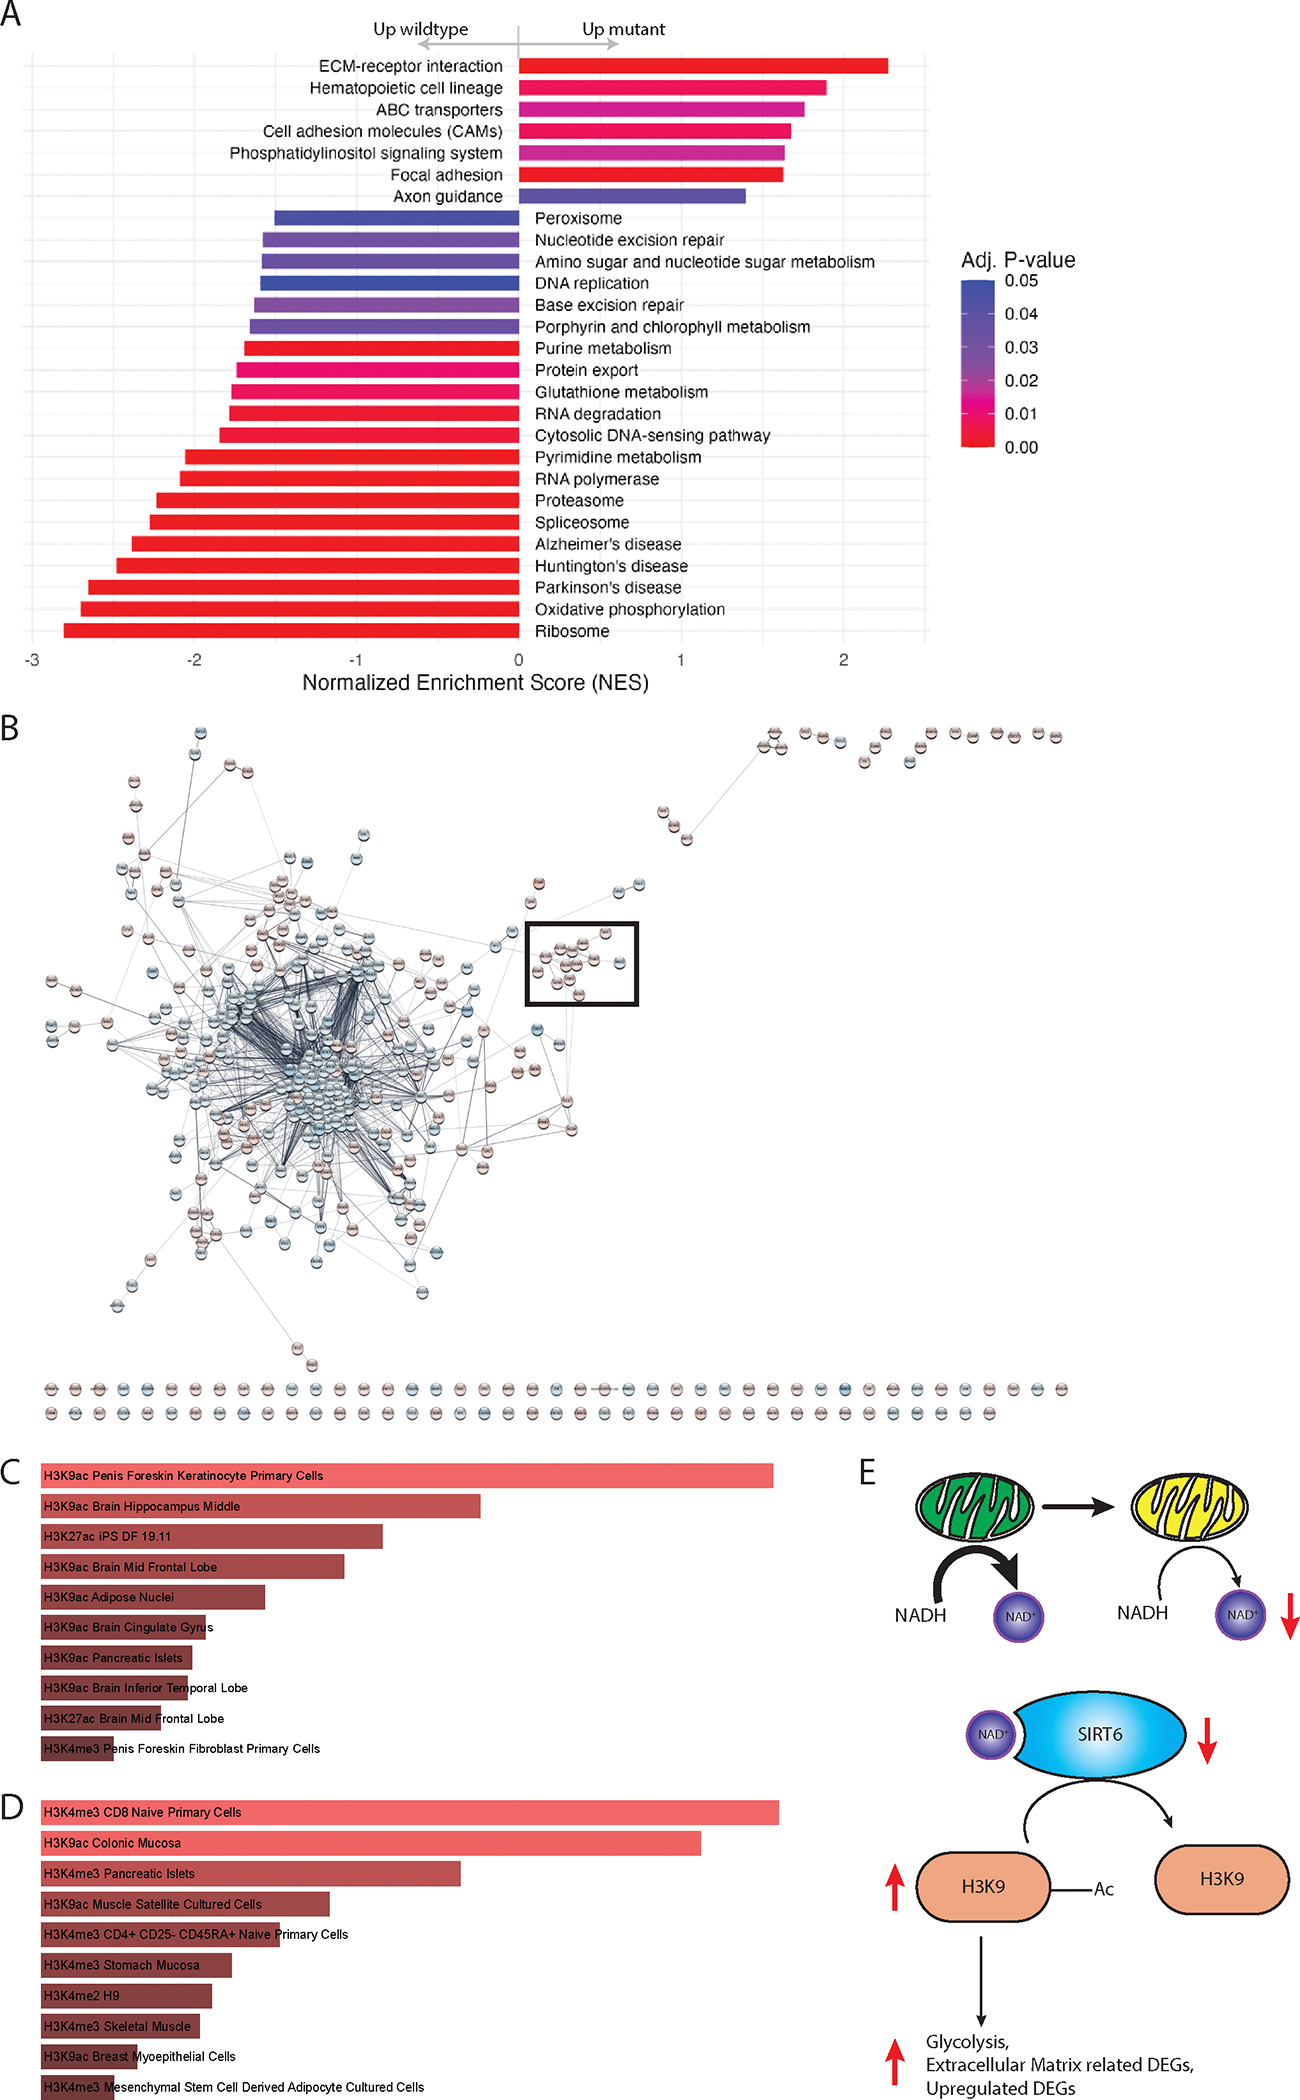 Figure 5
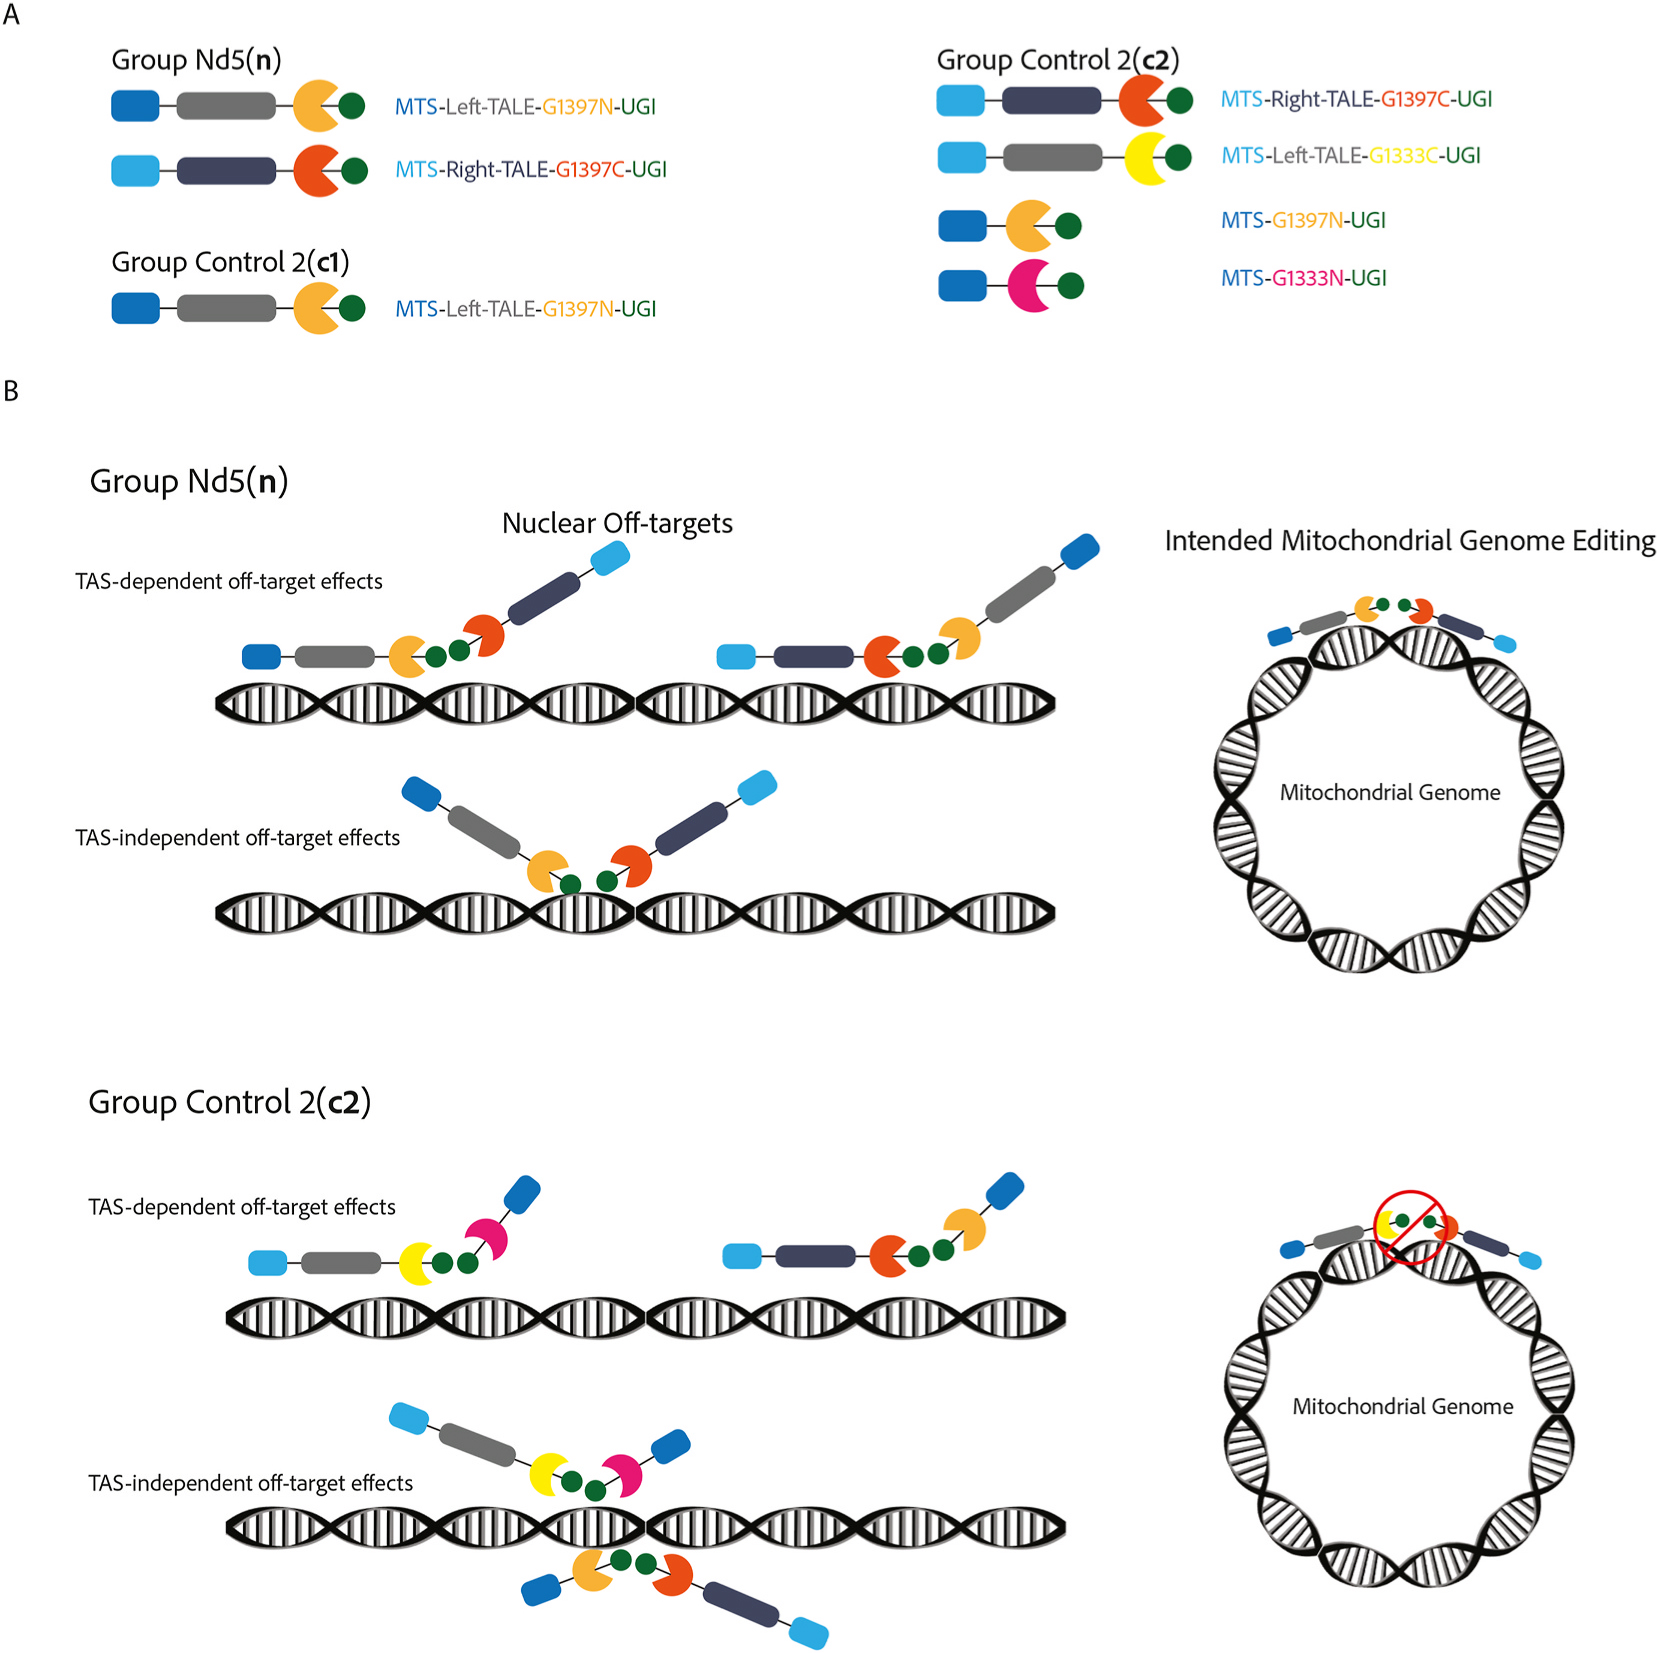 Figure 6
Peer Reviews
No public reviews on file for this paper yet. If you reviewed it on a platform where reviews are public (OpenReview, ICLR, NeurIPS, ICML), you can paste yours below so the community can read it here.
Videos
No videos yet. Explain this paper in a talk, walkthrough, or lecture? Add one.
Taxonomy
TopicsRNA modifications and cancer · Mitochondrial Function and Pathology · Ubiquitin and proteasome pathways
Introduction
A century ago, it was reported that tumor cells exhibited an increased rate of glycolysis despite an adequate oxygen supply, a phenomenon later termed the Warburg effect.^1^ This effect remains a focal point in cancer metabolism research. Initially, Warburg proposed that cancer originated from irreversibly damaged mitochondria, leading to a metabolic shift towards glycolysis.^2^ While this original hypothesis has faced criticism and is considered outdated, the evidence against it does not necessarily contradict Warburg’s hypothesis of impaired mitochondrial function as the origin of cancer. For instance, it has been demonstrated that cancer cells maintain functionally normal mitochondria^3^ and that mitochondrial respiration is essential for cancer cell growth, progression, and metastasis.^4–6^ Moreover, increased aerobic fermentation concurrent with unsuppressed oxidative phosphorylation has been proposed as a more accurate characterization of the Warburg effect.^7–9^ Nonetheless, considering the redundant copies of mitochondria within a single cell, mitochondrial function should not be viewed as a binary system but rather as a spectrum. Thus, the presence of functional mitochondria in established cancer cells, which have undergone extensive clonal expansion and selection,^10–12^ does not necessarily refute the possibility of impaired and suboptimal mitochondrial function in nascent cancer cells.
Indeed, the potential mitochondrial origin of cancer cannot be dismissed, given insights from mutations in nuclear-encoded mitochondrial genes. Key mutations in mitochondrial genes such as IDH2,^13,14^ SDHA,^15^ and FH^16,17^ have been identified as oncogenic. These genetic alterations reprogram cellular metabolism and are implicated in the production of oncometabolites such as 2-hydroxyglutarate (2-HG),^13,18^ succinate,^19^ and fumarate.^15,20^ Dysfunctional mitochondria have been implicated in a wide range of age-related diseases,^21,22^ including neurodegenerative disorders^23^ and cancers.^24^ Their critical role in cellular differentiation^25^ and epigenetic regulation^26,27^ highlights the profound impact of mitochondrial dysfunction on cellular processes.
Mitochondria possess their own genome, comprising 16,569 base pairs, densely encoding 13 coding genes for electron transport chain complexes, and 22 tRNAs and 2 rRNAs necessary for mtDNA translation.^28^ Furthermore, the mitochondrial genome (mtDNA) mutation rate is 10–100x higher than that of the nuclear genome,^29,30^ and the pathogenic mtDNA variants are surprisingly prevalently distributed even among healthy individuals.^31^ Similar to the nuclear-encoded mitochondrial genes introduced earlier, mtDNA variants potentially impact mitochondrial function have been suggested as causal factors in cancer.^32,33^ Despite identification of numerous tumor-specific mtDNA variants through association studies,^34–39^ the driver status of these variants remains to be conclusively determined. To address this, we sought to establish a causal link between mtDNA variants and cancer progression.
However, to determine whether a tumor-specific mtDNA variant is causal in oncogenesis, a meticulously designed study is required.^40,41^ This study must account for differences in the nuclear genome and epigenome, the presence of other complicating mtDNA variants, and the effects of mtDNA copy number and heteroplasmy levels. Only then can the molecular etiology of a specific mtDNA variant be elucidated. Few studies have adhered to these strict criteria, with most employing the transmitochondrial cybrid method to investigate mtDNA variants while controlling for nuclear DNA.^26,42–45^ Despite its importance, this method has limitations. First, the nuclear donor cells in cybrids are often cancerous cell lines, such as the 143 TK-cell line, which are treated with the DNA intercalating agent ethidium bromide (EtBr) for a long period of time to completely eliminate mtDNA, transforming them into rho0 cell lines. Extended EtBr treatment can increase the burden of nuclear DNA mutations, in addition to the original cancerous nuclear genome, obscuring the effects of mtDNA variants. Furthermore, the transmitochondrial cybrid method is restricted to existing mtDNA variants, and the presence of heteroplasmic or unintended mtDNA variants can interfere with the study of the intended variant.
To address these limitations, we proposed investigating the causal link of mtDNA variants to oncogenesis by introducing de novo mutations into non-cancerous cell lines and assessing their post-mutation oncogenic potential. Utilizing the recently developed ddA-derived cytosine base editors (DdCBEs), which allow for the induction of de novo mtDNA variants,^46^ we induced truncating mutations in MT-ND5 in the Human Embryonic Kidney (HEK) 293 cell line. This mutation was selected based on previous findings indicating a positive selection of deleterious truncating MT-ND5 mutations in kidney, colorectal, and thyroid cancers.^39^ MT-ND5, the longest mtDNA-encoded gene and a major subunit of mitochondrial Complex I, was selected as it is the most mutated mtDNA-encoded coding gene.^47^
Following the induction of heteroplasmic truncating mutations in MT-ND5, we extensively characterized the cellular and mitochondrial responses to these mutations at various heteroplasmy levels. We demonstrated that MT-ND5 mutations indeed increased oncogenic potential. This study revealed that the induced truncating mutations in MT-ND5 are advantageous in nascent cancer cells, at least in kidney cells. We reasoned that increased genome instability, elevated ROS levels, and altered epigenetic landscapes are key drivers of the oncogenic potential heightened by the deleterious MT-ND5 mutations.
Results
Evaluating MT-ND5 editing efficacy and cellular adaptation to induced heteroplasmy using DdCBEs
2.1.
First, we aimed to investigate the potential of inducing de novo stop gain mutations in MT-ND5 using bacterial toxin DddA-derived cytosine base editors (DdCBEs).^46^ In canonical DdCBEs, nontoxic and inactive pairing halves of DddA deaminase enzyme were fused with Transcription Activator-Like Effector (TALE) assay sequences (TAS) and transiently transfected for efficient mtDNA editing.^46^ We setup control group c1 to control for merely transfection process, where only an incomplete split component was transfected. Another control group, c2, was setup to control for potential nuclear off-target effects,^48,49^ where the transfected plasmids are confronting and non-functional in mitochondrial genome, but accurately manifest potential nuclear off-target in the MT-ND5 mutated group n (Figure A.6B). Notably, control groups c1 and c2 are comparable in the majority of the biochemical assays, including two dimensional and anchorage independent growth rate assays, transwell migration and invasion assays, mitochondrial morphology, and energy profile, indicating minimal effects of the rare nuclear off-targets.
Upon analyzing the sequence constraints of TALE^50^ and the editing preferences of DdCBEs,^46^ we targeted point mutations at positions MT12806 (C4: the 4th C within the editing window) and MT12809 (C7: the 7th C within the editing window) on the sense strand (Fig. 1A). Cytosine (C) to thymine (T) transitions at these sites were predicted to convert the original mitochondrial tryptophan codon (TGG) to a mitochondrial stop codon (TAA), thereby inducing truncating mutations within MT-ND5.
Among all tested cell lines, the highest heteroplasmy level exhibited in HEK293 and HEK293T cell lines (Fig. 1B). Notably, six days post-transfection, both cell lines reached comparable peak heteroplasmy levels of 34 % for C4 and 18 % for C7 (Fig. 1C). The heteroplasmy level specifically refers to the proportion of induced mutant mtDNA. Despite C7 heteroplasmy being uniformly lower, it paralleled C4 in the longitudinal trend over the course of two months (Fig. 1C–E). Consequently, in our analysis, references to heteroplasmy without specifying C4 or C7 pertain to C4 heteroplasmy. In contrast, the MCF10A, CRL-1790, MDA-MB-231, and MCF-7 cell lines showed no detectable heteroplasmy after transfection (Fig. 1B). HeLa and MCF12A cells exhibited lower heteroplasmy than HEK293 cells. We also observed a longitudinal pattern where heteroplasmy peaked and then decayed to a plateau (Fig. 1C–E). These patterns were reproducible across multiple experiments, indicating a robust mutation introduction rate and consistent cellular responses to the mutations. The mechanisms underlying the variance in mtDNA mutation tolerance across cell lines remain unclear. Our data demonstrated that neither the cancerous background of the cell line nor the tissue origin predicted tolerance to the mtDNA variants (Fig. 1B).
To determine whether higher levels of bulk heteroplasmy can be tolerated beyond the observed peak, we conducted a secondary transfection on HEK293 cells. This re-transfection was performed on the previously transfected control group (c2), at a heteroplasmy level of 0 %, and on the treatment group (n), at a stabilized heteroplasmy level of 16 %. As expected, the control group (group c2) manifested the established peak heteroplasmy level of 34 % after retransfection. Notably, the retransfected group n exhibited an increased peak heteroplasmy level of 42 % (Fig. 1G). This new peak heteroplasmy suggests that the retransfection process uniformly converts a proportionate amount of wild-type mtDNA to mutant forms. Specifically, for the C4 editing site, retransfection converted 34 % of the remaining 84 %wild-type mtDNA into mutants. Combined with the pre-existing 16 % mutant mtDNA, this resulted in an approximate new peak heteroplasmy of 42 %. This marks a mutation introduction ceiling of 34 % of wild-type mtDNA in HEK293 cells.
We next investigated the effects of supplements on heteroplasmy levels, anticipating that enhanced nutritional support would mitigate the metabolic deficiency caused by MT-ND5 mutations. We tested three levels of supplementation, which included either a subset or all of the following nutrients: sodium pyruvate, glutamine, uridine, and non-essential amino acids. These supplements were chosen based on their roles in supporting mitochondrial function and compensating for deficiencies in energy and nucleotide production.^51^ We found a non-random association between the order of the supplementing groups and the heteroplasmy levels (Fig. 1H). This implies that the selection against the mtDNA variants can be partially offset by supplements that bolster mitochondrial function.
Induced heteroplasmic MT-ND5 mutations systematically alter mitochondrial dynamics
2.2.
We initiated our investigation into the impact of induced mtDNA variants on mitochondrial function at various heteroplasmy levels by assessing Complex I activity. These mtDNA variants were predicted to induce premature termination of transcription in MT-ND5, a major subunit of Complex I, potentially affecting its physiological activity. We measured the substrate consumption rate of Complex I at two heteroplasmy levels, a peak of 34 % and a reduced level of 30 %, corresponding to 6 and 12 days post-transfection, respectively.
We observed a marked reduction in Complex I activity due to the MT-ND5 mutations (Fig. 2A). Complex IV activity remained unaltered across all groups (Fig. 2B). Specifically, Complex I activity was approximately 54 % of the control level at 34 % heteroplasmy, improving to 74 % of the control level as the heteroplasmy level decreased to 30 %. This recovery in Complex I activity, with just a 4 % reduction in heteroplasmy over six days, highlights the dynamic and non-linear response of mitochondrial functionality to changes in mtDNA composition.
Next, we investigated the effect of MT-ND5 mutations on mitochondrial ROS levels. As Complex I is considered a major source of mitochondrial ROS,^52^ we aimed to determine how mitochondrial ROS levels were affected by the dysfunctional MT-ND5 mutations. The MitoSOX Red dye was utilized to assess mitochondrial superoxide levels. Elevated mitochondrial ROS levels were observed in cells at heteroplasmy levels of 33 % and 20 % (Fig. 2C). Concurrently, we noted a decrease in mitochondrial membrane potential at heteroplasmy levels of 30 %, 20 %, and 19 % (Fig. 2D). Both increased mitochondrial ROS level and reduced membrane potential indicate systematic mitochondrial dysfunction.
Last, we explored the impact of MT-ND5 mutations on mitochondrial morphology at a near-plateau heteroplasmy level of 20 % (day 18). Cells with MT-ND5 heteroplasmy exhibited a higher aspect ratio (Fig. 2F) and increased total branch length per mitochondrion (Fig. 2G), suggesting enhanced mitochondrial fusion over fission. This shift towards fusion likely represents an adaptive mitochondrial quality control mechanism aiming to mitigate mutation-induced damage. Fusion potentially helps dilute dysfunctional mutant mtDNA, reflecting cellular efforts to reduce oxidative stress and stabilize membrane potential.^53^ However, this increased fusion activity also hinders complete clearance of mutant mtDNA, stabilizing the deleterious mitochondrial mutations within the mitochondrial population and leading to plateaued heteroplasmy.
MT-ND5 heteroplasmy induces multifaceted cellular responses: Apoptosis, redox status, energy metabolism, and cell cycle arrest
2.3.
To evaluate the cellular response to the heteroplasmic MT-ND5 mutations, we first measured the apoptosis rate on days 6 and 16, corresponding to peak heteroplasmy levels of 34 % and 22 %, respectively. We hypothesized that increased apoptosis would selectively eliminate dysfunctional cells, leading to a decrease in heteroplasmy levels. Contrary to our assumption, we observed that all groups exhibited comparably low baseline apoptosis rates (3A). This indicates that the critical biochemical threshold needed to trigger cellular-level dysfunction and apoptosis was not reached at these heteroplasmy level.^54,55^
Further probing into the cells’ resilience against oxidative stress, we subjected them to menadione, a known inducer of apoptosis through the elevation of cellular ROS levels.^56^ Notably, cells carrying MT-ND5 heteroplasmy demonstrated heightened susceptibility to ROS-induced stress (Fig. 3B). This sensitivity was more pronounced in cells with 34 % heteroplasmy than in those with 22 %, suggesting that cells with higher heteroplasmy exhibit a more compromised ability to neutralize ROS.
Overall, our results indicate that while MT-ND5 mutations do not augment baseline apoptosis rate, they render cells more vulnerable to additional oxidative stress. This indicates an exhausted cellular protection against ROS after MT-ND5 mutations.
Subsequently, we measured the NAD^+^/NADH ratio at a peak heteroplasmy level of 34 %, as well as at 22 % and 20 %, corresponding to growth days 6, 15, and 19, respectively (Fig. 3C). We hypothesized that mutations in MT-ND5, a major subunit of mitochondrial Complex I (NADH: ubiquinone oxidoreductase), would decrease the NAD^+^/NADH ratio, as Complex I converts NADH to NAD^+^.^57^
Our results validated the hypothesis, demonstrating a significant reduction in the NAD^+^/NADH ratio in cells across all MT-ND5 heteroplasmy levels (Fig. 3C). Specifically, from assay days 6–19, as heteroplasmy levels decreased, the NAD^+^/NADH ratio also declined before appearing to stabilize at a lower heteroplasmy. The stabilized NAD^+^/NADH ratio was approximately 56.5 % of the control level (Fig. 3C). This suggests that partial recovery of wild-type mtDNA does not fully mitigate the lasting impact of MT-ND5 mutations on NAD ^+^ deprivation.
The reduction in NAD^+^/NADH ratio, in combination with increased mitochondrial ROS level and increased susceptibility to induced ROS, indicates an altered cellular redox status after MT-ND5 mutations.
Next, total cellular ATP was estimated from oxidative phosphorylation (mitoATP) and glycolysis (glycoATP) derived from glycolytic assays (Fig. 3D). This estimation was validated by a luminescent assay on day 18 samples (Fig. 3E), showing comparable relative total ATP ratio to the glycolytic assay. We found that MT-ND5 mutated cells had a lower overall total ATP level, with the minimal relative total ATP production identified around day 15 (Fig. 3D). Interestingly, on day 23—when heteroplasmy plateaued—the total ATP levels began to normalize, approaching those of the control group (Fig. 3D). We postulate that the energy crisis may select against the MT-ND5 mutations, hence the stabilization of the heteroplasmy level once the ATP deficit is mitigated.
In parallel, we observed that cells with MT-ND5 mutations consistently exhibited a 7.59 % increase in glycolysis compared to the control cells (Fig. 3D). While MT-ND5 mutations resulted in a steady increase in glycolysis, the maximal glycolytic capacity, referred to as ‘compensatory glycolysis’ in the Seahorse Glycolytic Assay, did not exhibit any change until plateaued heteroplasmy (day 23). At this point, it surged by 17 % above the control (Fig. 3F). This significant rise marks the cells’ increasing adaptability to aerobic fermentation at the plateaued heteroplasmy.
We monitored the growth rates of HEK293 cells at heteroplasmy levels of 30 %, 20 %, 19 %, 19 %, and 18 % on days 12, 18, 23, 26, and 30, respectively. Remarkably, no significant changes in growth rates were observed across any of the heteroplasmy levels(Fig. 3G–Table 1). Neither MT-ND5 heteroplasmy nor supplements altered the cellular growth rate in the MCF12A and HeLa cell lines (Table 1). The sensitivity of our growth rate measurement was validated by assessing TGFB1’s inhibitory effect on MCF12A cells (Table 1), consistent with its known impact on normal mammary epithelial cells.^58–60^ These results confirm that low-to-moderate MT-ND5 heteroplasmy or supplementation does not impact two-dimensional cell growth rates.
Moreover, we observed notable shifts in the cell cycle distribution of MT-ND5-mutated cells (Fig. 3H). Specifically, there was a significant decrease in the proportion of cells in the G0/G1 phase, coupled with an increase in the G2/M phase population (Fig. 3H). The proportion of cells in the S phase remained stable, and this aligns with our findings of unaltered cell growth rate. The exact mechanism underpinning this cell cycle shift remains unclear, yet this observation aligns with a previous report that mitochondrial DNA damages initiate G2/M cell cycle arrest^61^ and another report that G2/M checkpoint pathways are highly associated with mitochondrial genes.^39^
Heteroplasmic MT-ND5 mutations enhance oncogenic phenotypes in vitro and in vivo
2.4.
To assess the oncogenic potential of MT-ND5 variants, we evaluated the effects of MT-ND5 heteroplasmy in HEK293 cells. First, our results indicate that HEK293 cells with MT-ND5 heteroplasmy exhibit a heightened resistance to contact inhibition, as demonstrated by an elevated fitted asymptote indicative of maximum viable cell count on constrained two-dimensional tissue cultures (Fig. 4A and B).
Subsequent analysis of anchorage-independent growth via the soft agar assay revealed that MT-ND5 heteroplasmy significantly augments colony formation across heteroplasmy levels (Fig. 4C and D). Notably, the greatest proliferation occurred at a heteroplasmy level of 33 % (day 8). Both peak heteroplasmy levels of 34 % and 20 % facilitated similar, though less pronounced, enhancements in colony formation compared to 33 %.
Additionally, we noted that the average heteroplasmy across all sampled single-cell-derived colonies was consistent with the initial seeding heteroplasmy (Fig. 4L). This indicates that the expansion of colonies in soft agar over a two-week period does not lead to a decline in average heteroplasmy, which contrasts with our observations in standard two-dimensional tissue culture (Fig. 1C–E).
The preservation of heteroplasmy levels within soft agar colonies implies that the selective pressures against mutant mtDNA variants in two-dimensional tissue cultures are either absent or substantially diminished in this three-dimensional, anchorage-independent growth context.
Furthermore, we investigated directed cell motility through transwell migration and transwell invasion assays. Our data demonstrate that both 34 % and 20 % heteroplasmy levels significantly elevate transwell invasion and migration to similar extents (Fig. 4E–H).
We next examined the impact of MT-ND5 heteroplasmy on tumor growth in vivo using a mouse xenograft model. A high number of HEK293 cells (3 × 10^6^ cells/mice) were subcutaneously injected into NOD.Cg-Prkdc^scid^ Il2rg^tm1Wjl^/SzJ (NSG) mice, a strain with severe immune deficiency. Our observations revealed that both the control (c2) and MT-ND5 heteroplasmic cells (n) exhibited exponential growth following the initial detection of tumors. Notably, there was a trend toward enhanced tumor growth in the presence of MT-ND5 heteroplasmy (Fig. 4I and J). While the p-value of 0.0607 narrowly exceeds the conventional threshold for statistical significance, there was an estimated exponential daily tumor size increase of 1.45 % compared to the control.
Transcriptomic insights into the oncogenic impacts of the MT-ND5 mutations
2.5.
Given the observed oncogenic phenotypes, we conducted a gene set enrichment analysis (GSEA) on the transcriptome data of HEK293 cells to identify pathways responsive to the induced heteroplasmic MT-ND5 mutations. RNA sequencing data representing three levels of heteroplasmy (34 %, 22 %, and control at 0 %) were utilized for this analysis. The enriched pathways revealed a consistent pro-cancer influence. There was an observed upregulation in pathways linked to cell migration and invasion, including focal adhesion, cell adhesion molecules (CAMs), axon guidance, and ECM-receptor interaction pathways, implying an augmented migrative and invasive capacity (Fig. 5A). The heteroplasmic MT-ND5 mutations also promote genomic instability. This was supported by the downregulation of the base excision repair pathway, DNA replication pathway and nucleotide excision repair pathway (Fig. 5A). Furthermore, decreased peroxisome pathway and glutathione metabolism pathway (Fig. 5A) indicated an exhausted cellular ability to defend against ROS, agreeing with our observation of increased sensitivity to menadione induced ROS stress (Fig. 3B). Finally, an increase in the phosphatidylinositol signaling system pathway (Fig. 5A) hints at modified cell survival and growth, while a rise in ATP-binding cassette (ABC) transporters suggests a heightened drug resistance potential.
Interestingly, there was an enrichment in multiple pathways associated with neurodegenerative diseases, including Amyotrophic Lateral Sclerosis (ALS), Huntington’s Disease, Alzheimer’s Disease, and Parkinson’s Disease. This aligns with previous findings linking mitochondrial dysfunction to neurodegenerative diseases.^62–65^
Additionally, we plotted protein-protein interaction (PPI) networks to visualize interactions among differentially expressed genes (DEGs). We found that a majority of the affected genes were nuclear mitochondrial genes clustered in the center of the network (Fig. 5B). This finding indicates that the induced MT-ND5 mutations primarily impacted nuclear-encoded mitochondrial genes. Other closely related identified clusters were functionally enriched for ribosome, Golgi apparatus, and endoplasmic reticulum in the KEGG gene set (Fig. 5B). The proximity of these clusters to the central nuclear mitochondrial gene cluster is in line with expectations, as these organelles are highly reliant on, or functionally related to, mitochondria.^66,67^ It should be noted that the migration/invasion-related cluster, which is functionally enriched for ECM-receptor interaction and PI3K-Akt signaling pathways, was predominantly upregulated (boxed in Fig. 5B). This observation is consistent with the upregulated pathways identified in GSEA (Fig. 5A). However, the upregulated migration/invasion-related cluster is not closely connected to the central, predominantly downregulated clusters. This suggests that the linkage between MT-ND5 mutation–influenced mitochondrial proteins and the migration/invasion-relevant cluster remains largely unexplored. Alternatively, the upregulation of genes within this migration/invasion-related cluster might be an indirect consequence of the MT-ND5 mutations.
Hence, we searched for potential indirect effects of the MT-ND5 heteroplasmy. Our biochemical assays suggested that NAD^+^ (Fig. 3C), as opposed to total ATP (Fig. 3D), served as a critical limiting factor in recovery from the stabilizing MT-ND5 heteroplasmy. This insight led us to investigate enzymes involved in NAD ^+^ metabolism, with a particular focus on the NAD^+^-dependent class III histone deacetylase (HDAC), especially SIRT6. SIRT6 is notable not only for its role in regulating glycolytic enzymes^68^ but also for its heightened sensitivity to NAD ^+^ levels, evidenced by having the lowest Km (Michaelis constant) among all sirtuins.^69^
An enrichment analysis of the upregulated DEGs revealed a significant enrichment for genes regulated by H3K9 acetylation (H3K9ac) (Fig. 5C). This result suggests reduced SIRT6 activity, corroborated by our observations of decreased SIRT6 expression (LogFC: −0.3170546, FDR: 0.02712718) and diminished NAD^+^ concentrations (Fig. 3C).
This finding implies a link between MT-ND5 mutations and altered epigenetic regulation, potentially mediated through SIRT6 dysfunction. The pronounced enrichment of H3K9ac-regulated genes among upregulated DEGs highlights the impact of SIRT6 dysregulation, likely exacerbated by reduced NAD^+^ availability. This pathway, connecting mitochondrial dysfunction to epigenetic alterations, offers a plausible explanation for the increased pro-cancer effects observed following MT-ND5 mutations.
To generalize this model, we extended our research to breast cancer. Notably, the basal subtype of breast cancer exhibits enhanced invasiveness and aggressiveness compared to all other subtypes.^70^ We aimed to investigate whether H3K9ac-regulated pathways are enriched in the basal subtype, potentially accounting for its higher metastatic propensity compared to other subtypes.
Using proteomics data^71^ from the National Cancer Institute’s Clinical Proteomic Tumor Analysis Consortium (CPTAC),^72^ we analyzed differentially expressed proteins (DEPs) in basal subtype breast cancer against other subtypes. Our analysis concentrated on histone modifications and revealed a consistent enrichment for both H3K9ac and H3K4 trimethylation (H3K4me3) (Fig. 5D), aligning with literature that associates these histone modifications with increased metastasis.^73^ This complements our observations that increased H3K9ac histone modifications, potentially resulting from mitochondrial dysfunction and a subsequent decreased SIRT6 activity (Fig. 5E), increased oncogenic potential. Moreover, the involvement of H3K4me3, which requires mitochondrial metabolite alpha-ketoglutarate (aKg) as a cofactor, further demonstrates the significant role of mitochondrial function in metastasis.
Discussion
In this study, we comprehensively evaluated cellular and mitochondrial responses to induced MT-ND5 truncating mutations across various heteroplasmy levels. By controlling the nuclear genome, we isolated mtDNA variants to assess their oncogenic effects. Enhanced oncogenic potential was consistently observed across all assays and heteroplasmy levels.
These mtDNA variants induced cell cycle arrest in the G2/M phase and diminished DNA repair pathways, collectively suggesting increased genomic instability. Additionally, our observations of impaired oxidative phosphorylation, elevated mitochondrial ROS, reduced ROS scavenger pathways, and increased menadione-induced apoptosis rates indicate heightened cellular ROS and a compromised defense against ROS. The elevated cellular ROS resulting from impaired oxidative phosphorylation likely contributes to the oncogenic phenotype we observed.^4,45,74^
Furthermore, we monitored the total ATP and NAD^+^/NADH ratio of the cells. As MT-ND5 heteroplasmy levels decreased, total cellular energy approached normalization near plateaued heteroplasmy. However, the NAD^+^/NADH ratio continued to deteriorate, with the rate of decline slowing and eventually stabilizing as heteroplasmy stabilized within HEK293 cells. This suggests that the NAD^+^/NADH ratio, rather than total ATP levels, may be a critical factor in recovery from MT-ND5 mutations, possibly explaining the increased demand for NAD ^+^ associated with the Warburg effect.^7,75^ A low NAD^+^/NADH ratio also drives the production of 2-hydroxyglutarate (2-HG),^76–78^ which can inhibit α-ketoglutarate (α-KG)-dependent dioxygenases, including DNA demethylase TET and JMJD family histone demethylase, causing epigenetic remodeling. Additionally, increased glycolytic capacity was only detected after the total cellular ATP level normalized, indicating that this increase in glycolytic capacity is not driven by energy crisis, but likely by continuing NAD^+^ deprivation. Our findings align with the modern understanding of the Warburg effect, which proposes that the preferential use of aerobic glycolysis in cancer cells, even under normoxic conditions, primarily serves to maintain optimal NAD ^+^ levels rather than to maximize ATP production or biomass synthesis.^7,75^
Multiple studies have indicated that mitochondrial fitness is crucial for the metastatic potential of established cancer cells, with enhanced mitochondrial function correlating with increased metastatic capacity.^4–6^ Collectively, these findings suggest that high mitochondrial fitness is preferentially maintained over dysfunctional mitochondria in established cancer cells. This observation appears contradictory to the numerous tumor-specific mtDNA mutations, including deleterious ones, detected in association tests utilizing sequencing data from established cancer samples.^33,39^ Based on our observations that MT-ND5 mutations are oncogenic in non-cancerous cells, we propose that the mtDNA mutations observed in cancer tissues may be remnants from the initial stages of oncogenesis, where mtDNA mutations and mitochondrial dysfunction drive the onset of cancer. Within this scenario, deleterious mtDNA variants exhibit a pleiotropic role in cancer: while they contribute to the early stages of cancer formation, they become less adaptive in established cancer cells.
Similarly, current reports suggest that cancer cells maintain a higher NAD^+^/NADH ratio than non-cancerous cells,^79^ in part through increased NAMPT activity to enhance NAD ^+^ production.^80,81^ At first glance, this contrasts with our observation of a lower NAD^+^/NADH ratio and enhanced oncogenic capacity. However, our study focuses on the early responses to MT-ND5 mutations (within two months) in non-cancerous cells, and the long-term cellular adaptation to chronic NAD^+^ deprivation remains unknown. We speculate that the upregulation of NAMPT and increased glycolysis in established cancers may serve as compensatory mechanisms to restore NAD^+^ levels in response to Complex I deficiency caused by MT-ND5 mutations. This aligns with our hypothesis that, while mitochondrial dysfunction and NAD^+^ depletion contribute to oncogenesis, they may be actively selected against in fully transformed cancer cells.
Given the lasting impacts of the MT-ND5 mutations on cellular NAD^+^/NADH ratio, we propose NAD^+^-dependent enzymes, especially the class III HDAC enzyme SIRT6, as promising targets for future research into epigenetic signatures. We propose a model in which decreased NAD ^+^ levels and reduced SIRT6 expression lead to diminished SIRT6 activity. This decrease in SIRT6 activity results in elevated H3K9ac levels, which subsequently upregulate DEGs associated with enhanced migration and invasion phenotypes, despite the energy crisis stemming from defective mtDNA variants.
Theoretically, deleterious heteroplasmy should be mitigated via mitophagy or apoptosis.^55^ However, our findings of the plateaued heteroplasmy suggest an incapacity of the cells to completely eliminate the deleterious mtDNA variants. This incapacity may be due to recovered total cellular ATP and increased mitochondrial fusion. Moreover, consistent observations of baseline apoptosis rates and unaltered cellular growth rates in two-dimensional cultures suggest that reductions in mtDNA heteroplasmy are attributable to mitochondrial quality control mechanisms, rather than changes at the cellular level. Furthermore, we observed that the single-cell-derived soft agar colonies maintained the peak heteroplasmy as seeding heteroplasmy. It appears that factors unique to a two-dimensional growth matrix, such as direct cell-to-cell interactions or specific metabolic requirements, contribute to the decay of heteroplasmy levels. The cell line–specific tolerance to mtDNA mutation induction implies nuclear control over mtDNA variants.
Based on the oncogenic effects of heteroplasmic MT-ND5 mutations and the observed plateau in heteroplasmy levels, it remains unclear whether these mutations undergo active selection or persist passively due to impaired mitochondrial quality control. Specifically, the plateaued heteroplasmy could reflect a dynamic equilibrium between mtDNA quality control mechanisms removing mutant mtDNA and a selective advantage promoting its expansion. Alternatively, the persistence of heteroplasmy below a functional threshold may prevent efficient elimination, resulting in passive retention rather than active selection.^55^ Notably, previous studies have reported positive selection for MT-ND5 truncating mutations in kidney, colorectal, and thyroid cancers, where mutant mtDNA is enriched in tumors relative to surrounding tissues.^39^ In addition, recent discoveries have revealed mitochondrial heterogeneity within cells, with some mitochondria primarily supporting oxidative phosphorylation (OXPHOS) and others facilitating reductive biosynthesis.^82^ This functional diversity may enhance metabolic flexibility, enabling cells to adapt to fluctuating environmental conditions. Therefore, under certain conditions, mutant mtDNA may confer a clonal advantage during tumor evolution, while in other contexts, maintaining heteroplasmy may enhance metabolic flexibility.
Despite the limited low to moderate heteroplasmy levels tested in this study, mitochondrial dysfunction was consistently detected. Our results demonstrate that the mtDNA variants promote aerobic fermentation and are oncogenic, partly aligning with Warburg’s original hypothesis on the mitochondrial origin of cancer. Theoretically, other truncating mutations in MT-ND5 would contribute similarly. Given the observed incapacity of both the HEK293 and the MCF12A cell lines to completely eliminate mutant mtDNA at lower heteroplasmy levels, and considering the prevalence of heteroplasmic deleterious mtDNA variants even in healthy individuals as reported by,^47^ we suggest a more pivotal role for deleterious mtDNA variants in the initial phases of cancer progression. Specifically, the accumulation of mtDNA mutations initiates mitochondrial dysfunction, which results in increased cellular ROS, altered epigenetics and enhanced genomic instability. These alterations may cumulatively promote the development of nuclear mutator phenotypes, an established modern hypothesis for cancer initiation.^83^
While our study did not directly assess the effects of ROS scavengers or NAD ^+^ supplementation on MT-ND5 mutation-induced tumorigenesis, the existing literature suggests that both approaches could play a role in mitigating oncogenesis. ROS scavengers have been shown to reduce oxidative stress–induced hyperproliferation^84^ and genomic instability^85,86^ in cancer models. On the other hand, it has also been reported that antioxidant NAC promotes melanoma cell metastasis.^87^ This suggests that the role of ROS scavengers in tumorigenesis may be context- and tumor stage-dependent. Similarly, NAD ^+^ replenishment has been linked to enhanced mitochondrial function,^88,89^ improved cellular repair mechanisms,^90^ and suppression of tumor growth in certain contexts.^91,92^ Future studies are warranted to explore whether these interventions can counteract the oncogenic effects of MT-ND5 mutations and whether they hold promise as preventive strategies for mitochondrial-driven cancers.
Our investigation was limited to specific mtDNA variants in MT-ND5 and did not extend to other mitochondrial genes or mutation types, such as missense mutations. The monitoring of heteroplasmy events was restricted to two months, and cellular phenotypes beyond this period were not examined. Considering the chronic and progressive nature of oncogenesis, extending the duration of these studies could provide more definitive evidence of the causal relationship between mtDNA variants and oncogenesis. Further exploration of the epigenomic landscape, especially at the single-cell level where heteroplasmy is not averaged, may further elucidate the mechanisms underlying increased oncogenic potential.
Although our study demonstrated the oncogenic effects of MT-ND5 mutations in 2D cell culture and in immunocompromised NOD (non-obese diabetic) mice, we proposed that this simplification may underestimate the true impact in vivo. First, the nuclear genome of a cell line—HEK293 cell line in this study—is oversimplified compared to the nuclear variability in individuals. Variable nuclear genomes interacting with heteroplasmic MT-ND5 mutations generate a range of phenotypic variations. Under selective pressures, certain phenotypes may confer a survival advantage, potentially enhancing the oncogenic effects of the MT-ND5 mutations over time. Second, both 2D growth medium and NOD mice provide levels of glucose in excess of physiological levels and a rich oxygen supply, which do not reflect the nutrient competition and hypoxic microenvironments that cancer cells face in vivo. Heteroplasmic MT-ND5 mutations may confer an adaptive advantage by enabling metabolic plasticity, and this advantage is more pronounced in physiological tumor environments. Additionally, emerging studies suggest that cancer cells can hijack healthy mitochondria from immune cells while dumping dysfunctional mitochondria into T cells, thereby facilitating immune evasion.^93–95^ Cells carrying heteroplasmic MT-ND5 mutations may exploit similar mechanisms to escape immune surveillance, which was not captured in our immune-deficient model. Future studies utilizing non-cancerous murine cell lines and immunocompetent mice will be essential to elucidate the long-term oncogenic effects of MT-ND5 mutations in a more physiologically relevant context.
In conclusion, our research establishes a causal link between specific deleterious mtDNA variants and oncogenesis. We demonstrated that even moderate levels of these mutations result in impaired mitochondrial function, increased aerobic fermentation (the Warburg effect), and an enhanced oncogenesis phenotype. Our characterization of the cellular and mitochondrial responses to the heteroplasmic mtDNA variants advances the understanding of fundamental mitochondrial biology. Our findings not only elucidate the pivotal role of mtDNA mutations in oncogenesis but also pave the way for cancer prevention and early detection, as well as future investigations into targeted therapies that may mitigate the oncogenic potential of the common deleterious mtDNA mutations.
Methods
Cell culture
4.1.
The HEK293, HEK293T, HeLa, MDA-MB-231, and MCF-7 cell lines were cultured in DMEM (Gibco, #11965118) supplemented with 10 % FBS (Avantor Seradigm, #1300–500) and 100 U/ml Penicillin-Streptomycin (Gibco, #15140122). The CRL-1790 line was maintained in MEM (Gibco, #11095080) with identical supplementation. The MCF10A and MCF12A lines were cultured in DMEM/F12 (Gibco, #11320033) supplemented with 10 μg/ml recombinant insulin (Sigma, #45-I0516–5 ML-EA), 20 ng/ml EGF (Peprotech, #AF-100–15), 100 ng/ml cholera toxin (Sigma, #45-C8052–1 MG), 500 ng/ml hydrocortisone (Sigma, #45-H0888–1G-EA), 5 % Horse serum (Life Technologies, #26050088), and 100 U/ml Penicillin-Streptomycin. All cell cultures were maintained in a humidified incubator at 37 °C with 5 % CO2. Regular screening for mycoplasma was conducted using the LOOKOUT MYCOPLASMA PCR DETECTION KIT (Sigma, #45-MP0035–1 KT-EA).
For experiments examining supplement effects, reagents were added to achieve final concentrations of 1 mM sodium pyruvate (Gibco, #11360070), 1x non-essential amino acids (Gibco, #11140050), 1x GlutaMAX (Gibco, #35050061), with or without 50 μg/ml uridine. When examining the effects of TGFB1 on MCF12A cells, 20 ng/ml of TGFB1 (Gibco, #PHG9204) was supplemented.
Plasmid construction
4.2.
Polymerase chain reaction (PCR) was performed using Phusion Hot Start II DNA Polymerase (Thermo Scientific, #F549L). DdCBE splits were synthesized as gene blocks and codon optimized for human expression (Genscript). The mitoTALE sequences were engineered employing the TALE toolbox (Addgene kit # 1000000019), following the detailed protocol.^96^ Both DdCBE splits alone and those coupled with mitoTALE were cloned into the pCMV vector backbone, ensuring an overlap of 20–25 nucleotides (nts) via Gibson Assembly (New England BioLabs, Catalog #E2621L). Subsequent to the Gibson Assembly, the products were column-purified prior to their introduction into Stbl3 Chemically Competent E. coli (Thermo Scientific, Catalog #C737303) to preclude any buffer incompatibilities. The plasmids destined for mammalian transfection were purified employing ZymoPURE II Plasmid Midiprep Kits (Zymo Research) following the manufacturer’s protocol. The DNA sequences of all the plasmids utilized in this study are listed in the supplementary materials.
Mitochondrial DNA editing via transient plasmid transfection
4.3.
Cells were enzymatically dissociated for transfection using TrypLE Express Enzyme (Gibco, #12605028) one day before the procedure, and their numbers were subsequently quantified with a TC20 Automated Cell Counter (Bio-Rad). We then seeded 3 × 10^5^ cells per well into 6-well plates (VWR International, #10062–892). The following day, for transfection, 4 μg of plasmids was introduced into the cells with Lipofectamine 2000 (Invitrogen, #11668027), in line with the manufacturer’s protocols. The MT-ND5 heteroplasmic group (n) received two plasmids, 1L-1397N and 1R-1397C, each at 2 μg, equipped with the necessary components for precise mitochondrial DNA (mtDNA) editing at predetermined sites. Control group 1 (c1) was transfected with a single plasmid, 1L-1397N, at 4 μg, serving as a baseline to evaluate any inherent effects resulting from the transfection process. Control group 2 (c2) was transfected with four plasmids, each at 1 μg, to assess TALE array sequence (TAS)-dependent or independent off-target effects on the nuclear genome (Figure A.6B). This group included TAS-containing plasmids 1R-1397C and 1L-1333C, alongside DddA split-only plasmids 1397N and 1333N. Although the TAS-paired plasmids were predicted to be inactive in mitochondrial editing due to mismatches in the deaminase splits, the collective use of these four plasmids was engineered to emulate the nuclear off-target effects observed in the MT-ND5 heteroplasmic group (n), thus allowing for a controlled comparison.
MT-ND5 heteroplasmy quantification
4.4.
The DNA from cultured cells was isolated using the Wizard Genomic DNA Purification Kit (Promega) or by direct boiling with RNase A and Proteinase K. Following purification, the DNA was amplified with Phusion Hot Start II DNA Polymerase (Thermo Scientific, #F549L) using the following primers for PCR: A19 (5’-TTACCGAGAAAGCTCACAAGAA-3’) and B22 (5’-CGTGAAGGTAGCGGAT GATT-3’). The PCR cycling conditions were set as follows: an initial hold at 98 °C for 30 s, followed by 35 cycles of denaturation at 98 °C for 10 s, annealing at 62 °C for 30 s, and extension at 72 °C for 1 min and 45 s, with a final extension step at 72 °C for 10 min. The resulting PCR products were then electrophoresed on a 0.8 % agarose gel in TBE buffer to confirm the presence of a unique band.
Post-electrophoresis, PCR products were purified using either the Monarch PCR & DNA Cleanup Kit (NEB, #T1030L) or the 96 DNA Clean & Concentrator-5 (Zymo, #11–306A) for high-throughput applications. The purified DNA concentrations were determined spectrophotometrically using a NanoDrop instrument, after which the samples underwent Sanger sequencing, using A19 for primer. Relative fluorescence intensities of the wildtype and mutant nucleotides were subsequently read with SnapGene software. Heteroplasmy levels were calculated as follows:
Glycolytic assays
4.5.
Mito-stress and glycolytic assays were conducted on the Seahorse XF24 (Agilent) according to the manufacturer’s guidelines. Assay plates were pre-treated with poly-L-serine (Sigma), and 4 × 10^4^ cells were seeded 24–48 h prior to the assay. Seahorse XF DMEM, pH 7.4 (Agilent, #103575–100), was used as the assay medium. For the glycolytic assay, the medium composition included 10 mM glucose, 1 mM sodium pyruvate, and 2 mM glutamine, with drugs added at final concentrations of 0.5 μM Antimycin, 0.5 μM Rotenone, and 50 mM 2-DG. Following the Seahorse assay, cells were stained with Hoechst33342 (Thermo Fisher, #H3570) and counted using the Celigo Image Cytometer (Nexcelom). Both OCR and ECAR values were normalized to the total cell count.
Estimation of glycolytic ATP (glycoATP) and mitochondrial ATP (mitoATP) was performed using the glycolytic assay readout. Detailed calculation methods are provided in the supplementary materials.
Cell growth rate quantification
4.6.
Total cell count with at least triplicates were counted for at least 4 timepoints to monitor the cell growth rate. Specifically, cells were seeded at 1000 cells/well in a 96 well plate, with at least 15 wells seeded for each treatment. This allowed longitudinal cell number tracking with triplicates for a maximum of 5 timepoints. After overnight seeding in standard cell growth condition, the total cell number was counted with Celigo image cytometer and Hoechst 33342 dye.
To assess the impact of MT-ND5 heteroplasmy on cell growth, a linear regression model was applied using the logarithm of cell counts as the response variable. The model was structured to include interactions between time (measured in hours) and treatment, enabling the investigation of how treatment effects evolve over time. In the case of MCF12A cells, where treatments involved combinations of MT-ND5 and TGFB1, a linear regression model was formulated with interaction terms for both MT-ND5 and TGFB1. These terms interact with Time, capturing both the main effects of time and of treatments as well as their interaction effects. Specifically,
.
The fitting was conducted in R. The statistical significance of the treatment was determined from the model’s summary.
Total cellular ATP quantification
4.7.
To validate the total cellular ATP estimated from glycolytic assays, total cellular ATP was measured using the CellTiter-Glo 2.0 Cell Viability Assay (Promega, #G9241), with the procedure carried out according to the manufacturer’s instructions. Luminescence readings were taken with a SpectraMax M3 microplate reader, utilizing a white 96-well plate. Cells were seeded at a density of 2 × 10^4^ cells per well, 24 h prior to the assay, and at least five wells were designated for normalization purposes. For normalization, the total number of cells was accurately quantified using a Celigo cell cytometer, with Hoechst dye employed to facilitate the cell counting process.
NAD+/NADH ratio quantification
4.8.
The NAD^+^/NADH ratio was determined using the NAD/NADH-Glo Assay (Promega, #G9071), adhering to the manufacturer’s protocols. Specifically, 2 × 10^4^ cells were plated 24 h before the assay. Luminescence was longitudinally measured with a SpectraMax M3 microplate reader in a white 96-well plate. The slope of the fitted curve, representing luminescence as a function of time, was utilized to estimate the quantities of NAD^+^ and NADH, which were then used to calculate the NAD^+^/NADH ratio. The standard error of the NAD^+^/NADH ratio was derived from the standard errors of the fitted slopes for NAD^+^ and NADH, using the delta method for error propagation. To evaluate the differences in the NAD^+^/NADH ratio among the groups, based on the obtained ratios and their respective standard errors, an ordinary one-way ANOVA was employed. The post hoc analysis for multiple comparisons was corrected using the two-stage step-up method of Benjamini, Krieger, and Yekutieli.
Apoptosis assay
4.9.
We used the Dual Apoptosis Assay Kit with NucView 488 Caspase-3 Substrate & Sulforhodamine 101-Annexin V (Biotium, #30030) according to the manufacturer’s protocol on an Attune NxT flow cytometer (Thermo Fisher). Cells were seeded at 2 × 10^5^/well in a 24-well plate, with or without 10 μM menadione for 12 h. Data analysis was conducted in FlowJo.
Transwell invasion/transwell migration assays
4.10.
For the transwell invasion assay, a 24-well plate with an 8.0-μm Matrigel invasion chamber (Corning, #354480) was employed. The transwell migration assay utilized 8.0-μm cell culture inserts (Corning #353097). Both assays were conducted in line with the manufacturer’s guidelines. Specifically, 2.5 × 10^4^ cells were seeded per well for HEK293. Normal complete cell culture medium was used as a chemoattractant, with 10 % FBS supplementation.
After incubating for 16–24 h in a cell incubator, cells were either stained with CellTracker Green CMFDA Dye (Life technologies, #C2925) for live imaging. Live imaging was conducted instead of fixation with crystal violet to prevent cell detachment, as HEK293 cells exhibit loose attachment. Imaging was executed using a Celigo cell cytometer. All captured images were stitched together and exported at a resolution of 3 μm/pixel. Analysis in ImageJ/Fiji quantified the total number of invaded or migrated cells. The ‘Trainable Weka’ plugin was employed for accurate cell identification against the background pores in whole-mount images. Representative cells were manually labeled to guide Trainable Weka’s supervised learning, producing a probability map. This map was then thresholded for cell counting. ImageJ macros were used for both thresholding and quantification, with the corresponding scripts provided in the supplementary materials.
Mitochondrial membrane potential and mitochondrial oxidative stress
4.11.
To assess mitochondrial ROS stress and mitochondrial membrane potential, MitoSOXRed (Thermo Fisher, #M36008) at 5 μM and TMRM (Thermo Fisher, #T668) at 20 nM were employed, following the manufacturer’s guidelines for each, respectively. Cells were seeded in a 35 mm glass bottom plate (Mat Trek) and were allowed to adhere for 24 h prior to imaging. Live imaging was performed on the LionHeart imaging station (Agilent) with a 40x objective at 37 °C in phenol red–free DMEM growth medium. Along with the mitochondrial dyes, Hoechst33342 was introduced. This dye was used as the primary mask and was extended by 10 μm to serve as the secondary mask, allowing for the determination of the integral red fluorescence intensity of each cell. Analysis of this fluorescence was carried out using the BioTek Gen5 software (Agilent). The median fluorescence from each field was documented, and at least 10 distinct, non-overlapping fields were examined for each treatment. Statistical tests were performed with GraphPad Prism 9.
Cell cycle analysis
4.12.
Cells were harvest and counted with a TC20 Automated Cell Counter (Bio-Rad) to ensure >95 % cell viability. Then the cells were washed and fixed with ice-cold methanal. Post fixation, the cells were washed twice again and stained with a solution containing 50 μg/mL propidium iodide (PI) and 100 μg/mL RNase A, followed by incubation at 37 °C for 30 min in the dark. Stained cells were then analyzed on an Attune NxT flow cytometer (Thermo Fisher).
Soft agar assay
4.13.
Soft agar assay was conducted as outlined in a previously reported method,^97^ with minor adjustments. Specifically, noble agar solutions of 1 % and 0.6 % were prepared in deionized water and subsequently autoclaved. A 2x concentration of DMEM medium was formulated from powder and sterilized using a 0.2 μm filter. On the assay day, a fresh 0.5 % bottom agar was made by mixing equal parts of the 1 % agar and 2x complete growth medium, which had twice the usual supplements. This was allowed to set at room temperature in the cell hood for at least 2 h. Log-phase cells were harvested and dissociated with Tryple, followed by passing through a 40 μm strainer twice through a 25 gauge needle to ensure a single-cell solution. 2000 cells/well were incorporated into a mixture of prewarmed 2x complete growth medium and 0.6 % agar, producing a 0.3 % top agar. This top layer was then left to solidify for a minimum of 1 h at room temperature in the hood. Subsequently, the plates were placed in the cell incubator at 37 °C with 5 % CO2 for 12 days, with 100 μL of complete growth medium added every 3 days to prevent drying. At the end of the incubation, 200 μL of 1 mg/ml nitroblue tetrazolium chloride (NBT) solution was added to each plate, and they were incubated overnight. Imaging was performed using Celigo image cytometer. Statistical tests were performed with GraphPad Prism 9.
Mitochondrial morphology
4.14.
Cells were stained with 20 nM TMRM and Hoechst33342 as per the manufacturer’s instructions. Live imaging of stained cells was performed in phenol red–free complete medium using a LionHeart imaging station (Agilent) at 37 °C with a 100x objective. We captured Z-stacks of a minimum of 25 slices, each 100 nm deep. From each imaging field, subsets of Z-stacks (273 pixels × 293 pixels × 25 slices) containing mitochondria from a single cell were chosen for analysis in ImageJ, following previously established methods.^98^ These selected Z-stacks were considered as the ‘cell’ for later analysis.
The cell stacks underwent deconvolution using DeconvolutionLab2 in ImageJ, utilizing a theoretical Point-Spread Function (PSF) produced by the ‘PSF generator’ plugin. The Richardson-Lucy TV algorithm was applied, with a regularization value of 0.0001 and 30 iterations, consistent with the established method.^98^ Post-deconvolution, the image edges were cropped to mitigate edge effects during deconvolution. The 3D stacks were then converted to 2D images via maximal projection. These 2D images were subsequently analyzed using the ‘Mitochondrial Analyzer’ plugin to assess cell morphology metrics. The analysis parameters included the ‘weighted mean’ threshold method, a block size of 1.45 μm, and a C-value of 8.
Spectrometric assessment of the enzymatic activities of mitochondrial complexes
4.15.
Mitochondrial complex activity was assessed with modifications to previously reported protocols.^99,100^ Mitochondria were isolated from an equal number of cultured cells across all samples using the Qproteome Mitochondria Isolation Kit (Qiagen, #37612), adhering to the manufacturer’s standard procedure. The isolated mitochondria were resuspended in a hypotonic buffer (10 mM Tris-HCl), snap-frozen in liquid nitrogen, and then stored at −80 °C until spectrometric analysis could be performed. A fraction of the resuspended mitochondria was assayed for total protein content using the BioRad Protein Assay Kit, following the manufacturer’s guidelines. On the day of the spectrometric assessment, the mitochondrial suspensions underwent three freeze-thaw cycles in the hypotonic buffer to ensure membrane disruption and release of the mitochondrial enzymes.
The spectrometric readings were taken using the SpectraMax M3 (Molecular Devices) microplate reader, set to 37 °C, in black-bottom 96-well plates. All required buffers and reagents were prepared in alignment with the established protocols.^99^ Longitudinal spectrometric measurements were carried out to evaluate the activities of Complex I (NADH:CoQ oxidoreductase), Complex IV (cytochrome c oxidase), and the internal control enzyme citrate synthase, as detailed in the modified method.^100^
Enzymatic activities and their standard errors were calculated from the slopes of the longitudinal readouts. Both Complex I and Complex IV activities were normalized against citrate synthase activity to account for variations in mitochondrial content. The standard errors of the normalized activities for Complexes I and IV were computed using the delta method, which considers the propagation of errors through calculations involving multiple variables. Statistical analysis of group differences in complex activities was performed using Brown-Forsythe and Welch ANOVA tests, with post hoc multiple comparisons corrected by Dunnett’s T3 method to control for type I errors.
RNA isolation, library preparation, sequencing, and analysis
4.16.
Total RNA was isolated from cultured cells using TRIzol Reagent following the manufacturer’s instructions. The RNA was spectrophotometrically quantified using Nanodrop. Prior to RNA-sequencing, RNA integrity was assessed using the Fragment Analyzer (Agilent), ensuring all samples exhibited an RNA quality number exceeding 9.0. Libraries were prepared using the NEBNext Ultra II [Directional] RNA PolyA enrichment kit as per the manufacturer’s guidelines. Subsequent quantification of each library was performed using the Qubit (dsDNA HS kit; Thermo Fisher), and size distribution was ascertained with a Fragment Analyzer (Agilent) before pooling. Sequencing was conducted on a NovaSeq platform, producing a minimum of 20M 150 nucleotide paired-end reads for each library. Reads underwent trimming to remove low-quality and adaptor sequences with the aid of TrimGalore v0.6.0,^101^ a tool that incorporates both cutadapt^102^ and fastQC.^103^ These reads were then aligned to the reference transcriptome (Ensembl GRCh38) utilizing STAR v2.7.0.^104^
The EdgeR package^105^ facilitated the filtering and normalization of raw read counts. Analyses were subsequently conducted using a linear model tailored to account for variations in heteroplasmy levels, with adjustments corresponding to each 34 % change in heteroplasmy. This specific threshold was determined based on the highest level of heteroplasmy observed in the HEK293 cell line. Following this, dispersion values were computed. A likelihood ratio test was then applied to identify genes that exhibited significant correlations with the heteroplasmy levels.
Gene set enrichment analysis (GSEA)
4.17.
Preranked GSEA was conducted with HEK293 RNA-seq data, ranking with signed log(P value) generated from RNA seq analysis with EdgeR, as previously described. The ‘fgsea’ library was employed on the KEGG pathways gene set. We adopted an adjusted p-value threshold of < 0.05 to determine the significance of the enriched pathways.
Gene ontology was also conducted. Briefly, for the HEK293 RNA-seq data, DEGs were identified as described in the RNA-seq analysis subsection, with EdgeR and a GLM model. To capture nuanced change following the MT-ND5, a log2(Fold change) of 0.2 was chosen to cutoff for the upregulated DEGs, combining a FDR<0.05. The upregulated DEGs were then pasted into the online tool Enrichr^106–108^ to identify enriched pathways in the Epigenomics Roadmap HM ChIP-seq gene set. Similarly, public breast cancer proteome data^71^ from the Clinical Proteomic Tumor Analysis Consortium (CPTAC)^72^ were used. Differentially expressed proteins (DEPs) of the basal subtype breast cancer against all other breast cancer subtypes were identified with cutoffs of 5 and 2 for log(FDR) and —log2(Fold Change)—, respectively.
Protein-protein interaction (PPI)
4.18.
The protein-protein interaction map was constructed using Cytoscape (version 3.10.1).^109^ Differentially expressed genes (DEGs) were identified with the EdgeR package as described above, requiring an FDR of less than 0.05 for inclusion in the PPI analysis. These DEGs were subsequently analyzed using the STRING database to establish the interaction network. The network was organized into clusters by applying the Markov Cluster Algorithm (MCL), which is integrated within the STRING tool. To visualize the resulting subclusters, a force-directed layout was implemented in Cytoscape. The node filling color used a continuous scale, with red indicating upregulated DEGs and blue indicating downregulated DEGs.
Mice xenograft
4.19.
NOD.Cg-Prkdc^scid^ Il2rg^tm1Wjl^/SzJ (NSG) immunocompromised mice (strain #005557) were obtained from Jackson Laboratories and subsequently bred in-house at Cornell University, Ithaca, as part of the institution’s animal breeding program. The transplantation and subsequent tumor monitoring were conducted by the Progressive Assessment of Therapeutics (PATh) Patient-Derived Xenograft (PDX) Facility at Cornell University. This study utilized twelve young adult female NSG mice, which were allocated equally into control and treatment groups (n=6 per group). Prior to transplantation, the cells were cultured in an antibiotic-free growth medium for two weeks and assessed for mycoplasma contamination. After harvest, the cells were suspended in cold phosphate-buffered saline (PBS) and maintained on ice before being combined with an equal volume of Matrigel. A 200 μL mixture containing 3 × 10^6^ cells was administrated subcutaneously into the mice. Tumor weight and size were monitored bi-weekly or tri-weekly using calipers, with the tumor volume calculated using the following formula: Volume = (Length × Width^2^) × 0.5.
For statistical analysis, we employed a linear mixed-effects model with restricted maximum likelihood (REML) estimation using the gathered longitudinal tumor volume data. The model specified log-transformed tumor volume (log10[Volume]) as the dependent variable and included fixed effects for treatment group, time (in days), and their interaction. We incorporated a random intercept to account for the repeated measures and intrinsic variability among the individual mice. The regression was conducted in R with the ‘lme4’ and ‘lmerTest’ packages.
Supplementary Material
Figure Supplement 1
Supplement_2_plasmid_sequence
The reference list from the paper itself. Each links out to its DOI / PubMed record.
- 1Warburg O. Über den Stoffwechsel der Carcinomzelle. Naturwissenschaften. 1924;12:1131–1137. 10.1007/BF 01504608. · doi ↗
- 2Warburg O. On the origin of cancer cells. Science. 1956;123:309–314.13298683 10.1126/science.123.3191.309 · doi ↗ · pubmed ↗
- 3Weinhouse S. On respiratory impairment in cancer cells. Science (New York, N.Y.). 1956;124:267–269. 10.1126/science.124.3215.267.13351638 · doi ↗ · pubmed ↗
- 4Weinberg F, Hamanaka R, Wheaton WW, Mitochondrial metabolism and ROS generation are essential for Kras-mediated tumorigenicity. Proc Natl Acad Sci USA. 2010;107:8788–8793.20421486 10.1073/pnas.1003428107 PMC 2889315 · doi ↗ · pubmed ↗
- 5Tan AS, Baty JW, Dong L-F, Mitochondrial genome acquisition restores respiratory function and tumorigenic potential of cancer cells without mitochondrial DNA. Cell Metab. 2015;21:81–94.25565207 10.1016/j.cmet.2014.12.003 · doi ↗ · pubmed ↗
- 6Viale A, Pettazzoni P, Lyssiotis CA, Oncogene ablation-resistant pancreatic cancer cells depend on mitochondrial function. Nature. 2014;514:628–632.25119024 10.1038/nature 13611 PMC 4376130 · doi ↗ · pubmed ↗
- 7Luengo A, Li Z, Gui DY, Increased demand for NAD+ relative to ATP drives aerobic glycolysis. Mol Cell. 2021;81:691–707.e 6. 10.1016/J.MOLCEL.2020.12.012.33382985 PMC 8315838 · doi ↗ · pubmed ↗
- 8Yao C-H, Wang R, Wang Y, Kung C-P, Weber JD, Patti GJ. Mitochondrial fusion supports increased oxidative phosphorylation during cell proliferation. Elife. 2019;8, e 41351.30694178 10.7554/e Life.41351 PMC 6351101 · doi ↗ · pubmed ↗