Correction to: Light-triggered multifunctional nanoplatform for efficient cancer photo-immunotherapy
Juan Yue, Qian Mei, Panyong Wang, Peng Miao, Wen-Fei Dong, Li Li

Abstract
Genes, proteins, chemicals, diseases, species, mutations and cell lines named across the full text — each resolved to its canonical identifier and authoritative record.
Click any figure to enlarge with its caption.
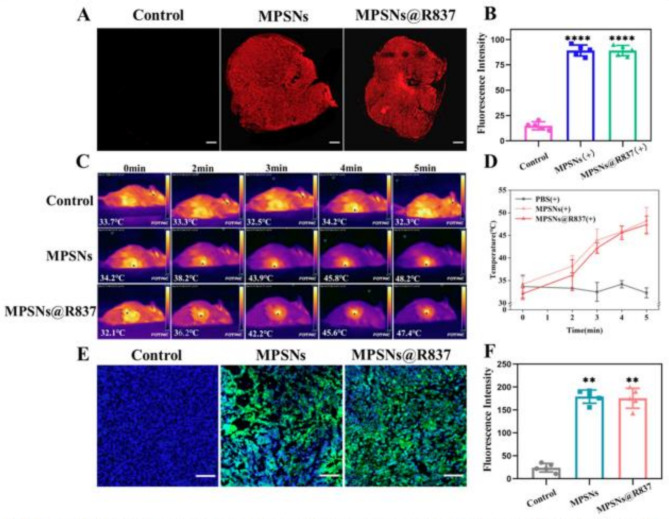 Figure 1
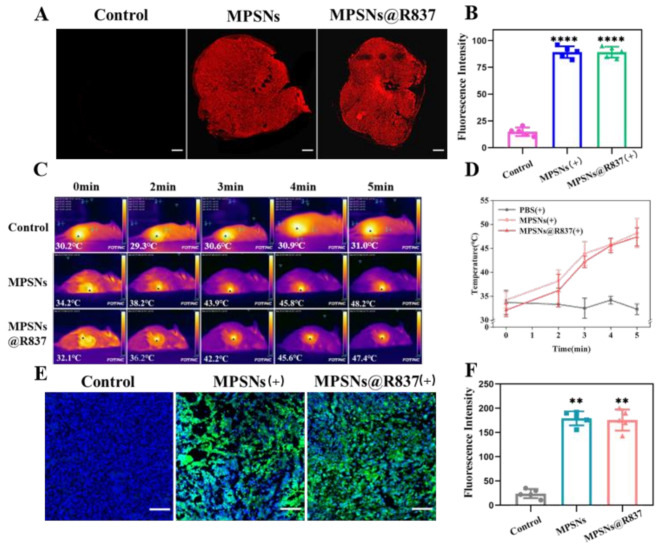 Figure 2
Peer Reviews
No public reviews on file for this paper yet. If you reviewed it on a platform where reviews are public (OpenReview, ICLR, NeurIPS, ICML), you can paste yours below so the community can read it here.
Videos
No videos yet. Explain this paper in a talk, walkthrough, or lecture? Add one.
Taxonomy
TopicsNanoplatforms for cancer theranostics · Photodynamic Therapy Research Studies · Polydiacetylene-based materials and applications
Correction to: Journal of Nanobiotechnology (2022) 20:181
10.1186/s12951-022-01388-8
In this article Fig. 6 appeared incorrectly: the five images in the first row of Fig. 6C used the wrong mouse images, and the temperature values displayed on the images were also incorrect, this error does not affect the scientific conclusions of the paper, so no changes to the main text or conclusion are necessary. For completeness and transparency, the old incorrect and incorrect versions are displayed below.
Incorrect Fig. 6.
Fig. 6A The distribution of MPSNs@R837 (red fluorescence) in tumor sections (scale bar = 200 μm). B The fluorescence intensity as described in A determined by flow cytometry. C Thermographic images and D tumor temperature changes of 4T1 tumor-bearing mice at different time points under laser irradiation 12 h after injection of saline, MPSNs and MPSNs@R837 (808 nm, 0.6 W/cm^2^). E The ROS level in (green fluorescence) in tumor sections (scale bar = 100 μm). F The fluorescence intensity as described in E. All data are mean ± SD (n = 5), statistical significances were calculated via Student’s t test, ****p < 0.0001
Correct Fig. 6.
Fig. 6A The distribution of MPSNs@R837 (red fluorescence) in tumor sections (scale bar = 200 μm). B The fluorescence intensity as described in A determined by flow cytometry. C Thermographic images and D tumor temperature changes of 4T1 tumor-bearing mice at different time points under laser irradiation 12 h after injection of saline, MPSNs and MPSNs@R837 (808 nm, 0.6 W/cm^2^). E The ROS level in (green fluorescence) in tumor sections (scale bar = 100 μm). F The fluorescence intensity as described in E. All data are mean ± SD (n = 5), statistical significances were calculated via Student’s t test, ****p < 0.0001
The original article has been corrected.