Synergistic effects of surface-enhanced Raman spectroscopy and enzyme-linked immunoassays in diagnosis of Alzheimer's disease, mild cognitive impairment, and late-life depression
Xi Mei, Zheng Zhao, Juan Wang, Conglong Qiu, Longhui Li, Changchun Xiong, Shanshan Zhu, Chengying Zheng

TL;DR
This study shows that combining two blood-based tests can improve the accuracy of diagnosing Alzheimer's disease, mild cognitive impairment, and late-life depression.
Contribution
The novel contribution is demonstrating the synergistic diagnostic performance of combining SERS and ELISA for neurodegenerative and neuropsychiatric disorders.
Findings
SERS and ELISA biomarkers significantly differed among Alzheimer's, MCI, LLD, and control groups.
Combining SERS and ELISA improved diagnostic accuracy compared to using either method alone.
Key SERS peaks and ELISA biomarkers showed significant differences with p-values under 0.05.
Abstract
Objective tests that can be used to identify neurodegenerative diseases and neuropsychiatric disorders are urgently needed. The primary objective of this study is to evaluate the diagnostic accuracy of surface-enhanced Raman spectroscopy (SERS), a novel blood-based detection method, in differentiating neurodegenerative diseases and neuropsychiatric disorders. Additionally, we aim to assess the synergistic diagnostic performance of combining SERS with enzyme-linked immunosorbent assay (ELISA) technology for Alzheimer's disease (AD), mild cognitive impairment (MCI), and late-life depression (LLD). In total, 23 patients with AD, 24 with MCI, 20 with LLD, and 20 cognitively normal (control) individuals were enrolled. ELISA and SERS were used to test various biomarkers in the AD, MCI, LLD, and control groups. Amyloid-β, tau, brain-derived neurotrophic factor, proinflammatory cytokine…
Genes, proteins, chemicals, diseases, species, mutations and cell lines named across the full text — each resolved to its canonical identifier and authoritative record.
Click any figure to enlarge with its caption.
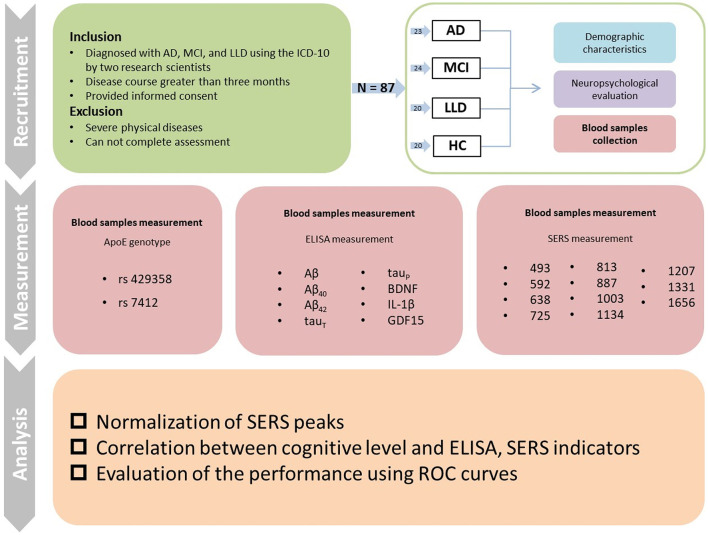 Figure 1
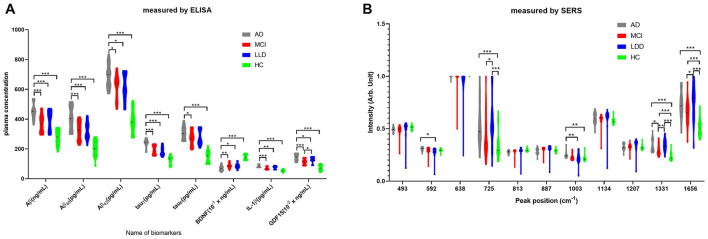 Figure 2
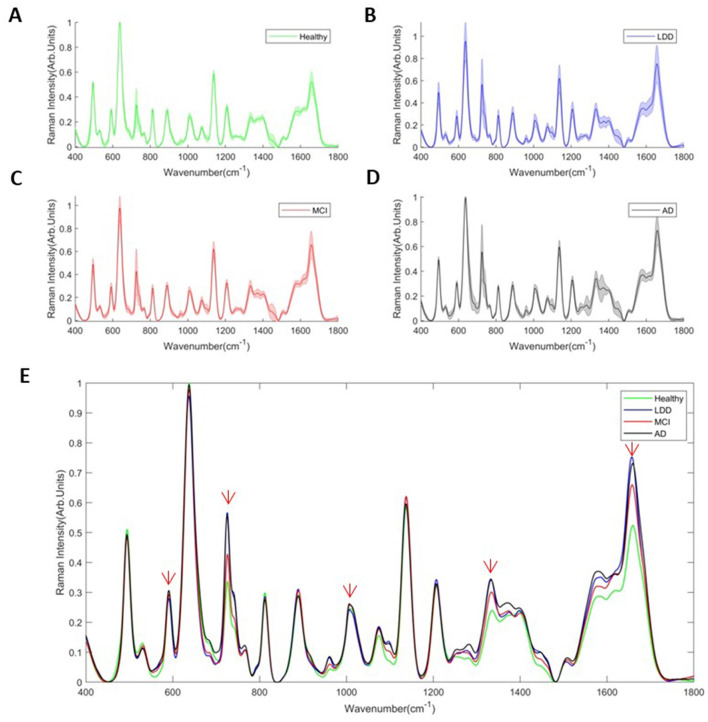 Figure 3
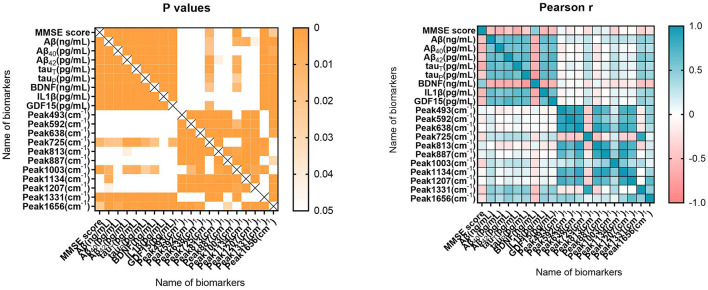 Figure 4
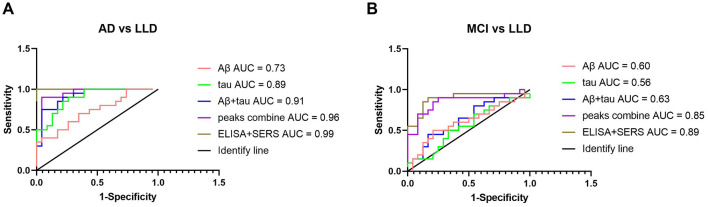 Figure 5
|
|
|
|
|
|
|
|
|---|---|---|---|---|---|---|
| Age | 80.09 ± 9.39 | 79.04 ± 7.78 | 74.10 ± 6.34 | 76.00 ± 8.00 | 2.536 | 0.062 |
| Gender (male/female) | 7/16 | 11/13 | 3/17 | 4/16 | 6.046 | 0.109 |
| Education years | 5.74 ± 2.91 | 6.00 ± 2.78 | 6.55 ± 2.58 | 7.40 ± 3.28 | 1.363 | 0.260 |
| MMSE scores | 13.17 ± 6.57 | 26.00 ± 2.64 | 28.00 ± 1.75 | 29.55 ± 0.69 | 87.653 | 0.000 |
| HAMD scores | 0.47 ± 0.85 | 0.67 ± 0.87 | 6.70 ± 2.05 | 0.65 ± 1.13 | 115.261 | 0.000 |
|
| ||||||
|
| ||||||
| TT, | 15 | 14 | 16 | 18 | 5.031 | 0.027 |
| TC, | 3 | 5 | 4 | 2 | ||
| CC, | 5 | 5 | 0 | 0 | ||
|
| ||||||
| TT, | 1 | 0 | 0 | 0 | 0.038 | 0.846 |
| TC, | 2 | 3 | 3 | 2 | ||
| CC, | 20 | 21 | 17 | 18 | ||
|
|
|
|
|
|
|
|
|---|---|---|---|---|---|---|
| Aβ (ng/ml) | 452.91 ± 52.59 | 372.72 ± 57.41 | 392.21 ± 63.48 | 274.97 ± 83.99 | 36.64 | 0.000 |
| Aβ40 (pg/ml) | 407.91 ± 76.60 | 322.50 ± 60.45 | 323.89 ± 56.62 | 204.25 ± 52.16 | 37.87 | 0.000 |
| Aβ42 (pg/ml) | 691.08 ± 77.52 | 616.66 ± 81.36 | 614.92 ± 89.21 | 386.16 ± 76.88 | 55.09 | 0.000 |
| tauT (pg/ml) | 237.24 ± 27.99 | 192.64 ± 28.97 | 186.37 ± 30.05 | 125.03 ± 27.80 | 54.86 | 0.000 |
| tauP (pg/ml) | 309.51 ± 43.12 | 271.41 ± 48.32 | 278.20 ± 48.71 | 146.92 ± 38.93 | 52.41 | 0.000 |
| BDNF (ng/ml) | 7.19 ± 1.76 | 8.88 ± 1.74 | 8.63 ± 1.77 | 14.55 ± 1.75 | 70.91 | 0.000 |
| IL-1β (pg/ml) | 85.46 ± 9.06 | 70.92 ± 9.86 | 75.76 ± 9.97 | 53.94 ± 9.37 | 40.04 | 0.000 |
| GDF15 (pg/ml) | 1,436.00 ± 210.74 | 1,131.06 ± 187.91 | 1,257.85 ± 199.37 | 728.97 ± 196.60 | 47.83 | 0.000 |
|
|
|
|
|
| |||
|---|---|---|---|---|---|---|---|
| 493 | 0.493 ± 0.026 | 0.486 ± 0.053 | 0.494 ± 0.093 | 0.510 ± 0.019 | 0.741 | 0.530 | Ring vibration, cellulose, guanine, L-arginine |
| 592 | 0.307 ± 0.018 | 0.293 ± 0.036 | 0.276 ± 0.054 | 0.295 ± 0.015 | 2.946 | 0.038 | Ascorbic acid, amide-VI |
| 638 | 0.995 ± 0.012 | 0.975 ± 0.102 | 0.956 ± 0.169 | 0.999 ± 0.001 | 0.847 | 0.472 | C-S stretching vibration, L-tyrosine, lactose |
| 725 | 0.558 ± 0.222 | 0.427 ± 0.198 | 0.566 ± 0.232 | 0.337 ± 0.133 | 6.305 | 0.001 | C-H bending vibration, adenine, coenzyme A |
| 813 | 0.276 ± 0.016 | 0.281 ± 0.032 | 0.284 ± 0.053 | 0.296 ± 0.014 | 1.511 | 0.218 | C-C-O stretching vibration, L-serine, glutathione |
| 887 | 0.287 ± 0.029 | 0.303 ± 0.029 | 0.306 ± 0.054 | 0.288 ± 0.017 | 1.744 | 0.164 | C-O-H bending vibration, glutathione, D-(+)-galactosamine |
| 1,003 | 0.253 ± 0.035 | 0.232 ± 0.031 | 0.221 ± 0.055 | 0.216 ± 0.028 | 4.000 | 0.010 | C-C symmetric stretch, phenylalanine |
| 1,134 | 0.596 ± 0.055 | 0.589 ± 0.063 | 0.596 ± 0.116 | 0.573 ± 0.028 | 0.481 | 0.697 | C-N stretching vibration, D-mannose |
| 1,207 | 0.328 ± 0.032 | 0.326 ± 0.031 | 0.342 ± 0.065 | 0.320 ± 0.023 | 0.994 | 0.400 | Ring vibration, L-tryptophan, phenylalanine |
| 1,331 | 0.341 ± 0.060 | 0.298 ± 0.051 | 0.344 ± 0.055 | 0.233 ± 0.039 | 20.059 | 0.000 | C-H stretching vibration, nucleic acid bases, D-mannose |
| 1,656 | 0.722 ± 0.126 | 0.657 ± 0.119 | 0.752 ± 0.168 | 0.515 ± 0.083 | 13.916 | 0.000 | C=O stretching vibration, amide-I, α-helix |
|
|
|
|
| |
|---|---|---|---|---|
|
| ||||
| Aβ (ng/ml) | 375.91 ± 87.35 | 375.99 ± 76.24 | −0.005 | 0.996 |
| Aβ40 (pg/ml) | 305.54 ± 91.00 | 351.50 ± 98.12 | −2.060 | 0.042 |
| Aβ42 (pg/ml) | 564.99 ± 145.01 | 630.08 ± 106.67 | −2.290 | 0.026 |
| tauT (pg/ml) | 183.12 ± 49.45 | 198.81 ± 45.73 | −1.350 | 0.181 |
| tauP (pg/ml) | 249.67 ± 81.29 | 266.91 ± 56.24 | −1.121 | 0.267 |
| BDNF (ng/ml) | 10.12 ± 3.51 | 8.53 ± 2.11 | 2.573 | 0.012 |
| IL-1β (pg/ml) | 70.54 ± 15.46 | 75.72 ± 12.00 | −1.477 | 0.143 |
| GDF15 (pg/ml) | 1,111.98 ± 323.91 | 1,243.97 ± 304.96 | −1.726 | 0.088 |
|
| ||||
| Peak 493 (cm−1) | 0.50 ± 0.04 | 0.49 ± 0.08 | 0.812 | 0.419 |
| Peak 592 (cm−1) | 0.29 ± 0.03 | 0.29 ± 0.05 | 0.086 | 0.931 |
| Peak 638 (cm−1) | 0.99 ± 0.06 | 0.97 ± 0.15 | 0.948 | 0.346 |
| Peak 725 (cm−1) | 0.46 ± 0.23 | 0.50 ± 0.19 | −0.809 | 0.421 |
| Peak 813 (cm−1) | 0.29 ± 0.03 | 0.27 ± 0.05 | 1.655 | 0.102 |
| Peak 887 (cm−1) | 0.30 ± 0.03 | 0.29 ± 0.05 | 0.837 | 0.405 |
| Peak 1,003 (cm−1) | 0.23 ± 0.03 | 0.24 ± 0.06 | −0.929 | 0.355 |
| Peak 1,134 (cm−1) | 0.59 ± 0.05 | 0.58 ± 0.11 | 0.643 | 0.522 |
| Peak 1,207 (cm−1) | 0.33 ± 0.03 | 0.33 ± 0.06 | 0.303 | 0.762 |
| Peak 1,331 (cm−1) | 0.30 ± 0.07 | 0.32 ± 0.06 | −1.328 | 0.188 |
| Peak 1,656 (cm−1) | 0.65 ± 0.15 | 0.70 ± 0.16 | −1.520 | 0.132 |
|
|
|
|
| |
|---|---|---|---|---|
|
| ||||
| Aβ (ng/ml) | 412.04 ± 85.36 | 370.70 ± 83.06 | 1.538 | 0.128 |
| Aβ40 (pg/ml) | 332.83 ± 89.61 | 316.10 ± 95.82 | 0.545 | 0.587 |
| Aβ42 (pg/ml) | 605.59 ± 114.95 | 579.67 ± 141.44 | 0.580 | 0.564 |
| tauT (pg/ml) | 173.31 ± 42.13 | 189.49 ± 49.49 | −1.030 | 0.306 |
| tauP (pg/ml) | 289.37 ± 75.55 | 249.37 ± 74.40 | 1.664 | 0.100 |
| BDNF (ng/ml) | 8.73 ± 3.58 | 9.82 ± 3.20 | −1.038 | 0.302 |
| IL-1β (pg/ml) | 74.06 ± 13.38 | 71.69 ± 14.94 | 0.502 | 0.617 |
| GDF15 (pg/ml) | 1,129.09 ± 278.22 | 1,151.18 ± 330.00 | −0.211 | 0.833 |
|
| ||||
| Peak 493 (cm−1) | 0.50 ± 0.02 | 0.49 ± 0.06 | 0.528 | 0.599 |
| Peak 592 (cm−1) | 0.30 ± 0.01 | 0.29 ± 0.04 | 0.949 | 0.345 |
| Peak 638 (cm−1) | 0.99 ± 0.01 | 0.98 ± 0.10 | 0.533 | 0.595 |
| Peak 725 (cm−1) | 0.43 ± 0.21 | 0.48 ± 0.22 | −0.775 | 0.440 |
| Peak 813 (cm−1) | 0.29 ± 0.01 | 0.28 ± 0.03 | 0.552 | 0.582 |
| Peak 887 (cm−1) | 0.29 ± 0.02 | 0.30 ± 0.04 | 0.237 | 0.814 |
| Peak 1,003 (cm−1) | 0.22 ± 0.02 | 0.23 ± 0.04 | −0.984 | 0.328 |
| Peak 1,134 (cm−1) | 0.59 ± 0.03 | 0.58 ± 0.08 | 0.516 | 0.607 |
| Peak 1,207 (cm−1) | 0.34 ± 0.03 | 0.32 ± 0.04 | 1.118 | 0.267 |
| Peak 1,331 (cm−1) | 0.29 ± 0.05 | 0.31 ± 0.07 | −0.532 | 0.596 |
| Peak 1,656 (cm−1) | 0.73 ± 0.17 | 0.65 ± 0.15 | 1.607 | 0.112 |
|
|
|
|
| |
|---|---|---|---|---|
|
| ||||
| Aβ (ng/ml) | 360.60 ± 56.07 | 381.38 ± 58.83 | −0.870 | 0.394 |
| Aβ40 (pg/ml) | 316.85 ± 57.98 | 330.40 ± 66.04 | −0.533 | 0.599 |
| Aβ42 (pg/ml) | 596.94 ± 80.48 | 630.74 ± 81.94 | −1.004 | 0.326 |
| tauT (pg/ml) | 188.27 ± 28.46 | 195.76 ± 29.99 | −0.615 | 0.542 |
| tauP (pg/ml) | 269.98 ± 34.95 | 272.43 ± 57.30 | −0.120 | 0.898 |
| BDNF (ng/ml) | 9.42 ± 1.73 | 8.12 ± 1.52 | 1.902 | 0.065 |
| IL-1β (pg/ml) | 70.62 ± 9.25 | 71.33 ± 11.16 | −0.170 | 0.866 |
| GDF15 (pg/ml) | 1,128.78 ± 233.59 | 1,132.69 ± 157.12 | −0.046 | 0.961 |
|
| ||||
| Peak 493 (cm−1) | 0.50 ± 0.03 | 0.48 ± 0.07 | 1.126 | 0.218 |
| Peak 592 (cm−1) | 0.30 ± 0.02 | 0.28 ± 0.04 | 1.399 | 0.176 |
| Peak 638 (cm−1) | 0.99 ± 0.01 | 0.96 ± 0.13 | 0.807 | 0.428 |
| Peak 725 (cm−1) | 0.43 ± 0.14 | 0.43 ± 0.23 | −0.023 | 0.982 |
| Peak 813 (cm−1) | 0.29 ± 0.01 | 0.28 ± 0.04 | 0.714 | 0.482 |
| Peak 887 (cm−1) | 0.31 ± 0.01 | 0.30 ± 0.04 | 0.926 | 0.365 |
| Peak 1,003 (cm−1) | 0.22 ± 0.03 | 0.24 ± 0.03 | −1.598 | 0.124 |
| Peak 1,134 (cm−1) | 0.60 ± 0.02 | 0.58 ± 0.08 | 0.633 | 0.533 |
| Peak 1,207 (cm−1) | 0.32 ± 0.03 | 0.34 ± 0.03 | −1.332 | 0.177 |
| Peak 1,331 (cm−1) | 0.30 ± 0.06 | 0.30 ± 0.05 | −0.174 | 0.864 |
| Peak 1,656 (cm−1) | 0.63 ± 0.12 | 0.69 ± 0.11 | −1.202 | 0.242 |
|
|
|
|
| |
|---|---|---|---|---|
|
| ||||
| Aβ (ng/ml) | 431.85 ± 41.95 | 364.27 ± 54.90 | 2.033 | 0.045 |
| Aβ40 (pg/ml) | 346.69 ± 33.34 | 319.04 ± 63.17 | 0.734 | 0.302 |
| Aβ42 (pg/ml) | 617.43 ± 81.65 | 611.23 ± 97.02 | 0.121 | 0.905 |
| tauT (pg/ml) | 193.49 ± 29.57 | 186.68 ± 29.10 | 0.374 | 0.712 |
| tauP (pg/ml) | 315.98 ± 20.01 | 265.04 ± 48.00 | 1.788 | 0.016 |
| BDNF (ng/ml) | 8.43 ± 1.24 | 8.94 ± 1.81 | −0.471 | 0.642 |
| IL-1β (pg/ml) | 74.12 ± 14.00 | 70.46 ± 9.51 | 0.593 | 0.559 |
| GDF15 (pg/ml) | 1,050.05 ± 83.91 | 1,142.63 ± 196.91 | −0.792 | 0.203 |
|
| ||||
| Peak 493 (cm−1) | 0.49 ± 0.01 | 0.48 ± 0.06 | 0.453 | 0.655 |
| Peak 592 (cm−1) | 0.30 ± 0.02 | 0.29 ± 0.04 | 0.217 | 0.830 |
| Peak 638 (cm−1) | 0.99 ± 0.01 | 0.97 ± 0.11 | 0.360 | 0.722 |
| Peak 725 (cm−1) | 0.31 ± 0.06 | 0.44 ± 0.21 | −1.119 | 0.038 |
| Peak 813 (cm−1) | 0.29 ± 0.01 | 0.28 ± 0.03 | 0.554 | 0.159 |
| Peak 887 (cm−1) | 0.31 ± 0.01 | 0.30 ± 0.03 | 0.168 | 0.710 |
| Peak 1,003 (cm−1) | 0.22 ± 0.01 | 0.23 ± 0.03 | −0.896 | 0.103 |
| Peak 1,134 (cm−1) | 0.61 ± 0.03 | 0.59 ± 0.07 | 0.543 | 0.387 |
| Peak 1,207 (cm−1) | 0.34 ± 0.02 | 0.33 ± 0.03 | 0.574 | 0.572 |
| Peak 1,331 (cm−1) | 0.27 ± 0.01 | 0.30 ± 0.05 | −0.932 | 0.050 |
| Peak 1,656 (cm−1) | 0.70 ± 0.10 | 0.65 ± 0.12 | 0.596 | 0.558 |
|
|
|
|
| |
|---|---|---|---|---|
|
| ||||
| Aβ (ng/ml) | 335.73 ± 64.81 | 406.33 ± 56.58 | −2.176 | 0.043 |
| Aβ40 (pg/ml) | 322.15 ± 61.18 | 330.91 ± 38.88 | −0.270 | 0.790 |
| Aβ42 (pg/ml) | 605.08 ± 91.88 | 654.25 ± 74.90 | −0.985 | 0.338 |
| tauT (pg/ml) | 179.22 ± 33.71 | 188.16 ± 29.98 | −0.522 | 0.608 |
| tauP (pg/ml) | 277.33 ± 68.75 | 278.42 ± 45.38 | −0.039 | 0.969 |
| BDNF (ng/ml) | 9.40 ± 1.78 | 8.44 ± 1.77 | 0.970 | 0.345 |
| IL-1β (pg/ml) | 70.78 ± 10.33 | 77.00 ± 9.81 | −1.123 | 0.276 |
| GDF15 (pg/ml) | 1,219.77 ± 201.83 | 1,410.19 ± 96.86 | −1.808 | 0.021 |
|
| ||||
| Peak 493 (cm−1) | 0.51 ± 0.03 | 0.43 ± 0.21 | 1.481 | 0.528 |
| Peak 592 (cm−1) | 0.29 ± 0.02 | 0.23 ± 0.11 | 1.961 | 0.407 |
| Peak 638 (cm−1) | 0.99 ± 0.03 | 0.81 ± 0.40 | 2.082 | 0.052 |
| Peak 725 (cm−1) | 0.54 ± 0.23 | 0.67 ± 0.23 | −0.972 | 0.025 |
| Peak 813 (cm−1) | 0.30 ± 0.02 | 0.23 ± 0.11 | 2.437 | 0.344 |
| Peak 887 (cm−1) | 0.32 ± 0.01 | 0.25 ± 0.11 | 2.444 | 0.333 |
| Peak 1,003 (cm−1) | 0.23 ± 0.04 | 0.19 ± 0.10 | 1.318 | 0.204 |
| Peak 1,134 (cm−1) | 0.62 ± 0.04 | 0.50 ± 0.25 | 2.003 | 0.060 |
| Peak 1,207 (cm−1) | 0.35 ± 0.03 | 0.29 ± 0.14 | 1.483 | 0.155 |
| Peak 1,331 (cm−1) | 0.34 ± 0.06 | 0.37 ± 0.02 | −1.185 | 0.054 |
| Peak 1,656 (cm−1) | 0.76 ± 0.14 | 0.73 ± 0.28 | 0.319 | 0.753 |
|
|
|
|
| |
|---|---|---|---|---|
|
| ||||
| Aβ (ng/ml) | 406.06 ± 62.74 | 389.75 ± 65.19 | 0.401 | 0.693 |
| Aβ40 (pg/ml) | 289.43 ± 63.21 | 329.98 ± 55.19 | −1.153 | 0.264 |
| Aβ42 (pg/ml) | 637.48 ± 75.00 | 610.93 ± 92.92 | 0.465 | 0.647 |
| tauT (pg/ml) | 190.81 ± 30.45 | 161.18 ± 6.22 | 1.644 | 0.002 |
| tauP (pg/ml) | 296.76 ± 52.26 | 274.92 ± 48.98 | 0.706 | 0.489 |
| BDNF (ng/ml) | 7.23 ± 1.68 | 8.88 ± 1.72 | −1.535 | 0.142 |
| IL-1β (pg/ml) | 75.88 ± 9.99 | 75.02 ± 12.01 | 0.136 | 0.894 |
| GDF15 (pg/ml) | 1,274.70 ± 193.98 | 1,162.37 ± 245.95 | 0.895 | 0.383 |
|
| ||||
| Peak 493 (cm−1) | 0.52 ± 0.02 | 0.49 ± 0.09 | 0.649 | 0.496 |
| Peak 592 (cm−1) | 0.31 ± 0.01 | 0.27 ± 0.06 | 1.026 | 0.030 |
| Peak 638 (cm−1) | 0.99 ± 0.01 | 0.95 ± 0.18 | 0.452 | 0.288 |
| Peak 725 (cm−1) | 0.42 ± 0.11 | 0.59 ± 0.23 | −1.228 | 0.094 |
| Peak 813 (cm−1) | 0.29 ± 0.01 | 0.28 ± 0.06 | 0.348 | 0.424 |
| Peak 887 (cm−1) | 0.31 ± 0.01 | 0.31 ± 0.06 | 0.031 | 0.941 |
| Peak 1,003 (cm−1) | 0.20 ± 0.02 | 0.23 ± 0.06 | −0.629 | 0.214 |
| Peak 1,134 (cm−1) | 0.62 ± 0.02 | 0.59 ± 0.12 | 0.434 | 0.327 |
| Peak 1,207 (cm−1) | 0.38 ± 0.02 | 0.33 ± 0.06 | 1.305 | 0.208 |
| Peak 1,331 (cm−1) | 0.32 ± 0.01 | 0.34 ± 0.06 | −0.737 | 0.015 |
| Peak 1,656 (cm−1) | 0.95 ± 0.05 | 0.72 ± 0.16 | 2.449 | 0.025 |
Peer Reviews
No public reviews on file for this paper yet. If you reviewed it on a platform where reviews are public (OpenReview, ICLR, NeurIPS, ICML), you can paste yours below so the community can read it here.
Videos
No videos yet. Explain this paper in a talk, walkthrough, or lecture? Add one.
Taxonomy
TopicsSpectroscopy Techniques in Biomedical and Chemical Research · Cholinesterase and Neurodegenerative Diseases · Alzheimer's disease research and treatments
Background
Age-related neurodegenerative diseases and neuropsychiatric disorders significantly increase with increased aging population (1). Cognitive decline is a common clinical manifestation of neurodegenerative diseases, such as Alzheimer's disease (AD) and neuropsychiatric disorder of late-life depression (LLD) (2). Mild cognitive impairment (MCI) is a common preclinical manifestation of neurodegenerative diseases and neuropsychiatric disorders in older adults (3, 4). In addition to negative emotions and sleep disorders, patients with LLD usually show a pseudo-cognitive and transient decline in thinking and memory, causing misdiagnosis (5, 6).
Several cognitive and psychological tests are used to evaluate cognitive levels (7, 8). Cerebrospinal fluid biomarker analysis may aid in differentiating between AD and LLD (9). Similarly, blood biomarkers are valuable objective indicators (10, 11). The transitional phase between MCI and AD is an ambiguous diagnostic period, where it is unclear whether the occurrence of MCI is owing to depression or dementia. Cognitive decline can be used to predict incipient dementia, indicating the need for different clinical treatment options. Neuropsychiatric symptoms may accompany these pre-dementia syndromes and help in identifying incipient dementia. Depression may be associated with an increased risk of dementia, particularly in older adults (12). LLD is controllable and curable if promptly diagnosed and appropriately treated. However, the onset of LLD is usually overlooked or covered up by cognitive disorders. Identifying neurodegenerative diseases and neuropsychiatric disorders using objective indicators is essential.
Enzyme-linked immunosorbent assay (ELISA) is a popular method for testing biomarkers in the blood of patients with AD. It can be used to detect serum amyloid-β (Aβ) and tau proteins (13–15). In addition, surface-enhanced Raman spectroscopy (SERS) has been recently used to investigate the diagnosis of diseases such as cancer and neurodegenerative diseases (16–18). SERS is a rapid, low-cost, non-invasive, and label-free technique that has found widespread application in in situ and ex situ biomedical diagnostics, including for neurological disorders (17). Because most previous studies used label-free SERS without specific target labeling, designing an optimal data pre-processing and modeling procedure is paramount for analyzing and interpreting untargeted spectral data. Machine learning (ML) models, such as principal component analysis, partial least squares, support vector machine, and k-nearest neighbors, are the prevailing methods for Raman feature extraction and data modeling (19). However, in the biomedical field, these traditional and cumbersome methods may hinder feature extraction and the identification of intricate patterns in high-dimensional Raman data, since identification or classification problems are complex tasks in practical applications. In recent years, deep learning (DL), an end-to-end learning method, has shown excellent ability in data pre-processing, feature extraction, and modeling (20). DL-based chemometrics have been applied to Raman spectral data, including cancer detection and genotype screening (21, 22).
A previous study conducted an in depth investigation of Raman spectroscopy of blood serum for AD, MCI, and other types of dementia (23). Raman spectroscopic-, SERS-, and blood or cerebrospinal fluid-based tests may aid clinical assessments, facilitating the accurate and effective differential diagnosis of AD (24, 25). In this study, we expanded the application of SERS to neuropsychiatric as well as neurodegenerative disorders and compared its diagnostic accuracy with that of ELISA. We performed two blood tests, ELISA and SERS, to investigate prompt and accurate diagnosis. We studied a combination of the two methods to collect blood from patients only once, reducing the number of invasive tests while improving diagnostic accuracy.
Methods
Participants
We recruited 23 patients with AD, 24 with MCI, 20 with LLD, and 20 cognitively normal participants (healthy control, HC) for this study. Patients were diagnosed using the Diagnostic and Statistical Manual of Mental Disorders, fifth edition criteria (26). All patients met the following inclusion and exclusion criteria: (1) diagnosis by at least two research psychiatrists; (2) provision of informed consent; (3) disease course >3 months; (4) presence of no other severe mental illnesses, including schizophrenia and delirium; and (5) no severe physical diseases. The Minimum sample size was calculated by setting the significance level (α) to 0.05 and the statistical power (1–β) to 70%.
Neuropsychiatric evaluation
The Mini-Mental State Examination (MMSE) comprises cognitive questions in orientation, immediate recall, attention, short-term memory, language, and visuospatial ability (27). The MMSE has a maximum score of 30 points, with higher scores indicating better cognitive performance. A score of <22 represents patients with AD, >22 and <27 represents patients with MCI, and >27 represents cognitively normal participants. The Hamilton depression scale (HAMD) was adopted to evaluate depression in patients with LLD (28).
Blood ELISA
Approximately 5 ml of whole blood was collected from each patient before breakfast in a procoagulant tube. The blood samples were centrifuged at 3,000 rpm for 10 min using a BY-600A type medical centrifuge (Beijing Baiyang Medical Devices Co., China). All blood samples were processed within 30 min of collection and immediately frozen at −80°C. Serum Aβ (total Aβ, Aβ_40_, and Aβ_42_), tau (total and phosphorylated), brain-derived neurotrophic factor (BDNF), proinflammatory cytokine IL-1β, and growth differentiation factor-15 (GDF-15) levels were estimated using ELISA kits (Shanghai Yuanye Bio-Technology Co., China). All procedures were performed according to the manufacturer's instructions. The absorbance was measured at 450 nm using a Sunrise-basic enzyme labeling instrument (Tecan Co., Switzerland) with a reference wavelength of 690 nm. These measurements were transformed into concentrations by comparing the optical densities of the samples with standard curve values.
Blood SERS
For SERS measurements in this study, a substrate of the core-shell Au@Ag nanoparticles aggregates (Au@AgNA) colloidal solution was prepared through Ag deposition on the surface of Au using the seed-growth method described in a previous study (29). The thawed serum was mixed with Au@AgNAs in a 1:1 ratio and incubated for 2 h at room temperature. Furthermore, 2 μl of the mixture was dropped onto an aluminum substrate for SERS measurements. The sample was dried before SERS measurements. The SERS spectra were obtained using a RenishawinViaQontor confocal Raman spectrometer (Renishaw, UK) coupled to a Leica microscope with a 50 × objective (NA = 0.50) backscattering geometry. SERS signal was excited by a 785-nm laser and measured in a wave number range of 400−1,800 cm^−1^ with a spectral resolution of 1 cm^−1^. To reduce operational variations and repeatability errors as well as the coffee-ring effect during drying, the mean of five measurements at different positions served as the final SERS spectrum for each participant (30).
Statistical analysis
For statistical analysis, data are presented as mean ± standard deviation. Demographic and clinical variables were compared and analyzed between the different groups using analysis of variance (ANOVA) or t-test for continuous variables and chi-squared test for categorical variables. SERS spectra are baseline subtracted and normalized using Savitzky–Golay algorithm as described in our previous literature (30, 31). Pearson's correlation coefficient was used to determine the correlation between cognitive levels and blood parameters. Statistical significance was set at P < 0.05. Receiver operating characteristic (ROC) curves and the area under the ROC curve (AUC) were used as criteria to evaluate the performance. The AUC was calculated as a comprehensive measure of discrimination accuracy, with 95% confidence intervals determined through bootstrap methods. Optimal cutoff values were identified by maximizing Youden's index (J = sensitivity + specificity−1).
Results
Clinical assessment
An overview of this study is shown in Figure 1. Inclusion and exclusion criteria were used to recruit participants with AD, MCI, LLD, and HC. All participants were asked to complete the demographic characteristics, neuropsychological evaluations, and blood sample collection. Subsequently, blood samples were analyzed using ELISA and SERS along with the APOE genotype (rs429358 and rs7412).
Overview of the study and CONSORT diagram of the primary phases of the clinical trial.
Table 1 presents the demographic characteristics of the participants. There were 67 patients, including 23 with AD (seven males and 16 females, with a mean age of 80.09 years), 24 with MCI (11 males and 13 females, with a mean age of 79.04 years), 20 with LLD (three males and 17 females, with a mean age of 74.10 years), and 20 HC (four males and 16 females, with a mean age of 76.00 years). Similarly, the education years, MMSE scores, HAMD scores and APOE SNPs are listed in Table 1. Allele C (TC + CC) was a risk factor for cognitive decline in the cognitive decline (MCI and AD groups) and cognitively normal (LLD and HC groups) groups at the SNP locus rs429358 (P < 0.05). However, there were no significant differences between the distribution of alleles C and T at locus s7412 (P = 0.846).
Two measurements of blood biomarkers
Table 2 presents the blood levels of Aβ (total Aβ, Aβ_40_, and Aβ_42_), tau (total and phosphorylated), BDNF, proinflammatory cytokine IL-1β, and GDF-15. The levels of these blood biomarkers, measured using ELISA, significantly differed among the four groups (P < 0.05).
Table 3 lists the peak positions measured using SERS for the four groups. After performing ANOVA on the intensities of the primary SERS peaks (each peak represents specific substance components), five SERS peaks at 592 (P = 0.038), 725 (P = 0.001), 1,003 (P = 0.010), 1,331 (P = 0.000), and 1,656 cm^−1^ (P = 0.000) had statistically significant differences among the four groups.
As shown in Figure 2A, using the ELISA measurement, the serum biomarkers were significantly higher in the AD group than in the other three groups. Compared with the MCI group, the peak positions of SERS (in terms of intensity) at 725, 1,331, and 1,656 cm^−1^ had statistically significant differences in the LLD group (Figure 2B).
*Two measurements of blood biomarkers. (A) Enzyme-linked immunosorbent assay (ELISA) data of total Aβ, Aβ40, Aβ42, total tau, phosphorylated tau, brain-derived neurotrophic factor (BDNF), proinflammatory cytokine IL-1β, and growth differentiation factor-15 (GDF-15). (B) SERS data of peaks position in 493, 592, 638, 725, 813, 887, 1,003, 1,134, 1,207, 1,331, and 1,656 cm−1. The gray bar represents the AD group. The red bar represents the MCI group. The blue bar represents the LLD group. The green bar represents the HC group.*P < 0.05; **P < 0.01; **P < 0.001.
Figures 3A–D shows the average serum SERS spectra of the HC (Figure 3A), LLD (Figure 3B), MCI (Figure 3C), and AD (Figure 3D) groups and the comparison of the average serum SERS spectra between the four groups (Figure 3E). Similarly, Figure 3E shows SERS intensities with statistically significant differences between the four groups at peaks 592, 725, 1,003, 1,331, and 1,656 cm^−1^.
Intensity of the average serum SERS spectra of the AD (A), MCI (B), LLD (C), and HC groups (D) and the comparison of average serum SERS spectra between four groups (E). The gray line represents the AD group. The red line represents the MCI group. The blue line represents the LLD group. The green line represents the HC group.
Correlations between two types of blood biomarkers
Figure 4 shows the Pearson correlation between cognitive and blood biomarkers. MMSE scores were significantly correlated with Aβ (P < 0.001, r = −0.498), Aβ_40_ (P < 0.001, r = −0.579), Aβ_42_ (P < 0.001, r = −0.445), total tau (P < 0.001, r = −0.638), phosphorylated tau (P < 0.001, r = −0.396), BDNF (P < 0.001, r = 0.474), proinflammatory cytokine IL-1β (P < 0.001, r = −0.560), and GDF-15 (P < 0.001, r = −0.509). Regarding SERS parameters, MMSE scores were significantly correlated with 725 (P = 0.011, r = −0.271), 1,003 (P = 0.001, r = −0.348), 1,331 (P < 0.001, r = −0.366), and 1,656 cm^−1^ (P = 0.022, r = −0.245).
Pearson correlation of cognitive and blood biomarkers. MMSE represents the cognitive level of participants. The blood parameters included ELISA measurements of (total Aβ, Aβ40, and Aβ42), tau (including total and phosphorylated tau), brain-derived neurotrophic factor (BDNF), proinflammatory cytokine IL-1β, growth differentiation factor-15 (GDF-15) and SERS measurements of peaks position in 493, 592, 638, 725, 813, 887, 1,003, 1,134, 1,207, 1,331, and 1,656 cm−1. The scale bar represents Pearson's correlation coefficient r and P-values.
As presented in Table 4, all individuals with APOE rs429358 T/T genotype had lower Aβ_40_ and Aβ_42_ and higher BDNF levels than those with APOE rs429358 T/C + C/C genotype (t = −2.060, P = 0.042; t = −2.290, P = 0.026; t = 2.573, P = 0.012, respectively). Compared with APOE rs429358 T/C + C/C genotype carriers, individuals with the APOE rs429358 T/T genotype showed no significant differences in SERS data. In contrast to individuals with the APOE rs7412 C/C genotype, those with the APOE rs7412 T/C + T/T genotype showed no significant differences in ELISA and SERS data (Table 5).
Table 6 shows the relation of the ELISA and SERS measurements of blood parameters with APOE rs429358 in MCI participants. The data on APOE rs429358 T/T and APOE rs429358 T/C + C/C genotype carriers did not significantly differ from the ELISA and SERS results. Table 7 shows the relation of the blood parameters measured using ELISA and SERS with APOE rs7412 in MCI participants. Compared with individuals with the APOE rs7412 C/C genotype, those with the APOE rs7412 T/C + T/T genotype showed a significantly higher level of tau_p_ value (t = 1.788, P = 0.016) on ELISA and lower value of Peak 725 on SERS (t = −1.119, P = 0.038).
Table 8 compares the blood parameters measured using ELISA and SERS with respect to APOE rs429358 in LLD participants. Compared with individuals with the APOE rs429358 T/T genotype, those with the APOE rs429358 T/C + C/C genotype showed significantly higher Aβ and GDF15 levels (t = −2.176, P = 0.043; t = −1.808, P = 0.021, respectively) on ELISA and a significantly higher value of Peak 725 (t = −0.972, P = 0.025) on SERS. Table 9 shows the association of the blood parameters measured using ELISA and SERS with APOE rs7412 in LLD participants. Compared with individuals with the APOE rs7412 C/C genotype, those with the APOE rs7412 T/C + T/T genotype showed significantly higher levels of tau_T_ (t = 1.644, P = 0.002) on ELISA and higher values of Peak 592 and 1,656 (t = 1.026, P = 0.030; t = 2.499, P = 0.025, respectively) and lower value of Peak 1,331 (t = −0.737, P = 0.015) on SERS.
Sensitivity of two measurements in the diagnosis of MCI and LLD
For the MCI and LLD groups, the blood parameters of the two measurements could be used to enhance the accuracy of the cognitive disorder diagnosis. In Figure 5, the ROC curve revealed that the AUC was significantly higher after combining multiple blood indicators than with a single blood indicator. The results demonstrate that SERS-based methods yielded an accuracy of 96% for the classification of AD and LLD, and an accuracy of 85% for the classification of MCI and LLD. The combination of SERS and ELISA yielded an accuracy of 99% for the classification of AD and LLD, and an accuracy of 89% for the classification of MCI and LLD.
Receiver operating characteristic curves of different parameters of diagnosis in cognitive decline AD (A) or MCI (B) and no cognitive decline LLD. Combining ELISA and SERS parameters can improve the sensitivity and specificity. AD, Alzheimer's disease; MCI, mild cognitive impairment; LLD, late-life depression. The red line represents Aβ; the green line represents tau; the blue line represents the combination of Aβ and tau; the purple line represents five peaks of 592, 725, 1,003, 1,331, and 1,656 cm−1; the brown line represents the combination of ELISA and SERS parameters; the black line represents the identify line.
Discussion
This is the first study to involve using two different blood tests to investigate biomarkers for neuropsychiatric diseases. In previous studies, ELISA-SERS was used to detect the severe acute respiratory syndrome coronavirus 2 and other diseases (32, 33). In this study, we aimed to examine whether two blood tests, ELISA and SERS, could be used to differentiate between AD, MCI, and LLD better than single blood tests. The Aβ and tau biomarkers remained the elevated indicators in AD, MCI, and LLD, as previously described (34). The SERS peaks are valuable and well-established biomarkers, characterized by specific Raman fingerprints that can be used to identify AD, MCI, and LLD (30). We found that combining the two methods can improve the diagnosis and that SERS complements the ELISA.
The APOE genotype may be a genetic risk factor for neurodegenerative diseases other than Alzheimer's disease (35). Contributions of Aβ burden and APOE genotype on cognitive performance were also risk factors for cognitive decline in participants with LLD (36). The SNPs of rs429358 in APOE genotype C and rs7412 in APOE genotype T are risk factors for cognitive decline. In this study, the blood parameters Aβ_40_ and Aβ_42_ of ELISA were significantly different in participants with and without SNPs of the rs429358 APOE genotype. However, in SERS parameters, there were no statistically significant differences between participants with and without SNPs of the rs429358 and rs7412 APOE genotypes. This suggested that the SERS findings were more flexible in the absence of APOE genotypes.
In a previous study, the mean SERS spectra of different groups were the biochemical component assignments of these peaks (30). Among these peaks, the SERS intensities at 592(P = 0.038), 725 (P = 0.001), 1,003 (P = 0.010), 1,331 (P = 0.000), and 1,656 cm^−1^ (P = 0.000) were significantly different among the four groups, demonstrating the different biochemical components of these groups. These components included L-serine, glutathione, adenine, coenzyme A, phenylalanine, and nucleic and acid bases, among others (37–39). Changes in these components correspond to the processes in neuropsychiatric disorders, cellular metabolism, and neurological functions (40, 41).
The SERS peak at 592 cm^−1^ represented ascorbic acid and amide-VI. Ascorbic acid is a water-soluble antioxidant that catalyzes the reduction of superoxide radicals and plays a crucial role in maintaining oxidative balance (42). Many studies have indicated that ascorbic acid deficiency is associated with depression (43). Lower ascorbic acid status is also associated with greater cognitive impairment (44, 45). Increased consumption of ascorbic acid caused by oxidative stress in the brain may lead to reduced levels in serum of patients with MCI and AD (46).
The SERS peak at 725 cm^−1^ represented C-H bending vibration, adenine, and coenzyme A. Coenzyme A metabolism plays a crucial role in the normal functioning and metabolism of the nervous system (47). Inborn errors of coenzyme A metabolism are responsible for distinct forms of neurodegeneration with brain iron accumulation (47, 48). The SERS peak at 1,003 cm^−1^ represented the C-C symmetric stretch and phenylalanine. Dysregulation of phenylalanine metabolism in the hippocampus may be an important pathogenic mechanism for AD (49).
The SERS peak at 1,331 cm^−1^ represented C-H stretching vibration, nucleic acid bases, and D-mannose. The results suggested more cell-free DNA in the blood in patients with neuropsychiatric disorders. Circulating cell-free DNA is a product of cell death. The increase in circulating cell-free DNA levels might result from excessive cell death in the brain due to higher oxidative stress levels in neuropsychiatric disorders (50).
The SERS peak of 1,656 cm^−1^ represented C=O stretching vibration, amide-I, and α-helix. The results indicated increased levels of free amino acids in the blood serum of patients with neuropsychiatric disorders, which aligns with the findings of several recent studies (51). Amino acids play essential roles in controlling brain functions by acting as regulators of energy metabolism (52). Alterations in free amino acid levels in blood may be influenced by compromised energy metabolism, including nitrogen metabolism and cerebral glucose metabolism in patients with neuropsychiatric disorders (53).
The ELISA method provided information on protein levels, including Aβ (total Aβ, Aβ_40_, and Aβ_42_), tau (total and phosphorylated), BDNF, IL-1β, and GDF-15. GDF-15 is significant in the biological aging of LLD (54). Compared with patients with MCI, participants with LLD had significantly higher GDF-15 levels. Late-life depression is associated with GDF-15, a marker of age-related biological changes. As it can measure the inelastic scattering between monochromatic photons and detected molecules, SERS can provide specific information on metabolic variations, which may serve as valuable biomarkers in neurodegenerative and neuropsychiatric disorders (55, 56). Combining ELISA and SERS blood testing may be a valuable method to increase diagnostic accuracy.
This study has some limitations and strengths. The strength of this study was its elevated diagnostic accuracy using minimally invasive methods of blood testing for material composition at two different scales. A limitation of this study is that the sample size was relatively small, which lead to high intra-class standard deviations for the proposed SERS peaks. In future studies, we will endeavor to enroll larger samples or collect a larger number of SERS spectra from the same samples/donors and use advanced data analysis methods suitable for large sample processing, such as machine learning, to train classification models and increase diagnostic accuracy.
Conclusions
Blood biomarkers tested using ELISA and SERS are associated with cognitive level. Combining ELISA and SERS is an innovative technique that can significantly increase diagnostic accuracy. Biomarkers of material composition at two scales can be used to identify age-related neurodegenerative diseases and neuropsychiatric disorders. Using the SERS + ELISA method can improve the 96% accuracy for the classification of AD and LLD to 99% for the classification of MCI and LLD. The combination of SERS and ELISA improved the accuracy of MCI and LLD classification from 85 to 89%.
The reference list from the paper itself. Each links out to its DOI / PubMed record.
- 1Gupta R Advani D Yadav D Ambasta RK Kumar P. Dissecting the relationship between neuropsychiatric and neurodegenerative disorders. Mol Neurobiol. (2023) 60:6476–529. 10.1007/s 12035-023-03502-937458987 · doi ↗ · pubmed ↗
- 2Gatchel JR. Late-life neuropsychiatric symptoms: windows into cognitive decline? Am J Geriatr Psychiatry. (2020) 28:72–4. 10.1016/j.jagp.2019.08.01731526547 · doi ↗ · pubmed ↗
- 3Zhong X Ning Y Gu Y Wu Z Ouyang C Liang W. A reliable global cognitive decline and cortisol as an associated risk factor for patients with late-life depression in the short term: a 1-year prospective study. J Affect Disord. (2018) 240:214–9. 10.1016/j.jad.2018.07.05230081292 · doi ↗ · pubmed ↗
- 4Rabin LA Smart CM Amariglio RE. Subjective cognitive decline in preclinical Alzheimer's disease. Annu Rev Clin Psychol. (2017) 13:369–96. 10.1146/annurev-clinpsy-032816-04513628482688 · doi ↗ · pubmed ↗
- 5ZackováLJáni M Brázdil M Nikolova YS MarečkováK. Cognitive impairment and depression: meta-analysis of structural magnetic resonance imaging studies. Neuro Image Clin. (2021) 32:102830. 10.1016/j.nicl.2021.10283034560530 PMC 8473769 · doi ↗ · pubmed ↗
- 6Invernizzi S Simoes Loureiro I Kandana Arachchige KG Lefebvre L. Late-life depression, cognitive impairment, and relationship with Alzheimer's disease. Dement Geriatr Cogn Disord. (2021) 50:414–24. 10.1159/00051945334823241 · doi ↗ · pubmed ↗
- 7Bennett JM Chekaluk E Batchelor J. Cognitive tests and determining fitness to drive in dementia: a systematic review. J Am Geriatr Soc. (2016) 64:1904–17. 10.1111/jgs.1418027253511 · doi ↗ · pubmed ↗
- 8Chan JYC Yau STY Kwok TCY Tsoi KKF. Diagnostic performance of digital cognitive tests for the identification of MCI and dementia: a systematic review. Ageing Res Rev. (2021) 72:101506. 10.1016/j.arr.2021.10150634744026 · doi ↗ · pubmed ↗