Myocardial extracellular volume fraction with spectral detector computed tomography for risk stratification in non-ischemic heart failure
Jie Deng, Yu Wang, Tianfu Qi, Zhiming Li, Hongen Zheng, Yan Wu, Lin Lu, Deyan Li, Dan Han, Wei Chen

TL;DR
This study shows that a new CT scan method can measure heart tissue changes in non-ischemic heart failure patients, helping predict their risk of complications.
Contribution
The study introduces a novel CT-based method for measuring extracellular volume fraction in non-ischemic heart failure patients.
Findings
CT-ECV measurements using SDCT showed no significant difference compared to CMR-ECV.
Higher CT-ECV was observed in non-ischemic heart failure patients compared to controls.
CT-ECV was significantly associated with worse survival outcomes in non-ischemic heart failure patients.
Abstract
To validate the feasibility of using late iodine enhancement (LIE)-derived ECV on iodine density images using spectral detector computed tomography (SDCT; CT-ECV) and to assess the potential of CT-ECV for risk stratification among patients with non-ischemic heart failure (NIHF). Forty-five subjects who underwent cardiac SDCT and CMR were included in the validation group to calculate and compare CT-ECV with CMR-ECV to validate CT-ECV feasibility. Another 117 subjects (82 patients with NIHF, 35 controls) who underwent SDCT were included in the experimental group to explore the potential of CT-ECV for risk stratification. ECV was measured via iodine density images and CMR T1 mapping in accordance with American Heart Association 16-segment models. In the validation group, there was no significant difference between CT-ECV and CMR-ECV (P = 0.293), with an insignificant bias. In the…
Genes, proteins, chemicals, diseases, species, mutations and cell lines named across the full text — each resolved to its canonical identifier and authoritative record.
Click any figure to enlarge with its caption.
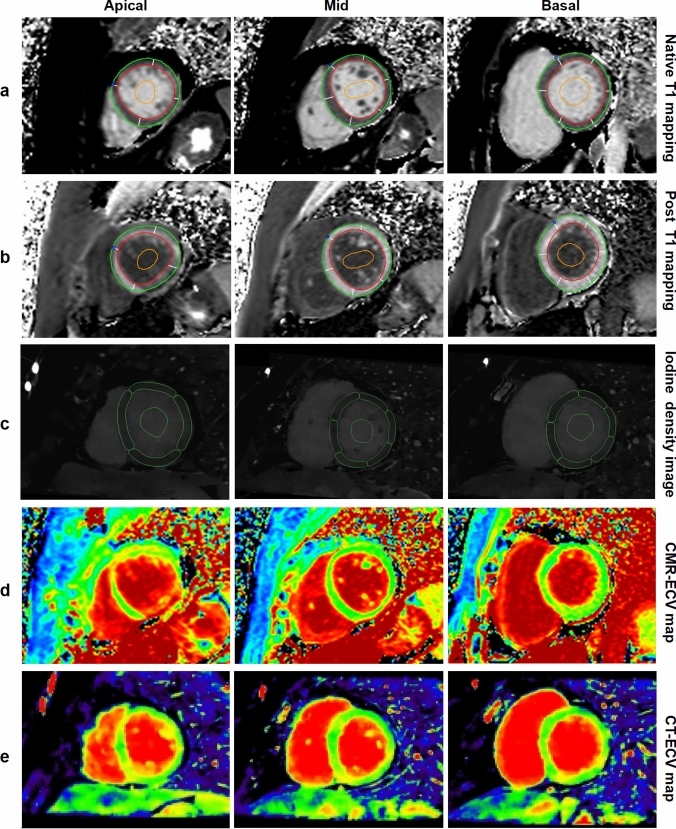 Figure 1
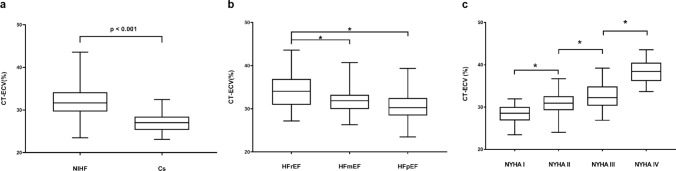 Figure 2
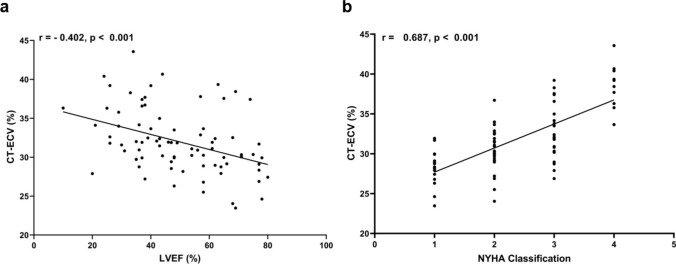 Figure 3
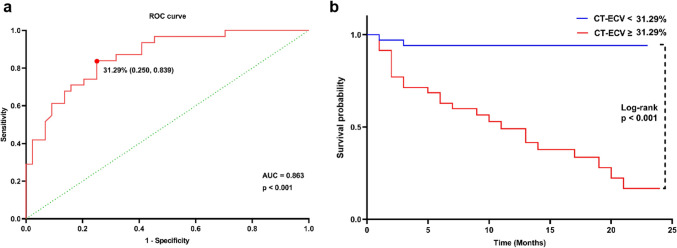 Figure 4
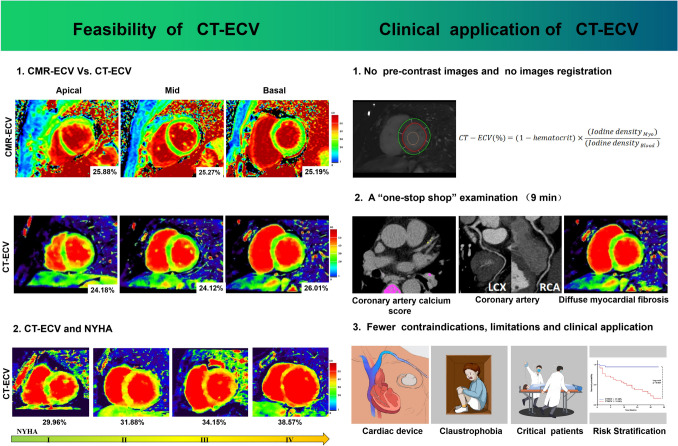 Figure 5
- —http://dx.doi.org/10.13039/501100001809National Natural Science Foundation of China
- —Yunnan Fundamental Research Projects
- —Yunnan Clinical Medical Research Center Projects
- —First-Class Discipline Team of Kunming Medical University
Peer Reviews
No public reviews on file for this paper yet. If you reviewed it on a platform where reviews are public (OpenReview, ICLR, NeurIPS, ICML), you can paste yours below so the community can read it here.
Videos
No videos yet. Explain this paper in a talk, walkthrough, or lecture? Add one.
Taxonomy
TopicsCardiac Imaging and Diagnostics · Cardiovascular Function and Risk Factors · Advanced X-ray and CT Imaging
Introduction
Diffuse myocardial fibrosis, characterized by excess collagen deposition and expansion of the extracellular matrix, plays a crucial role in the progression of various cardiomyopathies and heart failure (HF) [1, 2]. However, its onset and progression are often overlooked, especially in patients with non-ischemic heart failure (NIHF). To address this, myocardial extracellular volume fraction (ECV) derived from cardiac magnetic resonance (CMR) T1 mapping has emerged as a noninvasive imaging biomarker for assessing and quantifying diffuse myocardial fibrosis [3, 4]. However, CMR is not widely available and has certain limitations and contraindications [5].
Computed tomography (CT) has some advantages with regard to compensating for the lack of CMR. In addition, due to its pharmacokinetics (which are shared by gadolinium and iodine contrast agents), late iodine enhancement (LIE) has gradually been accepted for its potential and promise for quantifying ECV [5–10]. The emerging dual-layer spectral detector computed tomography (SDCT) technology has the following advantages, which can improve upon the limitations of current studies involving LIE-derived CT-ECV: (1) SDCT permits the simultaneous acquisition of both low- and high-kVp data sets to generate spectral base images (SBIs). SBIs can be used to reconstruct iodine density images, which enable the direct quantification of iodine concentration in organs with high tissue resolution. This process avoids the sophisticated registration that occurs between pre- and post-contrast images. (2) Compared to other multi-detector CT modalities that require the prospective selection of the appropriate dual-energy mode before scanning to obtain iodine density images, SBIs obtained with dual-layer technology can be applied to all patients, provided that specific scan parameters are set (a tube voltage of 120 kV) during the scanning process. This approach facilitates the standardization of disease detection in routine clinical practice [11, 12]. In clinical contexts, CCTA is recommended for patients with HF who are at moderate-to-low risk of CAD, especially when new-onset HF with a possible relation to CAD is suspected, to evaluate the coronary arteries for the detection or exclusion of ischemia or NIHF. Furthermore, CCTA is useful for excluding coronary artery disease in patients with suspected non-ischemic cardiomyopathy [13]. Thus, it will be of great significance to develop a protocol that can simultaneously evaluate both the coronary arteries and diffuse myocardial fibrosis in patients with known or suspected HF in a “one-stop shop” examination.
With this in mind, our study will address the following two research questions: (1) Can LIE-derived ECV on iodine density images using SDCT quantify diffuse myocardial fibrosis in a way that is similar to CMR-ECV? (2) If so, what is the potential of CT-ECV for risk stratification among patients with NIHF?
Methods
Study population
The prospective study was approved by the research ethics committee of the First Affiliated Hospital of Kunming Medical University (Approval No. 2022L232). All study participants provided written informed consent before their examinations. Patients with known or suspected heart disease underwent cardiac SDCT examinations at our institution between December 2020 and March 2023.
A validation group (G_V_), which included patients who underwent both cardiac SDCT and CMR examinations within 1 week, was set up to validate the feasibility of CT-ECV via head-to-head comparison with CMR-ECV. After CT-ECV was found to be feasible, the experimental group (G_e_)—which included patients with NIHF and controls—was set up to evaluate the potential of CT-ECV for risk stratification among patients with NIHF.
The inclusion criteria for patients with NIHF were heart failure attributed to non-coronary artery disease. Non-coronary artery disease is defined as follows [14]: (1) absence of significant coronary artery disease, confirmed by coronary angiography or CCTA with a diameter stenosis < 50%; (2) no history of previous coronary intervention therapy or myocardial infarction [13]. The severity of luminal diameter stenosis is graded as follows [14]: No visible stenosis (0%), minimal stenosis (1–24%), mild stenosis (25–49%), moderate stenosis (50–69%), severe stenosis (70–99%), occluded (100%); overall amount of coronary plaque assessed using coronary artery calcium score calculation: Mild (1–100), Moderate (101–300), Severe (301–999), Extensive (> 1000).
Criteria for HF followed the 2021 European Society of Cardiology Heart Failure Guidelines [15], which include (1) symptoms and/or signs of HF (New York Heart Association [NYHA] Class ≥ I); (2) objective evidence of cardiac structural and/or functional abnormalities on echocardiography; and (3) raised B-type natriuretic peptide (BNP) ≥ 35 ng/L or N-terminal pro-BNP (NT-proBNP) ≥ 125 ng/L). In this study, the term patients with NIHF encompasses various subgroups of patients, such as those with dilated cardiomyopathy, hypertrophic cardiomyopathy, hypertensive heart disease, or myocarditis. These diseases were diagnosed in accordance with the relevant guidelines [16–20]. Patients with infiltrative myocardial diseases, such as cardiac amyloidosis, hemochromatosis, glycogen storage diseases, and Fabry disease, were excluded due to their distinct pathophysiological mechanisms.
The classification of patients with NIHF were first divided into three categories [15]: heart failure with reduced ejection fraction (HFrEF), mildly reduced ejection fraction (HFmrEF), and preserved ejection fraction (HFpEF). HFrEF is defined as (1) symptoms ± signs and (2) LVEF < 40%. HFmrEF includes (1) symptoms ± signs and (2) LVEF 41–49%. HFpEF is characterized by (1) symptoms ± signs, (2) LVEF ≥ 50%, and (3) objective evidence of structural or functional cardiac abnormalities consistent with LV diastolic dysfunction or elevated LV filling pressures, including raised natriuretic peptides. In addition, per the NYHA Classification system, we also divided the patients with NIHF into four subgroups: NYHA Classes I, II, III, and IV. All clinical examinations and laboratory tests, including hematocrit (HCT) values obtained from routine blood sampling, were performed within 2–4 days before or after the cardiac SDCT or CMR examination. Patients who underwent CMR and/or cardiac SDCT for chest pain, chest tightness, and palpitations but who had no abnormalities found with CMR, cardiac SDCT, electrocardiography, or myocardial enzyme testing and who had no history of alcoholism, hypertension, diabetes, drug use, or systemic disease served as controls. The key exclusion criteria for this study were as follows: contraindications for cardiac magnetic resonance (CMR) or cardiac SDCT, chronic renal failure with a current estimated glomerular filtration rate of less than 30 ml/min/1.73 m^2^, inability to provide informed consent, intolerance to examination, and age under 18.
Clinical follow-up
Electronic and medical records were reviewed for the collection of follow-up data and/or the patient was contacted. The primary clinical endpoint was the first occurrence of a major adverse cardiovascular events (MACE), which included hospital admission for heart failure, cardiovascular mortality and all-cause mortality [21].
Cardiac CT image acquisition
All cardiac CT images were obtained using a dual-layer spectral detector CT scanner (iQon Spectral Detector CT; Philips Healthcare, Best, The Netherlands). The cardiac SDCT scanning protocol in this study consisted of three acquisitions: (1) pre-contrast images for coronary artery calcium score calculation; (2) CCTA images for coronary artery evaluation; and (3) LIE images for diffuse myocardial fibrosis assessment. Table 1 shows the scanning parameters used in our cardiac SDCT protocol.Table 1. The acquisition parameters of the cardiac computed tomography protocolPre-contrast imagesCCTA imagesLIE imagesTube voltage (kV)120120120Effective mAs (mA)42567100Rotation time (s)0.270.270.27Collimation (mm)64 × 0.62564 × 0.62564 × 0.625Display field of view (mm^2^)400400400Matrix512 × 512512 × 512512 × 512Slice thickness (mm)0.80.90.8Slice gap (mm)0.60.450.2CCTA, Coronary computed tomography angiography; LIE, late iodine enhancement
Cardiac SDCT scanning protocol (Supplementary Figure 1) are briefly described as follows. First, pre-contrast images were acquired using prospective electrocardiogram (ECG)-triggered axial scans. Next, CCTA was performed using retrospective ECG-triggered axial scanning after the intravenous injection of 0.9 ml/kg of iopamidol (370 mg iodine/ml; Bracco Sine Pharma, Shanghai, China) at a flow rate of 4.5–5.0 ml/s through the right antecubital vein, followed by a 25- to 30-ml saline flush at a rate of 4.5–5.0 ml/s.
After CCTA, the additional continuous infusion of 30 ml of contrast agent for 60 s at a flow rate of 0.5 ml/s was immediately performed. Finally, late iodine enhancement (LIE) images were acquired using prospective ECG-triggered axial scans 7 min after contrast administration. The scan was conducted during the mid-diastolic phase, corresponding to 78% of the R-R interval with a ± 3% buffer. During the entire scanning process, the maximum dose of the contrast agent was kept below 100 ml [7]. Oral beta-blockers (Betaloc ZOK, 47.5 mg; AstraZeneca AB, Sweden) was administered 30 min before CT if the patient had a heart rate greater than 70 beats per minute and had not been routinely prescribed beta-blockers. All patients without contraindications received sublingual administration of nitroglycerin (Isosorbide Dinitrate Tablets, 5 mg; Jiangsu Changjiang Pharmaceutical, Jiangsu, China) 5 min before scan.
The effective radiation dose was calculated as follows: dose-length product × conversion factor of 0.014 [22].
CMR image acquisition
All CMR images were acquired from a 1.5-T MR scanner (MAGNETOM Amira, Siemens Medical Systems, Munich, Germany) with an 18-channel cardiac coil. T1 mapping was integrated into our routine clinical imaging protocol including cine steady-state free precession (SSFP) images of the entire heart in short and long axes and late gadolinium enhancement using phase sensitive inversion recovery (PSIR). T1 mapping was acquired on the basal, mid, and apical short-axis layers of the LV myocardium before and 10 min after the administration of gadobutrol (0.15 mmol/kg Gadovist; Bayer Healthcare, Leverkusen, Germany, Germany) using an ECG-gated steady-state free-precession–based modified Look-Locker inversion recovery technique with a 5(3)3 scheme and a 4(1)3(1)2 scheme, respectively (Supplementary Table 1).
ECV derived from CMR T1 mapping and iodine density images
To extract myocardial T1 values to calculate the CMR-ECV, the short axial layers of the LV myocardium were divided into six (basal and mid) or four (apical) segments in accordance with the American Heart Association 16-segment model. Regions of interest (ROIs) were drawn manually on each LV myocardial segment on native and post-contrast T1 maps with dedicated software (CVI42; Circle Cardiovascular Imaging, Calgary, Alberta, Canada) [23].
CT-ECV was measured on the client image viewing system (Spectral CT Viewer, Intellispace Portal; Philips Healthcare, Best, The Netherlands). The iodine density images were reconstructed from LIE scans at a specific cardiac phase, specifically at 78% of the cardiac cycle. Additionally, iodine density images reconstructed at 8-mm slice thickness and 2-mm slice gap on the basal, mid, and apical short-axis planes of the LV myocardium and in correspondence with the CMR T1 mapping.
Next, to extract myocardial iodine density values, the contours of the ROIs of each segment of the LV myocardium and the blood pool on the iodine density images were matched with that of the CMR T1 mapping (Fig. 1). The segments affected by significant artifacts or poor myocardium definition were excluded to avoid distorting the measured values. All the CMR and iodine density images were analyzed by one radiologist (W.C.) with 10 years of experience in cardiac imaging diagnosis, who was blinded to the clinical data.Fig. 1. Regions of interest drawn on T1 mapping and iodine density images. a–c Regions of interest were manually drawn on left ventricular (LV) myocardium images from a control subject according to the American Heart Association’s 16-segment model and on the LV blood pool to calculate the extracellular volume fraction (ECV). Red outline = endocardium, green outline = epicardium, orange outline = blood pool. a Native T1 mapping: Native T1 values at the basal, mid, and apical layers of LV myocardium were 1072 ms, 1059 ms, and 1055 ms, respectively. b Post-contrast T1 mapping: Post-contrast T1 values at the basal, mid, and apical layers of LV myocardium were 427 ms, 406 ms, and 407 ms, respectively. c Iodine density images: Iodine density values at the basal, mid, and apical layers of LV myocardium were 0.88 mg/ml, 0.82 mg/ml, and 0.81 mg/ml, respectively. d CMR-ECV mapping: CMR-ECV at the basal, mid, and apical layers were 25.19%, 25.27%, and 25.88%, respectively. e CT-ECV mapping: CT-ECV at the basal, mid, and apical layers were 26.01%, 24.12%, and 24.18%, respectively. The global CMR-ECV and CT-ECV values were 25.45% and 24.77%, respectively
The endocardial and epicardial contours in T1 mapping and Iodine density images were manually drawn slice by slice by two researchers (J.D. and H.E.Z.) with 1–3 years of experience in cardiac imaging diagnosis.
The ECV values derived from CMR T1 mapping and iodine density images were calculated using the following formulas [10]:
\documentclass[12pt]{minimal} \usepackage{amsmath} \usepackage{wasysym} \usepackage{amsfonts} \usepackage{amssymb} \usepackage{amsbsy} \usepackage{mathrsfs} \usepackage{upgreek} \setlength{\oddsidemargin}{-69pt} \begin{document}$$\begin{aligned} & {\text{CMR}} - {\text{ECV}}\left( \% \right) = \left( {{1}/{\text{T1}}_{{\text{myo post}}} {-}{ 1}/{\text{T1}}_{{\text{myo pre}}} } \right)/\left( {{1}/{\text{T1}}_{{\text{blood post}}} {-}{ 1}/{\text{T1}}_{{\text{blood pre}}} } \right) \times \left( {{1 }{-}{\text{ hematocrit}}} \right) \\ & {\text{CT}} - {\text{ECV}}\left( \% \right) = \left( {{\text{Iodine density}}_{{{\text{myo}}}} /{\text{Iodine density}}_{{{\text{blood}}}} } \right) \times \left( {{1 }{-}{\text{ hematocrit}}} \right) \\ \end{aligned}$$\end{document}Echocardiography for LVEF in patients with NIHF and controls
All patients underwent transthoracic echocardiography (TTE) within 2 to 4 days before cardiac SDCT or CMR examination. Transthoracic echocardiography (TTE) was performed with ultrasound equipment (EPIQ7c, Philips Medical Systems, Best, The Netherlands) and the M5S transducer (frequency range 1.5–5.0 MHz). Cardiac structural, diastolic and systolic parameters were measured including LV end-diastolic diameter (LVEDD) and LV end-systolic diameter (LVESD); LV end-diastolic volume (LVEDV) and LV end-systolic volume (LVESV); LV ejection fraction (LVEF); left atrium volume (LAV); pulmonary artery systolic pressure (PASP), E/A ratio, E/e' ratio, E', tricuspid regurgitation (TR) peak velocity and aortic valve peak gradient (mmHg). The TTE examination protocols and the analysis of the aforementioned cardiac parameters were conducted in accordance with the established guidelines [24]. The TTE was performed by an experienced cardiologist (Y.W.) with over 20 years of expertise in echocardiographic diagnosis.
Statistical analysis
Analysis was performed using SPSS version 23 (IBM, Armonk, New York), GraphPad Prism version 8.0 (GraphPad Software, La Jolla, California), and P < 0.05 was defined as statistically significant.
The normality of data distribution was assessed using the Shapiro–Wilk test. Continuous variables were expressed as mean ± standard deviation (Mean ± SD) or as median and interquartile range, depending on whether the data followed a normal distribution. Categorical variables were presented as counts and percentages. The baseline characteristics between groups were compared using the Mann–Whitney U test and the Fisher exact test. CT-ECV and CMR-ECV were compared using the paired t-test. The difference in CT-ECV among groups was assessed with one-way analysis of variance and the unpaired t-test. The correlation between variables was evaluated with Pearson correlation analysis for parametric data or Spearman correlation analysis for non-parametric data.
The inter- and intra-observer variability was assessed with the intra-class correlation coefficient and the Bland–Altman plot. Bland–Altman analysis was performed to analyze biases and limits of agreement. For intra-observer variability, 20 randomly selected studies from all subjects were re-analyzed by an observer (J.D.) after a 3-month washout period. For inter-observer variability, a second observer (H.E.Z.) independently analyzed the same 20 studies, blinded to the previous results. The median period of follow-up was calculated for the entire study cohort according to the reverse Kaplan–Meier method. Time to event or final status check was taken from the date of SDCT examination. Receiver operating characteristic curve (ROC curve) and area under the curve (AUC) were used to evaluate the prediction model. ROC curve and Youden index determined the optimal cut-off value of CT-ECV.
Kaplan–Meier curve was used to display the distribution of events based on CT-ECV categories. The log-rank test was applied to compare survival curves between different CT-ECV categories. This analysis enables us to evaluate the relationship between MACE and CT-ECV by determining whether there are significant differences in event-free survival among the categorized ECV groups.
Results
Population baseline characteristics
The validation group (G_v_) enrolled 45 patients (45 ± 14 years old, 15 females) (Supplementary Figure 2). The experimental group (G_e_) enrolled 117 subjects, including 82 patients with NIHF and 35 controls, the number of patients in different subgroups within the study population is provided in Supplementary Figure 3. Table 2 summarizes the baseline clinical characteristics of the enrolled subjects, which show that there were no significant differences in age, sex, body mass index, heart rate, and hematocrit level between patients with NIHF and controls.Table 2. Participant characteristicsAll subjects (n = 117)Patients with NIHF (n = 82)Controls (n = 35)P valueAge (years)56.7 ± 11.757.6 ± 13.454.4 ± 5.910.07Male sex (n,%)59 (50.4%)41 (50.0%)18 (51.4%)0.371Heart rate (beats/min)77.0 ± 14.477.7 ± 15.774.9 ± 9.500.373Body Mass Index (kg/m^2^)23.6 ± 3.7023.9 ± 4.0022.6 ± 2.700.052Hematocrit level (%)43.3 ± 6.243.5 ± 6.442.8 ± 5.70.651BNP (ng/L)–532.2 ± 851.6––NT-proBNP (ng/L)–694.3 ± 482.2––Medical historyHypertension (n,%)34 (29.1%)27 (32.9%)7 (20.0%)0.187Diabetes mellitus (n,%)5 (4.27%)4 (4.88%)1 (2.86%)1.000Smoking (n,%)18 (15.4%)15 (18.3%)3 (8.57%)0.145Alcohol (n,%)20 (17.1%)19 (23.2%)1 (2.86%)< 0.05Echocardiographic measurementsLVEF (%)55.6 ± 17.648.3 ± 17.069.2 ± 7.39< 0.05LVEDV (ml)153.1 ± 68.1174.3 ± 70.2105.3 ± 27.7< 0.05LVESV (ml)74.6 ± 58.894.5 ± 61.031.3 ± 12.4< 0.05LVEDD (mm)51.6 ± 11.556.0 ± 11.142.0 ± 4.31< 0.05LVESD (mm)37.8 ± 13.443.5 ± 13.527.7 ± 4.19< 0.05LAV index (mm)36.7 ± 9.6641.2 ± 8.0227.0 ± 3.87< 0.05E/A ratio1.27 ± 1.291.16 ± 0.731.47 ± 1.920.261E/e' ratio16.4 ± 7.0220.3 ± 4.317.26 ± 0.61< 0.05E' (cm/s)5.81 ± 2.124.56 ± 0.818.74 ± 1.12< 0.05TR peak velocity (m/s)2.73 ± 0.402.98 ± 0.452.22 ± 0.05< 0.05PASP (mmHg)34.8 ± 14.738.9 ± 15.123.7 ± 3.79< 0.05AV peak gradient (mmHg)9.38 ± 3.7610.9 ± 4.935.96 ± 0.18< 0.05Data are expressed as mean ± standard deviation or number of patients with percentages in parentheses, as appropriateNIHF, non-ischemic heart failure; LV, left ventricle; EF, ejection fraction; EDV, end-diastolic volume; ESV, end-systolic volume; EDD, end-diastolic dimension; ESD, end-systolic dimension; LAV, left atrium volume; TR peak velocity, tricuspid regurgitation peak velocity; PASP, pulmonary artery systolic pressure; AV, aortic valveP < 0.05 indicates a significant difference between controls and patients with non-ischemic heart failure
Coronary artery degree of stenosis and coronary artery calcium score calculation
The degree of coronary artery stenosis in 82 patients with non-ischemic heart failure was evaluated as follows: Among 82 patients with NIHF, 44 patients showed no visible stenosis (44/82, 54%), 21 patients had minimal stenosis (1–24%) (21/82, 26%), and 17 patients had mild stenosis (25–49%) (17/82, 20%). Coronary artery calcium scores were calculated from pre-contrast images. 63 patients had no calcified plaques (63/82, 76.8%), 18 patients exhibited mild coronary artery calcification (1–100) (18/82, 22.0%), and 1 patient had moderate coronary artery calcification (101 – 300) (1/82, 1.2%).
Radiation dose
The mean radiation dose of our cardiac SDCT protocol and LIE images was 8.96 ± 1.78 mSv and 2.22 ± 0.53 mSv, respectively (Supplementary Table 2).
CT-ECV vs. CMR-ECV in the validation group
In the validation group (Gv), a total of 720 segments of the LV myocardium were analyzed, and 635 (88.19%) of these segments met the analytical requirements.
Segment-based analysis showed that there was no significant difference between CT-ECV and CMR-ECV (all P > 0.05). The CT-ECV and CMR-ECV per-segment values were well correlated (all P < 0.05) (Supplementary Table 3).
Layer-based analysis showed that the differences between CT-ECV and CMR-ECV were not statistically significant (all P > 0.05). In addition, CT-ECV was correlated with CMR-ECV (all P < 0.05). Bland–Altman analysis showed that CT-ECV matched well with CMR-ECV, with an insignificant bias (Supplementary Table 4).
Global-based analysis showed that there was no significant difference between CT-ECV and CMR-ECV (33.10 ± 4.22% vs. 32.80 ± 4.90%; P = 0.293) and that CT-ECV was well correlated with CMR-ECV (r = 0.926; P < 0.05), with a small bias (− 0.30%; 95% CI − 3.97% to 3.38%).
Reproducibility of CT-ECV
The inter- and intra-observer agreement levels for CT-ECV were 0.955 (95% CI 0.919–0.976) and 0.949 (95% CI 0.907–0.972), with wide confidence limits and small biases for inter-observer (bias = − 0.12%; 95% CI − 2.96% to 2.72%) and intra-observer agreement (bias = − 0.16%; 95% CI − 2.19% to 1.87%), respectively.
CT-ECV of patients with NIHF and controls
Segment-based analysis showed that CT-ECV in patients with NIHF was higher than in controls (Supplementary Table 5).
Layer-based analysis showed that CT-ECV in patients with NIHF was significantly higher than in controls (all P < 0.001) (Supplementary Table 6).
Global-based analysis showed that CT-ECV in patients with NIHF was significantly higher than in controls (32.08 ± 4.06% vs. 26.95 ± 2.25%; P < 0.001) (Fig. 2a).Fig. 2CT-ECV values of patients with NIHF and controls. a CT-ECV in patients with non-ischemic heart failure (NIHF) was significantly higher than that found in controls (32.08 ± 4.06% vs. 26.95 ± 2.25%; P < 0.001). b CT-ECV in HFrEF patients was statistically higher than that of HFmEF and HFpEF patients (HFrEF: 34.04 ± 4.01%, HFmEF: 31.80 ± 3.18%, HFpEF: 30.72 ± 3.79%; *: P < 0.05). c CT-ECV differences among patients with NIHF with varied New York Heart Association (NYHA) Classes (NYHA I: 28.33 ± 2.28%, NYHA II: 30.60 ± 2.65%, NYHA III: 32.87 ± 3.24%, NYHA IV: 38.30 ± 2.76%; *: P < 0.05). Cs, controls
Subgroup-based analysis of patients with NIHF showed that CT-ECV in HFrEF patients was statistically higher than that of HFmEF and HFpEF patients (HFrEF: 34.04 ± 4.01%, HFmEF: 31.80 ± 3.18%, HFpEF: 30.72 ± 3.79%) (Fig. 2b). It also showed CT-ECV differences between patients with NIHF with varied NYHA Classes (NYHA I: 28.33 ± 2.28%, NYHA II: 30.60 ± 2.65%, NYHA III: 32.87 ± 3.24%, and NYHA IV: 38.30 ± 2.76%; all P < 0.05) (Fig. 2c). CT-ECV was negatively correlated with LVEF (r = − 0.402; P < 0.001) and positively correlated with NYHA Classification (r = 0.687; P < 0.001) (Fig. 3). Supplementary Table 7 and Table 8 summarizes the baseline clinical characteristics of subgroups. Fig. 3. Correlations between CT-ECV, LVEF and NYHA classification. a CT-ECV had a negative correlation with left ventricular ejection fraction (r = – 0.402; P < 0.001). b and a positive correlation with NYHA classification (r = 0.687; P < 0.001)
Clinical outcomes
Clinical outcome data were collected from 82 patients with NIHF after a median follow up of 10 months (interquartile range: 5 to 13). Final status check was performed during March 2023, and 7 patients lost follow-up. Among the 75 patients with NIHF, 31 patients experienced MACE (31/75, 41.3%), including 28 patients with NIHF who were hospitalized for heart failure (28/75, 37.3%), 1 patient with NIHF experienced cardiovascular mortality (28/75, 1.3%), and 2 patients with NIHF experienced all-cause mortality (2/75, 2.7%). The ROC curves demonstrated CT-ECV ≥ 31.29% to be the optimal cut-off point for MACE with 83.9% sensitivity, 75% specificity and the area under the ROC curve = 0.863 (95% CI 0.782 to 0.944) (Fig. 4a). Kaplan–Meier survival curves and Log-rank test demonstrated that NIHF patients with CT-ECV ≥ 31.29% had higher probability of MACE than NIHF patients with CT-ECV < 31.29% (Fig. 4b).Fig. 4. Correlation of CT-ECV and MACE. a Receiver operating characteristic (ROC) curves of CT-ECV against MACE. Cut-off value = 31.29%. b Kaplan–Meier curve of MACE probability based on CT-ECV level. AUC, area under the curve
Discussion
In the current study, we calculated LIE-derived ECV on iodine density images using SDCT, and we demonstrated the following: (1) that CT-ECV had good reproducibility and accuracy, potentially serving as a promising and practical alternative to CMR-ECV; and (2) that CT-ECV had the potential to assist with risk stratification among patients with NIHF.
Currently, ECV derived from CMR T1 mapping, as an established modality, is based on the T1 relaxation time of the LV myocardium and the blood pool before and after gadolinium injection. Gadolinium is an extracellular agent that is distributed in the extracellular space. Normally, within seconds or minutes of intravenous administration, contrast materials are “washed into” the extracellular space without entering into the cell and then “washed out” from the extracellular space several minutes after injection. However, in a variety of cardiomyopathies, diffuse myocardial fibrosis develops into the expansion of the extracellular matrix, which then causes contrast materials to accumulate more in the extracellular space. The extracellular contrasts are then “washed out” more slowly [8], eventually generating theoretically measurable signal changes that can be assessed via the application of magnetic resonance imaging.
LIE-derived CT-ECV has demonstrated its potential to quantify diffuse myocardial fibrosis in some previous studies based on iodine contrast media, which have kinetics similar to those of gadolinium [9, 25]. Bandula et al. [6] developed and validated an equilibrium contrast-enhanced CT protocol that involved continuous infusion after bolus injection and demonstrated that CT-ECV in patients with aortic stenosis was strongly correlated with the histological quantification of myocardial fibrosis and with CMR-ECV. These previous studies indicated that CT-ECV was comparable to CMR-ECV and correlated with histological collagen volume fraction. However, these prior studies have some limitations, such as cumbersome processes, restricted application, and insufficiently comprehensive analysis. In the current study, we demonstrated that CT-ECV–derived iodine density images using SDCT showed good reproducibility and correlated well enough with CMR-ECV, which is in line with the results of previous studies [6, 9]. Moreover, we have managed to remedy the shortcomings of those previous studies. First, for example, we used the head-to-head comparison of CT-ECV and CMR-ECV on a per-segment, per-layer (basal, mid, and apical) basis to accurately and meticulously evaluate the feasibility of CT-ECV. Second, we measured CT-ECV to obviate ROIs drawn on pre-contrast images, which avoided the sophisticated registration between pre- and post-contrast images and thus reduced misregistration errors. Third, the application of CT-ECV is simplified and routine without additional prospective decisions.
As compared with previous studies, the present study has further explored the value of CT-ECV for risk stratification among patients with NIHF. It was found that CT-ECV among patients with NIHF was significantly higher than that among controls. This finding indicates that increased CT-ECV implies the presence of diffuse fibrosis and that it is feasible to use CT-ECV as a diagnostic index in clinical settings to differentiate healthy subjects from patients with disease [21, 26]. In addition, higher CT-ECV values are found in patients with more severe HF, thus demonstrating that the remodeling of the extracellular matrix or myocardial fibrosis is likely associated with a decline in ventricular function across different types of NIHF and that CT-ECV can reflect the course of disease.
Furthermore, we demonstrated that, in patients with NIHF, CT-ECV remains a significant outcome predictor. Thus, in the assessment of patients with NIHF, CT-ECV may play a valuable role in risk stratifying patients with patients with NIHF in clinical setting.
With the advent of advanced CT technologies like dual-energy CT, spectral CT, and even photon-counting CT, the application of coronary CT angiography (CCTA) in cardiovascular diseases has broadened significantly beyond traditional coronary artery assessments. CCTA now allows comprehensive evaluation of cardiac function (e.g., LVEF, myocardial strain), myocardial perfusion and fibrosis [27–29]. CT-based measurements, like global longitudinal strain, are particularly useful in patients with congenital valve disease or coronary stenosis and have been shown to be more sensitive in detecting early systolic dysfunction [27, 28]. Virtual single-energy imaging using spectral detector CT (SDCT) or photon-counting CT dramatically improves the visualization of coronary arteries, offering superior image quality with reduced contrast media, without increasing radiation exposure [30]. Additionally, SDCT enables precise mapping of iodine distribution during first-pass myocardial perfusion, which provides essential data for diagnosing ischemic and non-ischemic cardiomyopathy. By evaluating coronary flow reserve (e.g., FFRCT ≤ 0.75) in conjunction with myocardial iodine perfusion, SDCT delivers critical functional information crucial for coronary artery disease management [31]. Moreover, late iodine enhancement imaging is valuable in detecting myocardial fibrosis in both ischemic and non-ischemic conditions (e.g., hypertrophic cardiomyopathy, aortic stenosis) [26, 32]. Our research demonstrates that LIE-derived CT-ECV is a reliable quantitative tool for assessing diffuse fibrosis in non-ischemic heart failure, with high reproducibility and correlation in predicting MACE. This contributes a crucial piece to completing the puzzle of one-stop cardiac examination via CCTA. Thus, advancements in CT technology offer a more holistic evaluation of cardiac disease, aiding clinicians in making more informed treatment decisions.
During CT-ECV evaluation, the timing of LIE scanning after contrast injection is crucial. The optimal timing for LIE has not been universally determined, but studies have suggested different timings ranging from 5 to 15 min after injection [7, 8, 10]. In our study, we selected 7 min after contrast injection as the optimal timing for LIE due to its superior image quality and efficiency. However, further verification is needed through future animal experiments to determine the optimal timing for LIE using SDCT.
In our study, the validation group (Gv) consisted of 45 patients who underwent both echocardiographic and cardiac magnetic resonance (CMR) assessments of left ventricular ejection fraction (LVEF). The results indicated that the LVEF assessed by echocardiography was significantly higher than that by CMR (48.72 ± 18.45% vs. 38.02 ± 22.44%, P < 0.001). These discrepancies may stem from differences in imaging modalities and assessment techniques. Previous studies have demonstrated that echocardiography tends to overestimate LVEF in patients with severe heart failure, especially those with dilated cardiomyopathy (CMR: 46 ± 14% vs. 2D Echo: 56 ± 15%, P < 0.001) [33]. While CMR is considered the gold standard for evaluating ventricular volumes and cardiac function [34], current international guidelines predominantly rely on echocardiographic assessments when classifying heart failure patients [15]. Therefore, we classified the validation group in our subsequent studies based on echocardiographic results to align with clinical practice. In view of this, it is necessary for future research to further explore the feasibility of incorporating CMR into routine clinical practice. This would contribute to enhancing the accuracy of heart failure classification, optimizing patient management, and providing a more reliable basis for clinical decision-making.
Study limitations
First, CT-ECV involves exposure to additional radiation. Nevertheless, the mean radiation dose of our cardiac SDCT protocol is lower than that of previous studies [5, 10]. In addition, since the combination of LIE with CCTA in our study accomplished the evaluation of cardiac structure and function, the coronary arteries, and tissue characteristics in a “one-stop shop” examination, it offers more clinical benefits to patients with known or suspected HF, which may offset some of its drawback. Third, because our CT-ECV results were not validated by the gold standard of histology biopsy, we performed a head-to-head comparison with CMR-ECV, a well-recognized gold standard for the noninvasive evaluation of diffuse myocardial fibrosis. This was done to validate the feasibility of CT-ECV. Last, we did not establish and analyze CT-ECV in different disease subgroups, but this also makes CT-ECV applicable to a wider range of diseases. In our future studies, we will further explore CT-ECV in disease surveillance and prognostic assessment for different cardiac diseases.
Conclusion
In conclusion, this study shows that ECV derived from LIE on iodine density images using SDCT is a promising practical alternative to CMR-ECV for the noninvasive quantification of diffuse myocardial fibrosis and has the potential to assist with risk stratification among patients with NIHF.
Supplementary Information
Below is the link to the electronic supplementary material.Supplementary file1 (DOCX 840 KB)