Correction: Development of metabolic signatures of plant-rich dietary patterns using plant-derived metabolites
Yong Li, Yifan Xu, Melanie Le Sayec, Tim D. Spector, Claire J. Steves, Cristina Menni, Rachel Gibson, Ana Rodriguez-Mateos

Abstract
Genes, proteins, chemicals, diseases, species, mutations and cell lines named across the full text — each resolved to its canonical identifier and authoritative record.
Click any figure to enlarge with its caption.
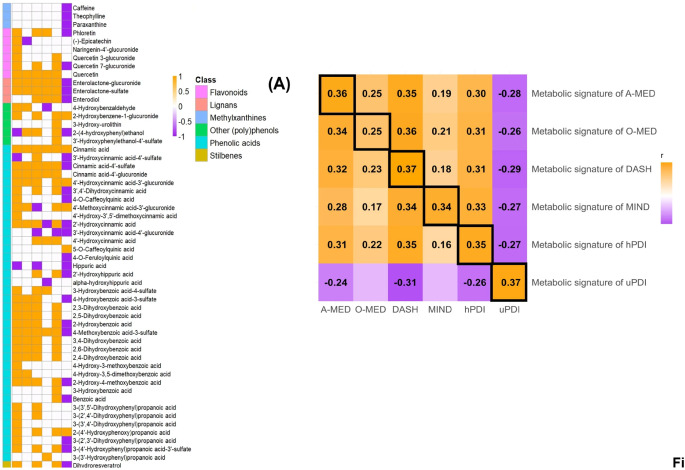 Figure 1
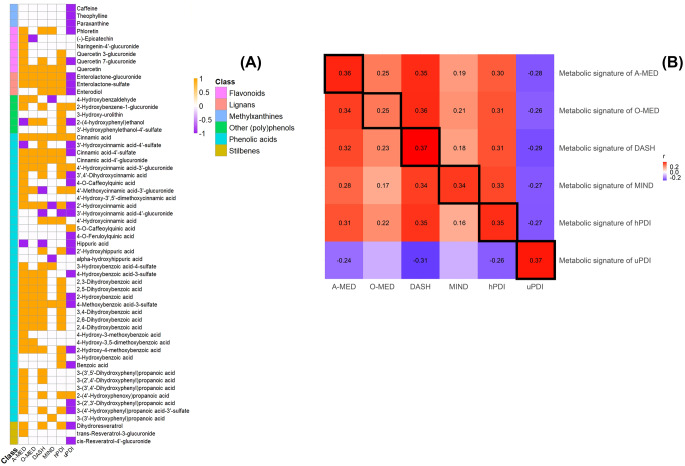 Figure 2
Peer Reviews
No public reviews on file for this paper yet. If you reviewed it on a platform where reviews are public (OpenReview, ICLR, NeurIPS, ICML), you can paste yours below so the community can read it here.
Videos
No videos yet. Explain this paper in a talk, walkthrough, or lecture? Add one.
Taxonomy
TopicsNutrition, Genetics, and Disease
European Journal of Nutrition (2025) 64:29
10.1007/s00394-024-03511-x
In the original version of this article, in Fig. 3, x axis was missing together with a couple of rows of the heatmap on the left and the label B was missing.
Figure 3, which previously appeared as
Fig. 3(A) Selected metabolites for each dietary pattern metabolic signature and (B) Correlation matrix between dietary patterns and metabolic signatures from the derivation set in the POLYNTAKE cohort with 24 h urine sample (n = 218). (A) The overlapping and distinct sets of the selected metabolites from each plant-rich dietary pattern. Yellow, purple, and white illustrated significant positive, negative, and nonsignificant associations in each dietary score. (B) The dietary scores were measured by FFQ. The metabolic signatures were derived based on the selected metabolites that were significantly associated with each plant-rich dietary score. The colour scale indicated the Spearman correlation coefficient between plant-rich dietary patterns and metabolic signatures. Red and blue illustrated positive and negative correlations and colour intensity represented the degree of the coefficient. The correlation with significance has listed the coefficient (FDR-adjusted, p ≤ 0.05). DASH, Dietary Approaches to Stop Hypertension; MIND, Mediterranean-DASH Intervention for Neurodegenerative Delay; O-MED, Original Mediterranean Score; A-MED, Amended Mediterranean Score; hPDI, Healthy Plant-based Diet Index; uPDI, unhealthy Plant-based Diet Index
but should have appeared as
Fig. 3(A) Selected metabolites for each dietary pattern metabolic signature and (B) Correlation matrix between dietary patterns and metabolic signatures from the derivation set in the POLYNTAKE cohort with 24 h urine sample (n = 218). (A) The overlapping and distinct sets of the selected metabolites from each plant-rich dietary pattern. Yellow, purple, and white illustrated significant positive, negative, and nonsignificant associations in each dietary score. (B) The dietary scores were measured by FFQ. The metabolic signatures were derived based on the selected metabolites that were significantly associated with each plant-rich dietary score. The colour scale indicated the Spearman correlation coefficient between plant-rich dietary patterns and metabolic signatures. Red and blue illustrated positive and negative correlations and colour intensity represented the degree of the coefficient. The correlation with significance has listed the coefficient (FDR-adjusted, p ≤ 0.05). DASH, Dietary Approaches to Stop Hypertension; MIND, Mediterranean-DASH Intervention for Neurodegenerative Delay; O-MED, Original Mediterranean Score; A-MED, Amended Mediterranean Score; hPDI, Healthy Plant-based Diet Index; uPDI, unhealthy Plant-based Diet Index
The original article has been corrected.