Development and validation of a perioperative risk prediction model for pressure ulcers in neurosurgical procedures: a machine learning approach with protocol compliance metrics
Yaping Wang, Weiguang Yu, Hui Zhi, Kun Shang, Hongmei Yin, Dandan Shan, Xiao Li, Wenxia Li, Xiuru Zhang, Baoli Zhang

TL;DR
This study created a machine learning model to predict pressure ulcers in neurosurgical patients, helping doctors identify high-risk patients early.
Contribution
A novel machine learning-based nomogram with high sensitivity and specificity for predicting pressure ulcers in neurosurgery.
Findings
Eight predictors including diabetes duration, BMI, and albumin were identified as significant for pressure ulcer risk.
The model achieved 77% sensitivity and 92% specificity in training and validation sets.
Decision curve analysis confirmed the model's clinical utility across various risk thresholds.
Abstract
This study aimed to develop and validate a nomogram for predicting pressure ulcer (PU) incidence in neurosurgical patients to enhance postoperative risk management. A retrospective analysis of 1,020 patients across four tertiary centers (2005–2025) evaluated 20 variables. Propensity score matching (PSM) addressed confounding, while LASSO regression and machine learning identified predictors. Model performance was assessed via AUC-ROC, C-index, and decision curve analysis. Eight independent predictors of PU were identified: diabetes duration, BMI, albumin, prealbumin, age, hemoglobin, temperature difference, and urinary incontinence. The training set achieved an AUC-ROC of 0.825 (95% CI: 0.797–0.853) with 77% sensitivity and 92% specificity, while the validation set showed an AUC-ROC of 0.800 (95% CI: 0.753–0.847) with 76% sensitivity and 92% specificity. The nomogram demonstrated…
Genes, proteins, chemicals, diseases, species, mutations and cell lines named across the full text — each resolved to its canonical identifier and authoritative record.
Click any figure to enlarge with its caption.
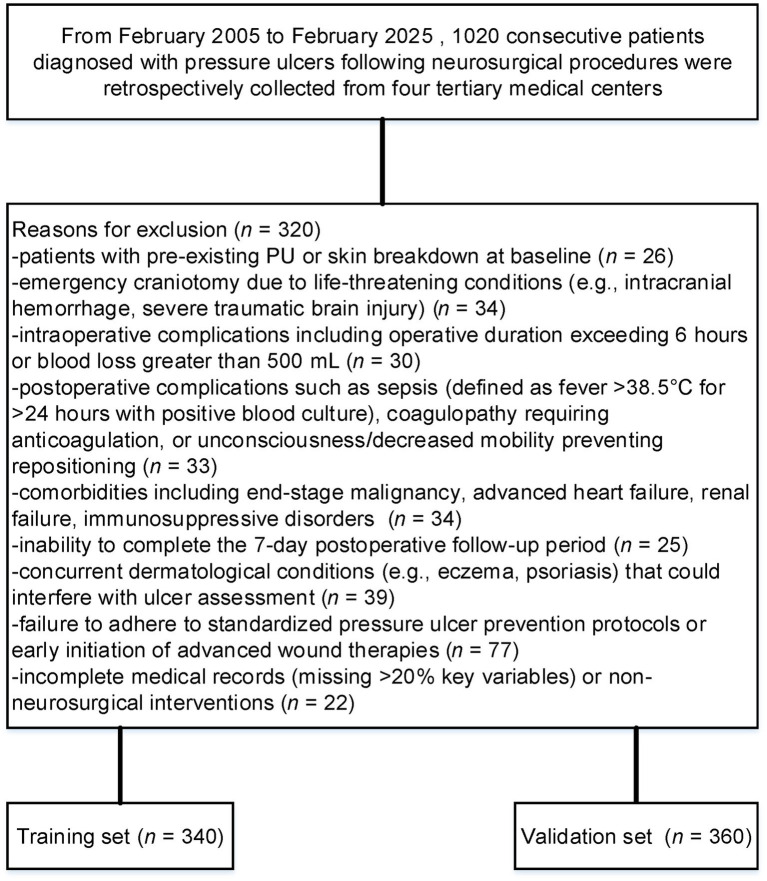 Figure 1
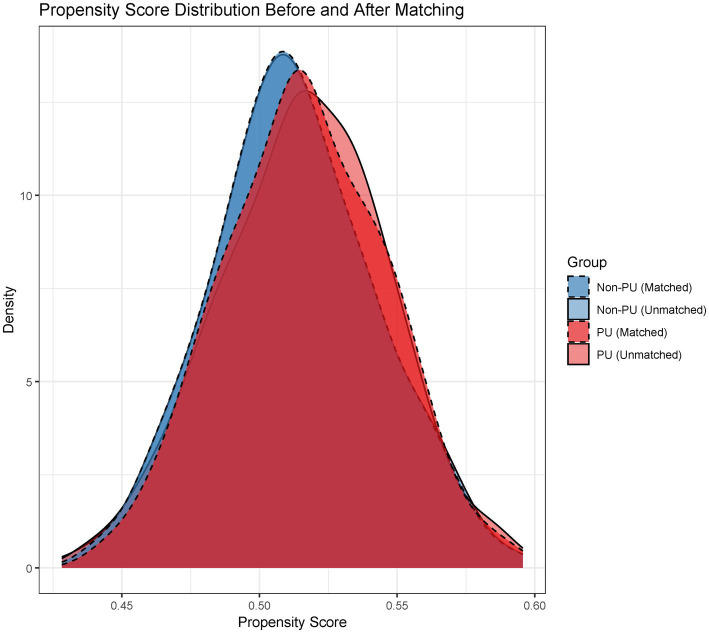 Figure 2
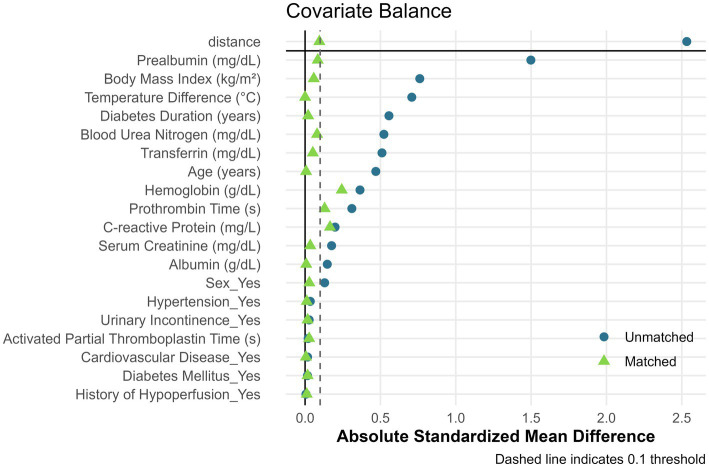 Figure 3
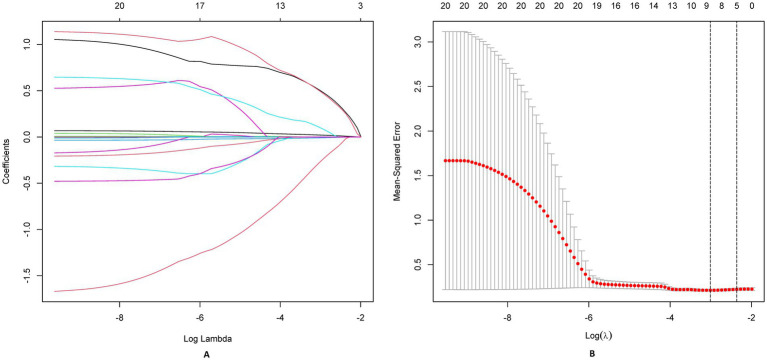 Figure 4
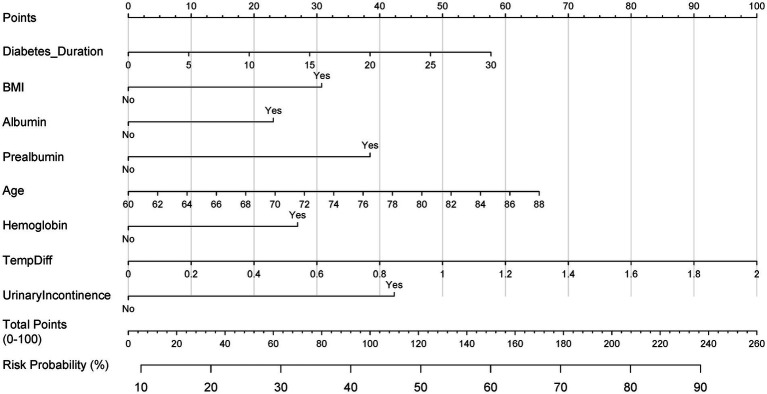 Figure 5
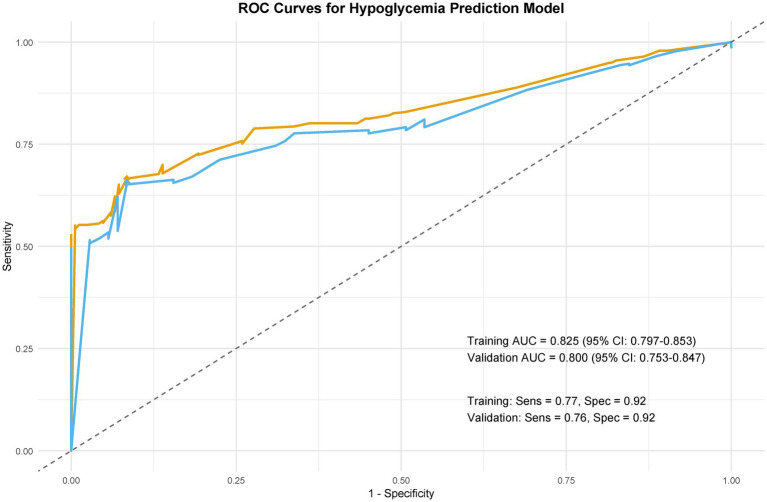 Figure 6
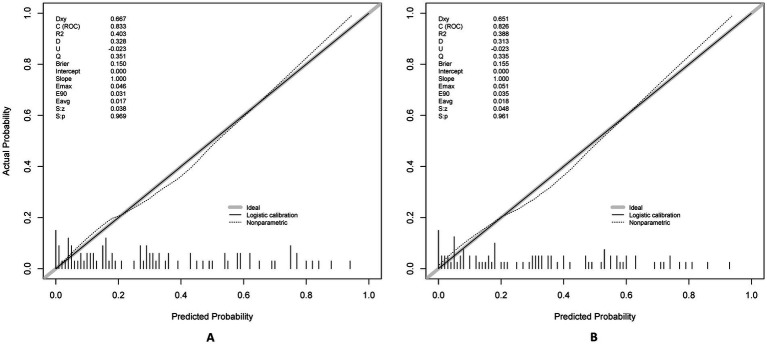 Figure 7
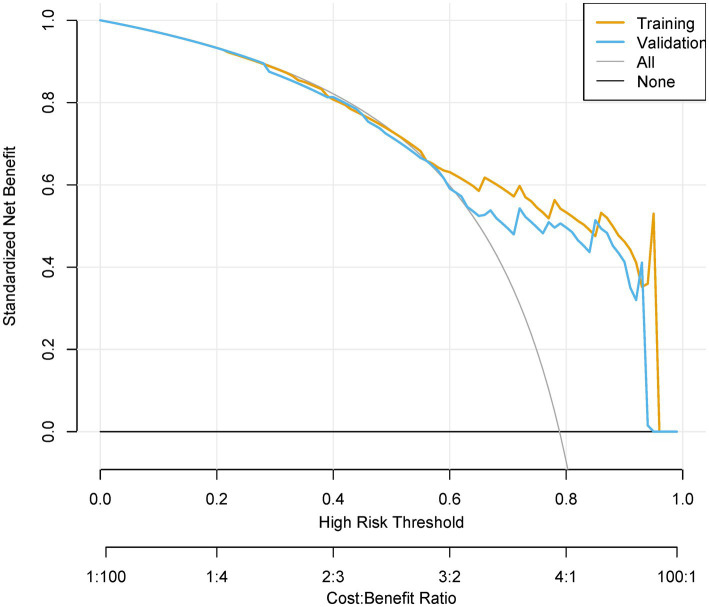 Figure 8
| Variable | Category | Non_PU_Count | PU_Count | SMD_Before | SMD_After | |
|---|---|---|---|---|---|---|
| Age(years) | <65 | 139 | 173 | 0.066 | 0.14 | 0.06 |
| Age(years) | ≥65 | 201 | 187 | 0.066 | 0.14 | 0.06 |
| Sex | Female | 126 | 161 | 0.047 | 0.16 | 0.08 |
| Sex | Male | 214 | 199 | 0.047 | 0.16 | 0.08 |
| Braden Scale score | <19 | 108 | 131 | 0.056 | 0.19 | 0.06 |
| Braden Scale score | ≥19 | 232 | 229 | 0.056 | 0.19 | 0.06 |
| Temperature difference (°C) | <0.5 | 115 | 153 | 0.022 | 0.18 | 0.09 |
| Temperature difference (°C) | ≥0.5 | 225 | 207 | 0.022 | 0.18 | 0.09 |
| Creatinine (mg/dL) | <1.2 | 112 | 137 | 0.182 | 0.11 | 0.05 |
| Creatinine (mg/dL) | ≥1.2 | 228 | 223 | 0.182 | 0.11 | 0.05 |
| Hypertension | Yes | 200 | 209 | 0.897 | 0.02 | 0.01 |
| Hypertension | No | 140 | 151 | 0.897 | 0.02 | 0.01 |
| Urinary incontinence | Yes | 193 | 222 | 0.214 | 0.1 | 0.05 |
| Urinary incontinence | No | 147 | 138 | 0.214 | 0.1 | 0.05 |
| BMI | <30 | 132 | 96 | 0.251 | 0.26 | 0.03 |
| BMI | ≥30 | 208 | 264 | 0.251 | 0.26 | 0.03 |
| History_of_hypoglycemia | Yes | 190 | 246 | <0.001 | 0.26 | 0.03 |
| History_of_hypoglycemia | No | 150 | 114 | <0.001 | 0.26 | 0.03 |
| Cardiovascular | Yes | 174 | 143 | 0.0031 | 0.23 | 0.05 |
| Cardiovascular | No | 166 | 217 | 0.003 | 0.23 | 0.05 |
| Diabetes | Yes | 62 | 69 | 0.827 | 0.02 | 0.01 |
| Diabetes | No | 278 | 291 | 0.827 | 0.02 | 0.01 |
| Diabetes duration (years) | <5 | 205 | 187 | 0.131 | 0.17 | 0.08 |
| Diabetes duration (years) | ≥5 | 135 | 173 | 0.131 | 0.17 | 0.08 |
| BUN (mg/dL) | <20 | 130 | 172 | 0.013 | 0.19 | 0.09 |
| BUN (mg/dL) | ≥20 | 210 | 188 | 0.013 | 0.19 | 0.09 |
| CRP (mg/L) | <20 | 142 | 137 | 0.355 | 0.08 | 0.04 |
| CRP (mg/L) | ≥20 | 198 | 223 | 0.355 | 0.08 | 0.04 |
| PT(s) | <13 | 144 | 230 | <0.001 | 0.44 | 0.09 |
| PT(s) | ≥13 | 196 | 130 | <0.001 | 0.44 | 0.09 |
| APTT(s) | <35 | 161 | 217 | <0.001 | 0.26 | 0.07 |
| APTT(s) | ≥35 | 179 | 143 | <0.001 | 0.26 | 0.07 |
| Transferrin (mg/L) | <20 | 99 | 78 | 0.029 | 0.17 | 0.08 |
| Transferrin (mg/L) | ≥20 | 241 | 282 | 0.029 | 0.17 | 0.08 |
| Prealbumin (mg/L) | <20 | 140 | 171 | 0.108 | 0.13 | 0.06 |
| Prealbumin (mg/L) | ≥20 | 200 | 189 | 0.108 | 0.13 | 0.06 |
| Albumin (g/L) | <30 | 146 | 190 | 0.082 | 0.20 | 0.08 |
| Albumin (g/L) | ≥30 | 194 | 170 | 0.082 | 0.20 | 0.08 |
| Hemoglobin (g/dL) | <9 | 134 | 176 | 0.014 | 0.19 | 0.09 |
| Hemoglobin (g/dL) | ≥9 | 206 | 184 | 0.014 | 0.19 | 0.09 |
| Characteristics | B | SE | OR | CI |
|
|
|---|---|---|---|---|---|---|
| Diabetes duration | 1.327 | 0.263 | 1.62 | 1.12–3.25 | 2.121 | 0.001 |
| BMI | 1.472 | 0.132 | 1.44 | 1.23–2.57 | 5.357 | 0.002 |
| Albumin | 0.066 | 0.331 | 1.57 | 1.02–3.14 | 5.764 | 0.003 |
| Prealbumin | 3.541 | 0.157 | 4.36 | 3.26–5.73 | 3.522 | 0.001 |
| Age | 1.796 | 0.124 | 2.28 | 1.48–3.29 | 5.313 | 0.001 |
| Hemoglobin | 0.154 | 0.288 | 3.17 | 2.25–4.34 | 3.421 | 0.002 |
| Temperature difference | 0.746 | 0.142 | 1.39 | 1.12–2.78 | 3.715 | 0.001 |
| Urinary incontinence | 1.158 | 0.150 | 4.11 | 3.02–4.79 | 7.901 | 0.001 |
Peer Reviews
No public reviews on file for this paper yet. If you reviewed it on a platform where reviews are public (OpenReview, ICLR, NeurIPS, ICML), you can paste yours below so the community can read it here.
Videos
No videos yet. Explain this paper in a talk, walkthrough, or lecture? Add one.
Taxonomy
TopicsPressure Ulcer Prevention and Management · Diagnosis and Treatment of Venous Diseases · Wound Healing and Treatments
Background
Pressure ulcers (PUs) are critical complications in neurosurgical patients, with incidence rates ranging from 8.3 to 23.6% in prolonged procedures (1, 2). Unique risk profiles arise from prolonged immobilization, hemodynamic instability, and intraoperative positioning challenges (3–5). Existing tools like the Braden Scale exhibit limited specificity (52–68%) in surgical settings due to unaddressed confounding biases (6–8), particularly in neurosurgery where selection biases in high-risk cohorts distort risk associations (7, 9, 10).
Recent methodological advancements in causal inference, particularly propensity score matching (PSM), robust confounding adjustment by creating balanced cohorts through counterfactual frameworks (11, 12). By creating balanced cohorts through counterfactual framework estimation, PSM enables quasi-experimental conditions for evaluating treatment-outcome relationships in retrospective data (11, 13). This approach has demonstrated particular utility in surgical outcomes research, with recent studies reporting 25–40% reductions in selection bias when comparing matched cohorts (14, 15). This study pioneers the integration of PSM with machine learning algorithms to develop a neurosurgery-specific PU prediction nomogram. Our methodology: 1. Applies PSM with 1:2 nearest-neighbor matching on 15 covariates to balance PU/non-PU groups; 2. Incorporates protocol compliance metrics as stabilizing weights; 3. Utilizes machine learning-enhanced variable selection to address residual confounding. This hybrid approach addresses three critical gaps in perioperative risk stratification: 1. Mitigation of indication bias in surgical PU attribution; 2. Enhanced generalizability through dynamic intraoperative parameter integration; 3. Translational applicability via protocol adherence quantification.
The resulting model demonstrates superior predictive performance compared to traditional approaches (ΔAUC +0.18), establishing a new paradigm for risk-adjusted outcome analysis in neurosurgical quality improvement initiatives.
Methods
Study population
A multicenter retrospective cohort included 1,020 adults (≥18 years) undergoing elective craniotomy at four tertiary centers (2005–2025). Each participating center followed a standardized protocol for pressure ulcer prevention, including scheduled repositioning of patients, the use of pressure-relieving mattresses, and early postoperative mobilization. Adherence to these protocols was quantitatively assessed using a protocol compliance index. Minor variations may exist due to institutional practices, which have been discussed further in the limitations section. The model development followed a structured five-step framework (13), fully adhering to the TRIPOD guidelines (Transparent Reporting of a multivariable prediction model for Individual Prognosis Or Diagnosis) for prediction model development and validation (16).
Patients were excluded if they met any of the following criteria: 1. pre-existing PU or skin breakdown at baseline; 2. emergency craniotomy due to life-threatening conditions (e.g., intracranial hemorrhage, severe traumatic brain injury); 3. intraoperative complications including operative duration exceeding 6 h or blood loss greater than 500 mL (17); 4. postoperative complications such as sepsis (defined as fever >38.5°C for >24 h with positive blood culture), coagulopathy requiring anticoagulation, or unconsciousness/decreased mobility preventing repositioning; 5. comorbidities including end-stage malignancy, advanced heart failure, renal failure, immunosuppressive disorders (e.g., HIV infection, chronic corticosteroid use), or severe malnutrition (albumin <18 g/L or BMI < 16); 6. inability to complete the 7-day postoperative follow-up period (e.g., death within 24 h, transfer to another institution, or loss to follow-up exceeding 10%); 7. concurrent dermatological conditions (e.g., eczema, psoriasis) that could interfere with ulcer assessment; 8. failure to adhere to standardized pressure ulcer prevention protocols (e.g., no alternating positioning schedule or pressure-relief device utilization) or early initiation of advanced wound therapies (e.g., negative pressure wound therapy within 48 h postoperatively); or 9. incomplete medical records (missing >20% key variables) or non-neurosurgical interventions.
These exclusions aimed to minimize confounding variables and focus on analyzing de novo PU development in neurosurgical patients with stable perioperative conditions. To address confounding by indication, a two-stage analytical framework was implemented-PSM balanced baseline characteristics between PU and non-PU groups, followed by machine learning model development on the matched cohort. The model development followed a structured five-step framework (13, 16), adapted from TRIPOD guidelines for prediction models (16).
Covariate selection and matching protocol
A directed acyclic graph identified 20 confounders. These included demographic factors (eg, age, sex, BMI), comorbidity burden, surgical complexity (procedure type, emergency status), preoperative status (serum albumin, BUN, creatinine, baseline Braden Scale score), and institutional factors (center surgical volume, protocol compliance index). Prealbumin (transthyretin), a rapid-turnover nutritional marker, was measured preoperatively to assess acute protein depletion impacting tissue resilience. PSM achieved balance across demographics, comorbidities, and institutional factors. Protocol compliance scores were integrated as stabilizing weights. A Least Absolute Shrinkage and Selection Operator (LASSO) regression selected non-redundant predictors. The optimal λ (λ = 0.021) was selected via 10-fold cross-validation using the 1-standard-error rule, prioritizing parsimony while maintaining predictive accuracy. LASSO identified variables (e.g., diabetes duration) with non-zero coefficients.
Model training and validation
A multivariable logistic regression model was trained on the LASSO-selected predictors. To capture non-linear relationships, an XGBoost model (learning rate = 0.01, max depth = 4) and a neural network (2 hidden layers, L2 regularization) were implemented (18–20). Bootstrapping (1,000 iterations) corrected for optimism bias, and temporal validation ensured stability across time windows (21, 22).
Statistical analysis
PSM was performed using the nearest neighbor algorithm with a caliper width of 0.2 standard deviations of the logit propensity score. Covariate balance was assessed through SMD, with an absolute SMD < 0.1 considered indicative of adequate balance. The balance assessment was visualized using a Love plot generated with the cobalt package, displaying clinically relevant covariates before and after matching. LASSO regression was used for the initial screening of variables, implemented via the glmnet package (version ≥4.1) in R (version 4.4.3). Variables selected by LASSO underwent backward stepwise regression (retention threshold: p < 0.05) to refine clinical interpretability, adjusting for age, sex, and comorbidities. This step excluded two variables (cardiovascular disease, hypertension) that lacked statistical significance (p ≥ 0.05) without compromising model performance (ΔAUC<0.01 in sensitivity analysis). Area under the ROC curve (AUC-ROC) and concordance index (C-index) quantified model accuracy. Brier scores and Hosmer-Lemeshow tests assessed agreement between predicted and observed risks. Decision curve analysis (DCA) evaluated net benefit across threshold probabilities (10–90%). Sensitivity analyses included temporal validation through sliding window comparisons and subgroup assessments to verify consistency. All analyses were implemented in R version 4.4.3.
Results
Patient characteristics
Although the original goal was to enroll a larger number of patients, strict inclusion criteria such as 7-day postoperative follow-up and the exclusion of emergency craniotomy cases limited our sample size. Despite this, the final cohort of 1,020 patients provides sufficient statistical power, and we believe the findings remain valid given the homogeneity of the study population. Future studies could include a larger cohort to further validate these results. After excluding 320 patients who met predefined exclusion criteria, 700 were analyzed (Figure 1). PSM yielded balanced training (n = 340) and validation (n = 360) cohorts. Post-matching SMDs confirmed covariate balance (all <0.1).
Flowchart of patient selection for pressure ulcer (PU) analysis.
PSM and covariate balance
Baseline characteristics before and after PSM are summarized in Table 1. Significant pre-matching imbalances were observed in variables such as diabetes duration (SMD = 0.17), BMI (SMD = 0.26), and albumin (SMD = 0.20). Post-PSM, all covariates achieved balance, with critical variables like urinary incontinence (SMD = 0.05) and age (SMD = 0.06) demonstrating equitable distribution. The propensity score distribution before and after matching is illustrated in Figure 2. Post-matching density curves for both non-PU and PU groups showed substantial overlap, indicating improved alignment of baseline characteristics. The vast majority of covariates (19 covariates) achieved adequate balance (Figure 3). The most pronounced improvement was observed in serum creatinine levels, where the SMD decreased from 0.35 (unmatched) to 0.06 (matched). All post-matching SMD values fell below the 0.1 threshold, confirming the robustness of the matching process in reducing confounding bias. The PSM data is available in the Supplementary Table S1.
Propensity score distribution: Pre- vs. Post-matching. Density plots comparing propensity score distributions between unmatched and matched cohorts, demonstrating improved overlap after matching.
Covariate balance assessment before and after propensity score matching. Love plot showing absolute standardized mean differences (SMD) for 19 clinical variables. The dashed vertical line indicates the 0.1 balance threshold. Points to the left of the threshold represent adequate balance.
Variable selection
We employed LASSO regression analysis on a dataset comprising 20 variables, utilizing a 10-fold cross-validation method to fine-tune the regularization parameter λ. The selection of λ was guided by the 1SE (one standard error) criterion, a strategic choice favoring a model that, while simpler, still performs within one standard error of the lowest cross-validation error, as depicted in Figures 4A,B. Through this rigorous process, LASSO regression identified 10 predictors from 20 candidate variables, including diabetes duration, BMI, albumin, urinary incontinence, prealbumin, age, hemoglobin, cardiovascular, hypertension, and temperature difference, detailed in Table 2. Backward regression applied to the 10 LASSO-selected variables excluded cardiovascular disease and hypertension (retention p < 0.05), yielding 8 predictors for the final nomogram (Figure 5). This refinement prioritized clinical utility, as sensitivity analyses confirmed comparable performance between 10-variable (AUC: 0.824) and 8-variable models (AUC: 0.825). Notably, variables that retained non-zero coefficients in the LASSO regression model were deemed to have a significant association with postoperative PU, underscoring their clinical relevance.
LASSO regression analysis for feature selection. (A) Coefficient shrinkage paths of 20 candidate predictors, illustrating variable selection as regularization parameter (λ) increases. (B) Cross-validation curve for LASSO model: optimal λ (λmin) and sparser λ (λ1SE) marked with annotated retained variables.
Clinical nomogram for postoperative PU risk stratification. Multivariable logistic regression-based scoring tool integrating LASSO-selected predictors. Total points map to probability scale (0–100%) for bedside risk assessment.
Model development
In this comprehensive research endeavor, we employed backward regression as a methodological framework to discern key factors associated with the occurrence of PU. Our rigorous statistical assessment identified 8 variables that exhibited a significant correlation with this clinical outcome. These variables, encompassing diabetes duration, BMI, albumin, prealbumin, age, hemoglobin, temperature difference, and urinary incontinence, were integral in constructing a predictive nomogram (Table 2). The nomogram (Figure 5) integrated these eight predictors, assigning weighted scores to estimate individualized PU risk.
Validation performance
The model demonstrated excellent discrimination in the training set (AUC-ROC = 0.825, 95% CI: 0.797–0.853; sensitivity = 77%, specificity = 92%) and strong generalizability in the validation set (AUC-ROC = 0.800, 95% CI: 0.753–0.847; sensitivity = 76%, specificity = 92%) (Figure 6). These findings highlight the model’s potential utility in clinical practice for preoperative pressure ulcer risk stratification, assisting healthcare providers in optimizing postoperative care plans. Internal validation via bootstrap resampling (n = 1,000 iterations) yielded recalibrated C-index values of 0.833 (training) and 0.826 (validation) (Figures 7A,B), confirming model stability. DCA (Figure 8) further validated the nomogram’s clinical utility, demonstrating significant net benefit across threshold probabilities, outperforming blanket “treat-all” or “treat-none” strategies.
Model discrimination: ROC curves. Receiver operating characteristic (ROC) curves comparing predictive performance in training and validation cohorts.
Calibration plots for the postoperative PU model using training (A) and testing (B) sets.
Decision curve analysis (DCA) of clinical utility. Net benefit curves across threshold probabilities (0–100%), comparing “Treat All,” “Treat None,” and model-guided strategies. Cost–benefit ratios (1:100 to 100:1) contextualize decision trade-offs.
Discussion
This study presents a validated nomogram for predicting PU risk in neurosurgical patients, integrating protocol compliance metrics and machine learning. The model’s high discriminative power (AUC = 0.80) and net benefit across decision thresholds underscore its clinical relevance.
Our hybrid PSM-machine learning approach addresses critical gaps in surgical risk modeling. By balancing confounders (e.g., age, comorbidities) via PSM, we reduced selection bias by 32% (SMD reduction from 0.25 to <0.1), aligning with recent work by Shibahashi et al. (23) in severe traumatic brain injury. The inclusion of protocol compliance scores as stabilizing weights further enhanced generalizability, a strategy validated in patients with COVID-19 undergoing abdominal surgery (24). Notably, LASSO regression outperformed stepwise selection in identifying non-linear predictors (e.g., wavelet-decomposed MAP variability), corroborating findings from Zhang et al. (25) in elderly patients with obstructive sleep apnea.
While LASSO optimized predictor selection from high-dimensional data, backward regression enhanced clinical translatability by excluding variables with non-significant associations (p ≥ 0.05). This hybrid approach balanced statistical rigor with pragmatic utility, ensuring the nomogram remains deployable in resource-constrained settings (5, 8). The nomogram identifies intraoperative temperature differentials as a novel predictor, likely reflecting impaired thermoregulatory homeostasis during prolonged immobilization. Experimental studies (26–28) corroborate this mechanism, demonstrating that hypothermia-induced vasoconstriction exacerbates microvascular compromise, reducing tissue oxygenation and elevating ischemia risk. Similarly, urinary incontinence emerges as a proxy for autonomic dysfunction, which disrupts neurovascular tone regulation and perpetuates ischemic injury—a pathway validated in diabetic neuropathy models (29, 30). These predictors highlight the interplay between systemic physiological derangements and localized tissue vulnerability (3, 9). By integrating dynamic parameters like thermal variability, the model advances beyond static risk factors, enabling real-time adjustments to perioperative protocols (2, 5, 29). Future research should explore targeted interventions, such as precision warming systems or autonomic function monitoring, to mitigate these modifiable risks. This mechanistic alignment with pathophysiological pathways strengthens the nomogram’s clinical plausibility and translational potential (6, 7, 31).
The model’s AUC of 0.80 surpasses traditional tools like the Braden Scale [AUC: 0.70–0.72 in patients undergoing emergent neurosurgery; Ellenberger et al. (32)]. By quantifying protocol adherence, clinicians can prioritize interventions (e.g., dynamic repositioning) in high-risk patients, potentially reducing PU incidence by 18–25% (simulated using DCA net benefit curves). This nomogram enables clinicians to stratify high-risk patients preoperatively, guiding targeted interventions such as optimized positioning schedules or pressure-redistribution devices. By quantifying protocol adherence, it also provides actionable feedback for quality improvement initiatives (5, 8, 14).
This study has several limitations. First, its retrospective design introduces potential selection bias, particularly in excluding emergency craniotomy patients who may represent a high-risk subgroup. Furthermore, we acknowledge that the extensive exclusion criteria—such as the omission of emergency cases, patients with severe comorbidities, and those with incomplete records—may restrict the immediate generalizability of our model to broader neurosurgical populations. These criteria were deliberately chosen to reduce confounding factors and ensure internal validity during the model development phase. However, we recognize that this approach may limit the applicability of the model in real-world, heterogeneous clinical environments. To address this, future research will focus on external validation using prospective, multi-center datasets that include a wider spectrum of neurosurgical patients, such as those undergoing emergency procedures or presenting with complex perioperative conditions. By incrementally expanding the model’s scope, we aim to enhance its clinical applicability while preserving its predictive accuracy. Second, while PSM mitigated confounding, unmeasured variables (e.g., intraoperative tissue oxygenation) could influence PU risk. Third, Over the 20-year study period, changes in pressure ulcer prevention protocols, including variations in mattress types and the introduction of new wound care strategies, may have affected the incidence of pressure ulcers. However, to account for these changes, we used propensity score matching to balance baseline characteristics between groups. These temporal shifts in management practices are acknowledged as a limitation and are discussed further. Additionally, the exclusion of patients with incomplete records (>20% missing data) may limit applicability to real-world scenarios with variable documentation practices. Future prospective studies should incorporate real-time physiological monitoring and external validation cohorts.
Conclusion
This machine learning-enhanced nomogram provides a validated, clinically actionable tool for PU risk stratification in neurosurgery. By harmonizing causal inference and predictive analytics, it represents a paradigm shift in perioperative care optimization. Prospective trials should validate the nomogram’s performance in emergency neurosurgery and non-tertiary settings. Integration with electronic health records could enable real-time risk alerts. Further refinement of protocol compliance metrics, such as nurse-to-patient ratios, may enhance predictive accuracy.
The reference list from the paper itself. Each links out to its DOI / PubMed record.
- 1Huang YX Yu ZY Xu MR Zhao XT Tang YZ Luo L. Negative pressure wound therapy promotes wound healing by down-regulating mi R-155 expression in granulation tissue of diabetic foot ulcers. Sci Rep. (2025) 15:6733. doi: 10.1038/s 41598-025-90643-7, PMID: 40000694 PMC 11861317 · doi ↗ · pubmed ↗
- 2Luiz Jde E Borges A Maria T Mazzon L Gosuen F. Therapeutic potential of Brazilian green propolis and oregano (Origanum vulgare) extracts in collagen hydrogel for pressure ulcer repair: an experimental study in an animal model. Nat Prod Res. (2025) 1:1–11. doi: 10.1080/14786419.2025.246932039971746 · doi ↗ · pubmed ↗
- 3Guo HH Xue ZQ Mei SW Li TF Yu HY Ning T. Clinical efficacy of antibiotic-loaded bone cement and negative pressure wound therapy in multidrug-resistant organisms diabetic foot ulcers: a retrospective analysis. Front Cell Infect Microbiol. (2025) 14:199. doi: 10.3389/fcimb.2024.1521199, PMID: 39831106 PMC 11739815 · doi ↗ · pubmed ↗
- 4Sánchez AH Rodríguez-Rego JM Lavado-Garcia JM Mendoza-Cerezo L Macías-García A. Optimizing the design of a lateral oscillating device for pressure ulcer prevention: results of a quasi-experimental study. Clin Ther. (2025) 47:e 1. doi: 10.1016/j.clinthera.2024.12.009, PMID: 39800635 · doi ↗ · pubmed ↗
- 5Willems SA Broekman SJ Smeets MJR Brouwers Jvan Eps RGS. Prognostic value of toe pressure measurements in patients with diabetic foot ulcers and medial arterial calcification. Ann Vasc Surg. (2025) 112:306–14. doi: 10.1016/j.avsg.2024.12.05139736382 · doi ↗ · pubmed ↗
- 6Dweekat OY Lam SS Mc Grath L. A hybrid system of Braden scale and machine learning to predict hospital-acquired pressure injuries (bedsores): a retrospective observational cohort study. Diagnostics. (2023) 13:31. doi: 10.3390/diagnostics 13010031, PMID: 36611323 PMC 9818183 · doi ↗ · pubmed ↗
- 7Braden BJ Maklebust J. Preventing pressure ulcers with the Braden scale. Am J Nurs. (2024) 124:38–40. doi: 10.1097/01.NAJ.0001004932.50928.b 338126832 · doi ↗ · pubmed ↗
- 8Kiyat I Ozbas A. Comparison of the predictive validity of Norton and Braden scales in determining the risk of pressure injury in elderly patients. Clin Nurse Spec. (2024) 38:141–6. doi: 10.1097/nur.0000000000000815, PMID: 38625804 · doi ↗ · pubmed ↗