Pre-hypertension and Associated Risk Factors Among Undergraduate Medical Students in Chengalpattu District: A Cross-Sectional Study
Rehana Syed, Raja D, Manoj P, BN Surya, Hari Narayanan, Geethanjali Murthy

TL;DR
This study finds that 28% of medical students in South India have pre-hypertension, linked to stress, smoking, and poor lifestyle habits.
Contribution
The study identifies pre-hypertension prevalence and key risk factors among medical students in Chengalpattu district.
Findings
28% of students had pre-hypertension, with stress and smoking as the strongest predictors.
Age above 22, being in the final year, and family history of hypertension were significant risk factors.
Early interventions like health campaigns and stress management are recommended for medical students.
Abstract
Introduction Noncommunicable diseases (NCDs) are a major global health concern, with cardiovascular conditions being a leading contributor. Medical students are exposed to greater stress in terms of longer course duration as well as academic stress. Medical professionals adopt unhealthy lifestyles and end up developing chronic diseases at a younger age. This study screens such a vulnerable population for hypertension and aids in early diagnosis. Hypertension plays a key role in this burden, and its early stage (pre-hypertension) is recognized as a significant risk factor for developing full-blown hypertension and related complications. This study focuses on assessing the prevalence of pre-hypertension and identifying its associated factors among undergraduate medical students in South India. Aim To assess the prevalence of pre-hypertension among undergraduate medical college students…
Genes, proteins, chemicals, diseases, species, mutations and cell lines named across the full text — each resolved to its canonical identifier and authoritative record.
Click any figure to enlarge with its caption.
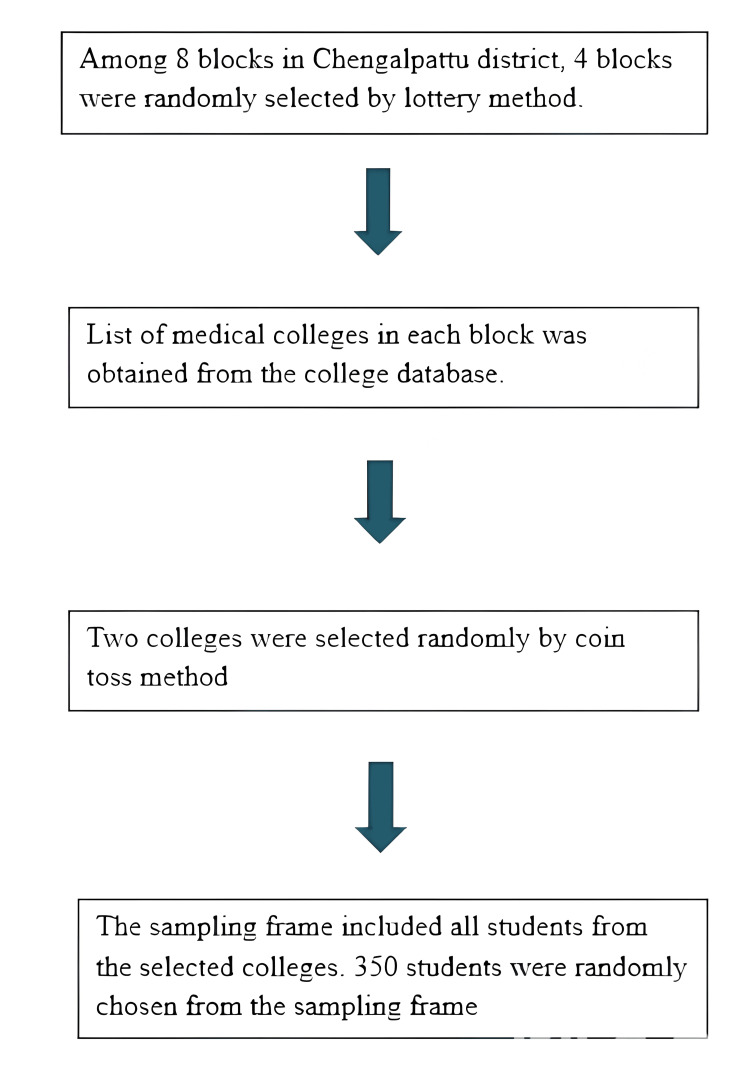 Figure 1
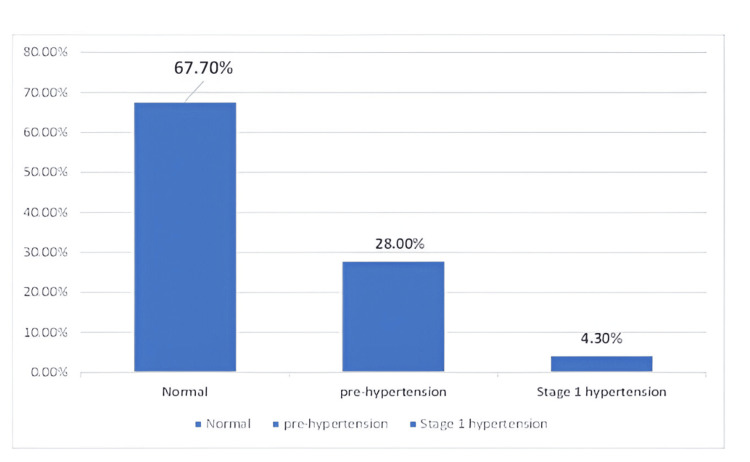 Figure 2
| S. No. | Variable | Frequency (n=350) | Percentage (%) |
| 1. | Gender | ||
| Male | 168 | 48 (%) | |
| Female | 182 | 52 (%) | |
| 2. | Age | ||
| ≤ 22 years | 224 | 64 (%) | |
| > 22 years | 126 | 36 (%) | |
| 3. | Year of study | ||
| First year | 70 | 20 (%) | |
| Second year | 97 | 27.7 (%) | |
| Third year | 79 | 22.6 (%) | |
| Final year | 104 | 29.7 (%) | |
| 4. | Type of family | ||
| Nuclear | 204 | 58.3 (%) | |
| Joint | 146 | 41.7 (%) | |
| 5. | History of alcohol consumption | ||
| Present | 63 | 18 (%) | |
| Absent | 287 | 82 (%) | |
| 6. | History of smoking | ||
| Present | 47 | 13.4 (%) | |
| Absent | 303 | 86.6 (%) | |
| 7. | Type of stay | ||
| Hosteller | 150 | 42.9 (%) | |
| Day scholar | 200 | 57.1 (%) | |
| S. No. | Variable | Pre-hypertension n (%) n = 98 (29.3%) | Normal n (%) n = 237 (70.7%) | Total (N = 335) | Chi-square | OR (95% CI) | P value |
| 1. | Age | ||||||
| > 22 years | 46 (46.9%) | 79 (33.3%) | 125 (37.3%) | 5.487 | 1.769 (1.09 – 2.86) | 0.019* | |
| ≤ 22 years | 52 (53.1%) | 158 (66.7%) | 210 (62.7%) | 1 | 1 | ||
| 2. | Gender | ||||||
| Female | 62 (63.3%) | 117 (49.4%) | 179 (53.4%) | 5.382 | 1.767 (1.08 – 2.86) | 0.020* | |
| Male | 36 (36.7%) | 120 (50.6%) | 156 (46.6%) | 1 | 1 | ||
| 3. | Year of study | ||||||
| Fourth year | 38 (38.8%) | 63 (26.6%) | 101 (30.1%) | 8.174 | 2.171 (1.08 – 4.37) | 0.030* | |
| Third year | 15 (15.3%) | 57 (24.1%) | 72 (21.5%) | 0.947 (0.42 – 2.12) | 0.895 | ||
| Second year | 30 (30.6%) | 63 (26.6%) | 93 (27.8%) | 1.741 (0.84 – 3.52) | 0.141 | ||
| First year | 15 (15.3%) | 54 (22.8%) | 69 (20.6%) | 1 | 1 | ||
| 4. | Type of family | ||||||
| Nuclear | 53 (54.1%) | 144 (60.8%) | 197 (58.8%) | 1.276 | 0.761 (0.47 – 1.22) | 0.259 | |
| Joint | 45 (45.9%) | 93 (39.2%) | 138 (41.2%) | 1 | 1 | ||
| 5. | Smoking habit | ||||||
| Yes | 26 (26.5%) | 30 (12.7%) | 56 (16.7%) | 9.584 | 2.492 (1.38 – 4.49) | 0.002* | |
| No | 72 (73.5%) | 207 (87.3%) | 279 (83.3%) | 1 | 1 | ||
| 6. | Alcohol consumption | ||||||
| Yes | 18 (18.4%) | 28 (11.8%) | 46 (13.7%) | 2.513 | 1.679 (0.88 – 3.20) | 0.113 | |
| No | 80 (81.6%) | 209 (88.2%) | 289 (86.3%) | 1 | 1 | ||
| 7. | Type of stay | ||||||
| Day scholar | 58 (59.2%) | 131 (55.3%) | 189 (56.4%) | 0.431 | 1.173 (0.73 – 1.89) | 0.512 | |
| Hosteller | 40 (40.8%) | 106 (44.7%) | 146 (43.6%) | 1 | 1 | ||
| S. No. | Variable | Pre-hypertension n (%) n = 98 (29.3%) | Normal n (%) n = 237 (70.7%) | Total (N = 335) | Chi-square | OR (95% CI) | P value | |
| 1. | Family history of hypertension | |||||||
| Yes | 61 (62.2%) | 113 (47.7%) | 174 (51.9%) | 5.892 | 1.809 (1.12 – 2.93) | 0.015* | ||
| No | 37 (37.8%) | 124 (52.3%) | 161 (48.1%) | 1 | 1 | |||
| 2. | BMI | |||||||
| Obese | 11 (11.2%) | 18 (7.6%) | 29 (8.7%) | 1.944 | 1.390 (0.61 – 3.15) | 0.431 | ||
| Overweight | 36 (36.7%) | 103 (43.5%) | 139 (41.5%) | 0.795 (0.48 – 1.31) | 0.371 | |||
| Normal | 51(52%) | 116 (48.9%) | 167 (49.9%) | 1 | 1 | |||
| 3. | Physical activity/week | |||||||
| Never | 21 (21.4%) | 29 (12.2%) | 50 (14.9%) | 16.196 | 4.345 (1.13 – 16.68) | 0.032* | ||
| Once a week | 41 (41.8%) | 67 (28.3%) | 108 (32.2%) | 3.672 (1.02 – 13.24) | 0.047* | |||
| Twice a week | 25 (25.5%) | 80 (33.8%) | 105 (31.3%) | 1.875 (0.51 – 6.89) | 0.344 | |||
| 3-4 times a week | 8 (8.2%) | 43 (18.1%) | 51 (15.2%) | 1.116 (0.26 – 4.69) | 0.881 | |||
| > 5 times a week | 3 (3.1%) | 18 (7.6%) | 21 (6.3%) | 1 | 1 | |||
| 4. | Hours of sleep/day | |||||||
| < 6 hours | 73 (74.5%) | 146 (61.6%) | 219 (65.4%) | 5.086 | 1.820 (1.08 – 3.07) | 0.024* | ||
| > 6 hours | 25 (25.5%) | 91 (38.4%) | 116 (34.6%) | 1 | 1 | |||
| 5. | Type of diet | |||||||
| Mixed | 72 (73.5%) | 183 (77.2%) | 255 (76.1%) | 0.535 | 0.817 (0.48 – 1.40) | 0.464 | ||
| Vegetarian | 26 (26.5%) | 54 (22.8%) | 80 (23.9%) | 1 | 1 | |||
| 6. | How often you consume junk foods/week | |||||||
| > 5 times | 17 (17.3%) | 24 (10.1%) | 41 (12.2%) | 3.560 | 1.574 (0.58 – 4.29) | 0.375 | ||
| 3-4 times | 41 (41.8%) | 111 (46.8%) | 152 (45.4%) | 0.82 (0.35 – 1.95) | 0.654 | |||
| 1-2 times | 31 (31.6%) | 82 (34.6%) | 113 (33.7%) | 0.840 (0.35 – 2.04) | 0.701 | |||
| Never | 9 (9.2%) | 20 (8.4%) | 29 (8.7%) | 1 | 1 | |||
| 7. | Stress (PSS – 10 scale) | |||||||
| Yes | 65 (66.3%) | 117 (49.4%) | 182 (54.3%) | 8.037 | 2.020 (1.23 – 3.29) | 0.005* | ||
| No | 33 (33.7%) | 120 (50.6%) | 153 (46.7%) | 1 | 1 | |||
| S. No. | Variable | P value | AOR | 95% CI |
| 1. | Age above 22 years | 0.034* | 1.833 | 1.03 – 2.6 |
| 2. | Female gender | 0.069 | 1.241 | 0.89 – 2.3 |
| 3. | Fourth year MBBS | 0.012* | 2.107 | 1.21 – 4.5 |
| 4. | Smoking habit | 0.006* | 2.755 | 1.38 – 5.6 |
| 5. | Family history of hypertension | <0.001* | 2.186 | 1.3 – 3.5 |
| 6. | No physical activity /week | 0.022* | 2.738 | 1.05 – 6.8 |
| 7. | < 6 hours of sleep / day | 0.008* | 1.983 | 1.1 – 3.2 |
| 8. | Stress | <0.001* | 3.822 | 2.37 – 6.1 |
Peer Reviews
No public reviews on file for this paper yet. If you reviewed it on a platform where reviews are public (OpenReview, ICLR, NeurIPS, ICML), you can paste yours below so the community can read it here.
Videos
No videos yet. Explain this paper in a talk, walkthrough, or lecture? Add one.
Taxonomy
TopicsBlood Pressure and Hypertension Studies · Heart Rate Variability and Autonomic Control · Cardiac Health and Mental Health
Introduction
Globally, non-communicable diseases (NCDs) are the main contributors to morbidity and mortality. According to a World Health Organization (WHO) fact sheet, NCDs cause 40 million deaths a year, or 70% of all fatalities worldwide [1], with over 80% of those deaths taking place in low- and middle-income nations.
The leading cause of mortality worldwide among the NCDs is cardiovascular disease (CVD) [2]. The World Health Organization defines hypertension (HTN) as a cardiovascular illness in which the blood vessels are under greater stress due to consistently elevated pressure [3]. AT least 9.4 million deaths worldwide are attributed to complications from hypertension each year [4].
In India, the burden is substantial: a multicity survey across five major regions reported prehypertension rates of approximately 31-35% in South and West India, with Mumbai and Trivandrum showing similar elevations compared to northern regions [5]. South India, particularly urban areas, demonstrates both high prevalence and low awareness: a STEPS (STEPwise approach to NCD risk factor surveillance) community survey in Puducherry reported a 36.6% prehypertension rate, significantly associated with BMI > 23 kg/m² and daily salt intake over 6 g [6]. Cross-sectional data from coastal Karnataka showed nearly 55% of adults in the prehypertensive or hypertensive range, related to sedentary habits, obesity, alcohol, and tobacco use [7]. Among undergraduate medical students (a young but high‑stress group) the prevalence is often higher than in peers, with studies reporting 38% (Puducherry) to 37.5% (Davangere), linked to BMI, dyslipidemia, and stress [8,9].
The American term "pre-hypertension" refers to a condition in which a person's blood pressure is higher than normal (systolic blood pressure of 120-139 mmHg or diastolic blood pressure of 80-89 mmHg) but not high enough to be classified as hypertension as per JNC criteria 7 (Seventh Joint National Committee) [10]. According to several research carried out in India, the prevalence of pre-HTN in people aged 20 to 30 ranges from 24.6% to 65% [11-13]. There is a moderate to high chance that pre-hypertensives will develop into hypertension, and a significant percentage of them have at least one cardiovascular risk factor [11-13].
Early identification of pre-hypertension plays an important role in screening for metabolic syndrome and prevention of cardiovascular accident [14-16]. Independent of other cardiovascular risk factors, pre-hypertension increases the chance of major cardiovascular events and the likelihood of developing hypertension later in life. The purpose of this study is to determine the prevalence of prehypertension and related variables among South Indian undergraduate medical students.
Materials and methods
Study design, setting, and duration
This cross-sectional study was conducted from February 2024 to May 2024 among 350 undergraduate students from two colleges in the Chengalpattu district, Tamil Nadu, India.
Sample size calculation
A sample size of 350 was determined based on a previous study by Shetty and Nayak, which reported a 55.4% prevalence of pre-hypertension [17]. The sample size calculation considered a relative precision of 10%, with an additional 10% included for non-responsiveness.
Sampling procedure
Among eight blocks in Chengalpattu district, four blocks were randomly selected by lottery method using simple random sampling. A list of medical colleges in each block was obtained from the college database. Two colleges were selected randomly by the coin toss method. In the Indian medical education system, the undergraduate program typically follows a structured curriculum regulated by national councils. The Bachelor of Medicine and Bachelor of Surgery (MBBS) program spans 5.5 years, including 4.5 years of academic courses followed by a one-year compulsory rotating internship. The sampling frame included all students from the selected colleges. Three hundred and fifty students were randomly chosen from the sampling frame using a simple random sampling method.
Flowchart of sampling procedure
Inclusion and exclusion criteria* *
First-year to final-year MBBS students above 18 years of age were included, while those with a known history of hypertension under medication were excluded from the study.
Data collection
Permission to conduct the study was formally obtained from the heads of the selected institutions. The objectives of the study were explained to the administrative authorities and students, and informed consent was obtained from all participants before data collection. Data was collected using a pre-tested semi-structured questionnaire (see Appendices) covering (A) socio-demographic details, (B) anthropometric details, (C) determinants of pre-hypertension (physical activity, hours of sleep, BMI was measured using the Quetelet Index, and (D) 10-item Perceived Stress Scale (PSS-10) [18]. BP was measured using a standard digital sphygmomanometer which was calibrated using stride BP every 15 days once (Omron HBP 1320, Omron Healthcare India Pvt. Ltd, Gurgaon, India), with participants seated and at rest. Each participant’s blood pressure was recorded twice, and the average was taken for analysis. The JNC 7 (Seventh Joint National Committee) guidelines were used to classify blood pressure levels [10].
A pilot study was conducted among 30 participants using a semi-structured questionnaire among college students from a different university. Based on the responses and feedback received the questionnaire was modified. The internal validity of the questionnaire was analyzed using reliability analysis. The Cronbach’s alpha of the questionnaire developed was 0.82, which indicated good consistency in internal validity.
To assess levels of perceived stress among the study participants, PSS developed by Cohen et al. [18]** **was used. The PSS 10-item scale includes questions about participants’ stressful feelings and thoughts over the past month, and yields scores that reflect one's perceived stress. Reverse scoring is applied to questions 4, 5, 7, and 8, adjusting the scale to range from 0 to 4. The total score, ranging from 0 to 40, is then computed by summing individual item scores. Higher PSS scores correlate with heightened perceived stress, where a score of 0-13 is considered low stress, 14-26 indicates moderate stress, and 27-40 suggests high perceived stress. The 10‑item PSS version was chosen due to its notable good psychometric properties and the evidence of its validity [19].
Ethical consideration and statistical analysis
Ethical approval from the institutional human ethical committee was obtained (Ref no: IHEC-I/2491/24) before commencing data collection. Informed written consent was secured from all participants. collected data was analyzed using IBM SPSS Statistics for Windows, Version 27 (IBM Inc., Armonk, NY, USA). Bivariate logistic regression was performed to obtain an unadjusted odds ratio. Variables with a p-value <0.05 were included in the multivariate model to calculate the adjusted odds ratio.
Results
Table 1 shows the distribution details of the study participants, out of 350 participants, 48% were male individuals and 52% were female individuals. Most (64%) were aged 22 years or younger. Regarding their year of study, 29.7% were in the fourth year, followed by 27.7% in the second year, 22.6% in the third year, and 20% in the first year. A majority (58.3%) belonged to nuclear families, while 41.7% were from joint families. A history of alcohol consumption was reported by 18% of participants and smoking by 13.4%. In terms of residence, 42.9% were hostellers and 57.1% were day scholars.
Figure 2 shows the prevalence of pre-hypertension. It was found that 98 (28%) of 350 study participants had pre-hypertension, while 67.7% (237) and 4.3% (15) had stage 1 hypertension. The 15 participants identified with stage 1 hypertension were excluded from further analysis, and appropriate treatment and counseling were initiated for them.
Grades of hypertension
Table 2 shows the association between pre-hypertension and various demographic variables among the study participants. Individuals aged above 22 years had higher odds of pre-hypertension compared to those aged 22 years or below (odds ratio = 1.769, 95% CI: 1.09-2.86, p = 0.019). Female participants demonstrated a significantly higher likelihood of pre-hypertension compared to male participants (odds ratio = 1.767, 95% CI: 1.08-2.86, p = 0.020). Fourth-year students were more likely to have pre-hypertension compared to first-year students (odds ratio = 2.171, 95% CI: 1.08-4.37, p = 0.030). Smoking habits were significantly associated with pre-hypertension, with smokers having higher odds compared to non-smokers (odds ratio = 2.492, 95% CI: 1.38-4.49, p = 0.002).
Table 2: Association between pre-hypertension and socio-demographic details P value < 0.05, statistically significant at 95% confidence interval.OR: odds ratio, χ2: Chi-square*
Table 3 highlights significant associations between pre-hypertension and various factors among the study participants. A family history of hypertension was significantly associated with higher odds of pre-hypertension (OR = 1.809, 95% CI: 1.12-2.93, p = 0.015). Participants engaging in physical activity less frequently, such as never or once a week, were at greater risk compared to those exercising more than five times a week (OR = 4.345, p = 0.032; OR = 3.672, p = 0.047, respectively). Sleeping less than six hours per day had a positive association with pre-hypertension (OR = 1.820, 95% CI: 1.08-3.07, p = 0.024). Additionally, stress (measured by the PSS-10 scale) was strongly linked to pre-hypertension, with participants experiencing stress having more than three times higher odds (OR = 2.020, 95% CI: 1.23 - 3.21, p 0.005).
Table 3: Association between pre-hypertension and lifestyle factors P value < 0.05, statistically significant at 95% confidence interval.OR: odds ratio, χ2: Chi-square*
Table 4 presents the adjusted analysis of factors associated with pre-hypertension among study participants. Participants older than 22 years had significantly higher odds of pre-hypertension (AOR 1.83; 95 % CI 1.03-2.60; p = 0.034). Final‑year MBBS students were also at increased risk (AOR 2.11; 95 % CI 1.21-4.50; p = 0.012). Smoking remained a strong predictor, with smokers nearly 2.76 times more likely to be pre-hypertensive than non-smokers (95 % CI 1.38-5.60; p = 0.006). A family history of hypertension doubled the odds (AOR 2.19; 95 % CI 1.30-3.50; p < 0.001), and a sedentary lifestyle as no weekly physical activity was associated with a 2.74-fold higher risk (95 % CI 1.05-6.80; p = 0.022). Sleeping less than six hours per day nearly doubled pre-hypertension odds (AOR 1.98; 95 % CI 1.10-3.20; p = 0.008). Notably, stress emerged as the strongest predictor, with those reporting stress having almost four times the odds of pre-hypertension (AOR 3.82; 95 % CI 2.37-6.10; p < 0.001.
Discussion
Our study found that 28% of the 350 participants had pre-hypertension. This prevalence is notably higher than that reported in similar studies conducted among medical students across India. For example, research conducted in Andhra Pradesh observed a pre-hypertension prevalence of 15.9%, with rates of 29.3% in men and 5.2% in women [20] while few other studies reported higher prevalence rates.A study from Mumbai identified pre-hypertension in 32.4% of medical students [21], while another research from Andhra Pradesh reported a prevalence of 37.45% [22]. Additionally, a separate study in Puducherry noted that 42.4% of medical students had elevated blood pressure [23]. The significant difference of higher prevalence in our study compared to these regions may indicate regional differences, potentially influenced by variations in lifestyle, stress levels, or genetic factors among medical students in Chengalpattu district.
As observed in this study, pre-hypertension was more prevalent among participants over the age of 22 years (46.9%) compared to their younger counterparts (53.1%), with a statistically significant association (p = 0.019). To support this observation our multiple logistic regression analysis revealed that students above the age of 22 were nearly twice as likely to develop pre-hypertension (AOR: 1.833; 95% CI: 1.03-2.6; p = 0.034). Similar trends have been documented in studies from Bahrain [24], Egypt [25], and Mumbai [21], all of which highlight age as a crucial risk factor for pre-hypertension and hypertension among university students.
In our current study, female students exhibited a higher prevalence of pre-hypertension (63.3%) compared to male students (36.7%), with an odds ratio (OR) of 1.76 (95% CI: 1.08-2.86, p = 0.020). This contrasts with studies from Puducherry [23] and Bahrain [24], where male students demonstrated a higher prevalence of pre-hypertension (29.3% and 44.9%, respectively) compared to their female counterparts (5.2% and 17.7%, respectively). Similarly, a study in Mumbai identified male gender as a significant risk factor for hypertension among medical students [21]. In our study, the proportion of obesity and overweight was higher among female individuals than male individuals. This could have contributed to a higher proportion of pre-hypertensives among female individuals. The discrepancy between our findings and those from other studies suggests that cultural, environmental, or behavioral factors may influence blood pressure differently across populations.
In the present study, final-year medical students exhibited a notably higher prevalence of pre-hypertension (38.8%) compared to first-year students (15.3%), with a statistically significant association (OR = 2.17; 95% CI: 1.08-4.37; p = 0.030). Adding to this, multiple logistic regression analysis revealed that final-year students were more than twice as likely to develop pre-hypertension (AOR: 2.107; 95% CI: 1.21-4.5; p = 0.012), highlighting how the growing academic and clinical demands faced during the final years of medical education may contribute to increased cardiovascular risk. This finding aligns with a study from Andhra Pradesh, which reported an increasing prevalence of pre-hypertension with advancing academic years among medical students [22]. Similarly, research conducted in Bahrain [24] found higher rates of pre-hypertension among senior students compared to their junior counterparts, and a study in Mumbai [21]** **also observed a rise in hypertension prevalence as students progressed through academic years.
Students from nuclear families had a lower prevalence of pre-hypertension (54.1%) compared to those from joint families (45.9%), with an OR of 0.761 (95% CI: 0.47-1.22, p = 0.259). Limited studies have directly examined the association between family structure and pre-hypertension. However, family environment and associated stressors can influence blood pressure. A study in Egypt highlighted family history as a significant risk factor for hypertension among university students [25]. However, family dynamics and support systems may play a role in shaping stress levels and lifestyle habits, which in turn can influence blood pressure. Further investigation is required to explore this relationship in greater detail.
Smokers exhibited a significantly higher prevalence of prehypertension (26.5%) compared to non-smokers (73.5%), with an odds ratio of 2.492 (95% CI: 1.38-4.49, p = 0.002); participants with smoking habits were nearly three times more likely to develop pre-hypertension (AOR: 2.755; 95% CI: 1.38-5.6; p = 0.006), underscoring the harmful impact of tobacco use on cardiovascular health. Supporting this, a study in Puducherry by Kar et al. using the STEPS survey found that tobacco users had more than double the prevalence of prehypertension compared to non-users [6]. Research by Parthaje et al. in urban South India similarly reported that individuals who used tobacco (90.1%) had higher rates of prehypertension than non-users [26]. This collectively reinforces evidence from various Indian studies that underscore a strong association between smoking and elevated blood pressure, thereby highlighting the critical need for tobacco cessation programs as a key strategy to reduce the burden of hypertension in India.
No significant association was found between alcohol consumption and pre-hypertension, with an OR of 1.679 (95% CI: 0.88-3.20), p = 0.113, whereas a study done by Parthaje et al. identified alcohol as a significant risk factor for pre-hypertension and hypertension [26].
Participants with a family history of hypertension had a higher prevalence of pre-hypertension (62.2%) compared to those without (37.8%), with an OR of 1.809 (95% CI: 1.12-2.93), p = 0.015. Similarly, a study in Bahrain found a significant association between a family history of hypertension and elevated blood pressure among university students [24].
Obese participants had a higher prevalence of pre-hypertension (11.2%) compared to those with normal BMI (52%), with an OR of 1.39 (95% CI: 0.61-3.15), p = 0.073. A study in India reported a prevalence of overweight and obesity at 43%, with higher anthropometric indices associated with pre-hypertension. A study found that medical students had a 12.8% increased chance of having pre-hypertension with each unit increase in BMI [27]. A study demonstrated a strong positive correlation between BMI and blood pressure among medical students, suggesting weight control as a preventive measure against hypertension [28].
Although obese participants in our study showed a higher prevalence of pre-hypertension (11.2%) compared to those with a normal BMI (52%), with an OR of 1.39 (95% CI: 0.61-3.15; p = 0.073), the association was not statistically significant. In contrast, previous studies conducted in India by Bhavani et al. in Andhra Pradesh reported a combined prevalence of overweight and obesity at 43%, highlighting a significant link between elevated anthropometric indices and pre-hypertension [20]. One study done in Agartala [27] noted that medical students had a 12.8% increased likelihood of developing pre-hypertension with each unit increase in BMI, while another research from China demonstrated a strong positive correlation between BMI and blood pressure [28], emphasizing the importance of weight management as a preventive strategy. These findings underscore the need for continued efforts in promoting healthy lifestyles among young adults, even though our study did not observe a significant association.
Our study found that participants who exercised only once a week were significantly more likely to have pre-hypertension (OR: 3.67; p = 0.047) compared to those who were active more than five times a week. Even more strikingly, those who reported no physical activity at all during the week had nearly three times the odds of developing pre-hypertension (AOR: 2.738; 95% CI: 1.05-6.8; p = 0.022). These findings highlight just how important regular movement is for maintaining healthy blood pressure; even small, consistent efforts can make a meaningful difference. This aligns with evidence from a systematic review and meta-analysis, which showed that both aerobic and resistance training can help lower blood pressure in people with pre-hypertension [29]. Another study further emphasized the positive impact of combining physical activity with good sleep habits to support better blood pressure control [30]. Together, these insights remind us that staying active isn’t just about fitness-it’s a powerful step toward protecting long-term heart health.
In our study, students who slept less than six hours per day were found to have significantly higher odds of developing pre-hypertension (OR: 1.820; p = 0.024; AOR: 1.983; 95% CI: 1.1-3.2; p = 0.008), reflecting a growing body of evidence linking short sleep duration with increased blood pressure. Previous research has shown that sleeping fewer than seven hours per night is associated with a heightened risk of both pre-hypertension and hypertension, particularly among females [31]. Alongside sleep, stress also emerged as a major factor in our findings [32].
Students experiencing stress had over three times the odds of pre-hypertension (AOR: 3.822; 95% CI: 2.37-6.1; p < 0.001). A study done by Kar et al. shows similar results [6]. These results emphasize the urgent need to prioritize sleep hygiene, stress management, and mental health support within academic environments to help students maintain both their physical and emotional well-being.
Limitations of this study include the inability to generalize the findings to the entire young adult population of the Chengalpattu district, as the sample was limited to medical college students. Social desirability bias is common in this study. Dietary habits play a vital role in hypertension, which was not studied here. Furthermore, since most participants were having their blood pressure measured for the first time and readings were taken on a single day, there is a possibility of over-diagnosis, potentially influenced by white coat hypertension.
Conclusions
Our study reveals a notably high prevalence of pre-hypertension among undergraduate medical students in the Chengalpattu district, emphasizing the early onset of cardiovascular risk factors in this young population. Key socio-demographic and behavioral variables were found to be significantly associated with elevated blood pressure levels. Students aged above 22 years exhibited a significantly higher risk of pre-hypertension, revealing the possible role of age-related stress, academic pressure, and lifestyle changes. Female students were more likely to be pre-hypertensive compared to their male counterparts, suggesting the need to explore gender-specific stressors and health behavior in this group. Final-year students had markedly increased odds of pre-hypertension compared to first-years, potentially due to cumulative academic stress and clinical responsibilities. Smoking emerged as a strong modifiable risk factor, with smokers having significantly higher odds of developing pre-hypertension than non-smokers. These findings underscore the importance of early identification and intervention, including regular blood pressure monitoring, lifestyle counseling, and targeted health education programs, especially for high-risk groups within the student community. Proactive measures can help mitigate long-term cardiovascular risks and foster a healthier future medical workforce.
The reference list from the paper itself. Each links out to its DOI / PubMed record.
- 1Noncommunicable diseases 2 2025 2024 https://www.who.int/news-room/fact-sheets/detail/noncommunicable-diseases
- 2Cardiovascular diseases (CV Ds) 2 2025 2021 https://www.who.int/news-room/fact-sheets/detail/cardiovascular-diseases-(cvds)
- 3Hypertension 2 2025 2023 https://www.who.int/news-room/fact-sheets/detail/hypertension
- 4World Health Day 2013: measure your blood pressure, reduce your risk 2 2025 2013 https://www.who.int/news/item/03-04-2013-world-health-day-2013-measure-your-blood-pressure-reduce-your-risk
- 5Prevalence and risk factors for prehypertension and hypertension in five Indian cities Acta Cardiol Singh RB Fedacko J Pella D 2937662011 https://www.researchgate.net/publication/264391042_Prevalence_of_and_risk_factors_for_hypertension_in_Urban_and_Rural_India_The_ICMR-INDIAB_study 2146575010.1080/ac.66.1.2064964 · doi ↗ · pubmed ↗
- 6High prevalence of prehypertension and its association with modifiable risk factors: findings of household STEPS survey from Urban Puducherry, South India Int J Prev Med Kar SS Selvaraj K Ramaswamy G Premarajan KC Saya GK Kalidoss V 162112020 https://pubmed.ncbi.nlm.nih.gov/33312471/3331247110.4103/ijpvm.IJPVM_6_19PMC 7716600 · doi ↗ · pubmed ↗
- 7Pre-hypertension among young adults (20-30 years) in coastal villages of Udupi district in southern India: an alarming scenario P Lo S One Kini S Kamath VG Kulkarni MM Kamath A Shivalli S 15453811201610.1371/journal.pone.0154538 PMC 485136927128029 · doi ↗ · pubmed ↗
- 8Prevalence of prehypertension and its association with obesity and lipid parameters in medical students Biomed Res Mishra S Saravanan DK Pillai MM Rajendran S 5257322021 https://www.biomedres.info/biomedical-research/prevalence-of-prehypertension-and-its-association-with-obesity-and-lipid-parameters-in-medical-students-16148.html