A nationwide dataset of stable isotopes in meteoric and terrestrial water across Peru
Carol Romero, James Apaéstegui

TL;DR
This paper introduces a comprehensive dataset of stable isotopes in water sources across Peru, aiding climate and hydrological research.
Contribution
The paper presents a new national-level dataset of water stable isotopes in Peru, combining curated and published data.
Findings
The dataset includes 489 water collection sites with standardized metadata.
It covers a wide range of altitudes and sample types, from sea level to 5000 m a.s.l.
The dataset is publicly available on Zenodo for scientific use.
Abstract
Water Stable Isotopes (δ18O, δ2H) are valuable tools for tracing sources and interactions in the water cycle, providing important information dedicated to understanding physical mechanisms related to global climate. Despite their significance, the topic of isotopic research in South America has been hindered by limited data. To address this gap, we launched a national-level water stable isotope dataset covering different water sources in Peru (WSI-PeruDB). The dataset contains curated in-house data and incorporates previously published records from various locations collected between 2000 and 2021. The WSIPeruDB dataset is composed of 489 water collection sites and allows a comprehensive use of the dataset by implementing standardized metadata templates containing essential geographical information such as latitude, longitude, and altitude (from sea level to 5000 m a.s.l), and sampling…
Genes, proteins, chemicals, diseases, species, mutations and cell lines named across the full text — each resolved to its canonical identifier and authoritative record.
Click any figure to enlarge with its caption.
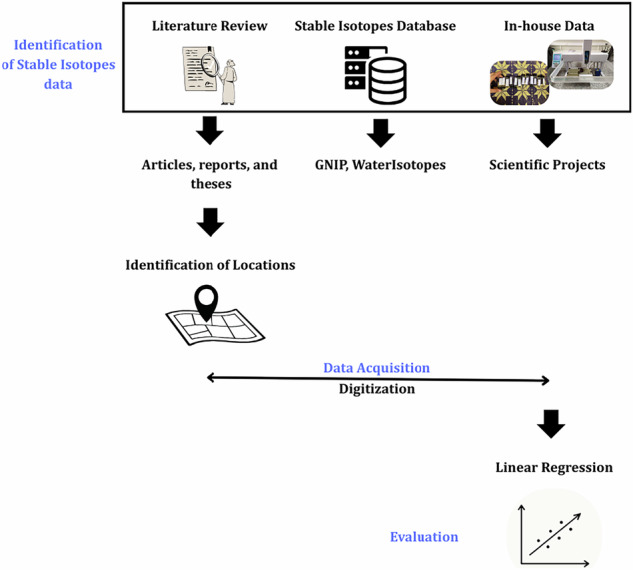 Figure 1
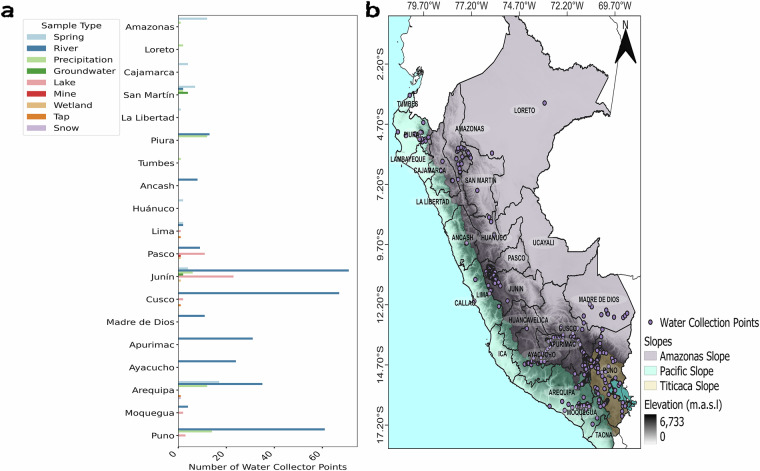 Figure 2
- —CHARISMA Project (JE0ECCHARI, JEAI-IRD) PROCIENCIA - No. 124-2020 FONDECYT
Peer Reviews
No public reviews on file for this paper yet. If you reviewed it on a platform where reviews are public (OpenReview, ICLR, NeurIPS, ICML), you can paste yours below so the community can read it here.
Videos
No videos yet. Explain this paper in a talk, walkthrough, or lecture? Add one.
Taxonomy
TopicsGroundwater and Isotope Geochemistry · Isotope Analysis in Ecology · Atmospheric and Environmental Gas Dynamics
Background & Summary
Understanding water cycle dynamics is critical in the context of ongoing climate variability and increasing human pressures on water resources^1,2^. Stable isotopes of water (δ¹⁸O, δ²H) provide a valuable means for tracing the movement and sources of water within the hydrological cycle across a range of spatial and temporal scales. Isotopic fractionation in water elements during evaporation, condensation, and precipitation processes allows for insights related to atmospheric circulation, moisture sources^3,4^, and hydrological processes^5,6^.
In Peru, climate variability, glacier retreat, urbanization, and agricultural expansion^7^ have altered water availability and distribution, particularly in regions such as the Cordillera Blanca^8,9^ the coastal regions^10^ and Andean zones^11^. Events like El Niño–Southern Oscillation (ENSO) episodes have further influenced regional hydrological patterns^12–14^. Understanding these impacts requires detailed, spatially explicit data on water sources and flow paths. Stable isotope data, by serving as ideal geochemical tracers, support the investigation of processes not covered by conventional methods, such as precipitation sources, groundwater recharge, streamflow origin, and catchment storage. Several previous studies have contributed to the understanding of isotopic patterns in Peru and into the broader context of the Andean region^15–26^. These works underscore the relevance of stable isotope applications for understanding climate variability, water sources, and the impacts of extreme events. The dataset presented here builds on this foundation by expanding geographic coverage and including a wider array of water types and measurement periods.
Building on these applications, stable isotopes have been employed in the evaluation and refinement of general circulation models (GCMs)^27^, offering a means to compare modelled and observed isotope distributions. More recently, studies have applied stable isotopes to examine key hydrological processes associated with extreme weather events^28–30^.
Despite the global availability of water isotope data through platforms like the Global Network of Isotopes in Precipitation^31^ (GNIP) and the Waterisotopes Database^32^ (wiDB), isotopic data coverage in Peru remains sparse and inconsistently updated. This represents a significant gap for researchers and decision-makers aiming to evaluate climate-water interactions, validate hydrological and climate models, or support environmental planning.
Here, we present a comprehensive, curated dataset of water stable isotope measurements (δ¹⁸O, δ²H) from meteoric and terrestrial waters across Peru (WSIPeruDB)^33^, compiled from published studies, technical reports, theses, and global databases. This dataset aggregates observations from diverse sources, some of which are originally presented and have not been previously integrated into international repositories. By consolidating and standardizing these data, we aim to improve accessibility and enable broader reuse in hydrological, climatological, and ecological studies.
Methods
The development of the water stable isotopes dataset followed three steps: (i) collection of the isotopic information from published data, including scientific articles, reports and theses, project partners, and public databases; (ii) the identification of isotopic station’s locations across Peru; (iii) evaluation of the stable isotopes from in-house data; (iv) creation of standardized metadata templates. The workflow is shown in Fig. 1.Fig. 1. Workflow of the water stable isotopes dataset in Peru (WSIPeruDB) development.
Isotopic Dataset Compilation from scientific articles, reports, theses, project partners, and public databases
We compiled the WSIPeruDB dataset through extensive retrieval and transcription of information from a variety of sources such as scientific articles, technical reports, theses, and global databases. All content was standardized using a structured metadata template (described in Table 1) to ensure consistency and usability across the entire dataset. These sources include both in-house data and external datasets, each clearly referenced in the WSIPeruDB_site_information.xlsx hosted at the WSIPeruDB Zenodo repository^33^ in accordance with their respective data-sharing policies.Table 1. Template with the categories for site information.DescriptionIDStation coding with water type classification based on projects. We handle the codingStationName of the stationLatitudeLatitude in decimal degreesLongitudeLongitude in decimal degreesAltitudeElevation above sea level in metersDepartmentRegion of the study areaStart DateStart Date Time for collection of the time-integrated sample, in local time, time in 24 hr formatEnd DateEnd Date Time for collection of the time-integrated sample, in local time, time in 24 hr formatSampling frequencyThe temporal resolution of the sample: daily, biweekly, monthly, annualSample Typeprecipitation, river, spring, lake, ice, tap, mine, wetland, groundwater, soil, snow, cave drip waterNumber of δ^18^O dataNumber of δ^18^O dataNumber of δ^2^H dataNumber of δ^2^H dataδ^18^O analytical precisionanalytical standard deviationδ^2^H analytical precisionanalytical standard deviationContactContact nameContact emailContact emailReferencesArticle or page citation where the database is locatedProject_IDIt refers to the ID used if it is stored in another repository****DatabaseName or link of the database related to the project ID
Among the 489 water collection points, 17 are associated with the GNIP^31^, accessible via the International Atomic Energy Agency (IAEA) WISER platform (https://nucleus.iaea.org/wiser). While the metadata for these points is included in our dataset, users must register on the GNIP platform to access the full data, in accordance with IAEA’s terms of use. An additional 34 collection points originate from datasets hosted in the Purdue University research repository. Twelve of these are linked to the study by Welp et al.^34^. (https://purr.purdue.edu/publications/4121/1), and 22 to the work of Alvarez-Campos et al.^35^. (https://purr.purdue.edu/publications/3919/citations/1). Both datasets are openly available for academic use and do not require registration. Furthermore, we incorporated metadata from 347 isotopic collection points listed in the WaterIsotopes database^32^ managed by the University of Utah (https://wateriso.utah.edu/waterisotopes/index.html), which is also publicly accessible.
In all cases, we followed the respective data contributor policies. For all databases mentioned above, only metadata and site identifiers were included in the WSI-Peru dataset to ensure compliance with reuse restrictions. Users are directed to the original repositories for full data access when required. Each data point included in the WSIPeruDB dataset is accompanied by a clear source reference by adding the project ID and database location, as shown in Table 1, enabling full traceability.
Identifying isotopic station locations
To collect geographic information from the scientific article by Lambs et al.^26^, we used the open-source Geographic Information System (GIS) tool QGIS (Quantum GIS)^36^ to georeference the map included in the manuscript. We extracted the figure from the article and used the Layer → Georeferencer function in QGIS to georeference the image. This process generated a TIFF file, which was overlaid onto a base map of Peru. As a result, we were able to accurately determine the geographic coordinates of each isotopic station presented in the study as shown in Fig. 2b.Fig. 2(a) Water collection points in Peru according to the sample type across the WSIPeruDB dataset. (b) Geospatial distribution of water collection points (purple circles) in Peru. Shaded areas represent the slopes: the Amazon Slope (grey color), the Pacific Slope (cyan color), and the Titicaca Slope (brown color). The topography was derived from SRTM (Shuttle Radar Topography Mission) data with a resolution of 90 meters.
Evaluation of the stable isotopes from in-house data
In-house data refer to stable isotope measurements collected by our research institution^15,16,20^ and project collaborators^17–19^. All datasets were collected following IAEA standard protocols for water sampling for isotopic analysis. Samples were stored in high-density polyethylene (HDPE) bottles to prevent evaporation. Isotopic compositions were analyzed using laser absorption spectrometers: a Picarro L2120i at the University of Brasília and a Picarro L2130i at the University of São Paulo. Post-processing was performed using the Laboratory Information Management System (LIMS) for laser-based and light-stable isotope data.
Calibration was carried out using international standards (VSMOW), and all isotopic values are reported relative to VSMOW. Analytical precision for each dataset is detailed in the supplementary file WSIPeruDB_site_information.xlsx, available via the Zenodo repository.
To ensure data quality, we implemented a validation procedure based on the Local Meteoric Water Line (LMWL), which characterizes the linear relationship between δ¹⁸O and δ²H in precipitation for a given location or region. Data points falling outside the 3σ range of the LMWL regression were considered outliers and excluded. This quality control procedure follows the IAEA’s recommended guidelines for isotope data processing^37^. Additionally, the resulting LMWLs were compared to the Global Meteoric Water Line (GMWL), as described by Craig^38^ (δ²H = 8 × δ¹⁸O + 10). Only data that passed this validation step were included in the WSIPeruDB dataset.
Data Records
The dataset is publicly available through the WSIPeruDB Zenodo repository^33^ and includes stable isotope data and associated metadata from 489 water collection points across 19 regions of Peru, covering the period from 2000 to 2021. The dataset is organized into four main files; all provided in open formats to support accessibility and reuse.
- WSIPeruDB_site_information.xlsx. This file contains metadata for each collection site, including station name, geographic coordinates, elevation, region, sample type, sampling period and frequency, and source project identifiers.
- WSIPeruDB_dataset_information.xlsx. This file includes in-house stable isotope measurements (δ¹⁸O, δ²H, and d-excess), along with the corresponding sampling date, location data and meteorological data.
- WSIPeruDB_template.xlsx. A standardized Excel template designed for future data contributions. It contains four worksheets: two for metadata descriptors (site and dataset information), and two editable sheets for users to input new collection data. Categories and field descriptions are summarized in Tables 1 and 2.Table 2. Template with the categories for isotopic data information.DescriptionIDStation coding with water type classification based on projects. We handle the codingSample Collection DateDatetime of sample collection in local timeδ^18^Oδ^18^O dataδ^2^Hδ^2^H dataDxsDxs dataSample Typeprecipitation, river, spring, lake, ice, tap, mine, wetland, groundwater, soil, snow, cave drip waterDepartmentRegion of the study areaLatitudeLatitude in decimal degreesLongitudeLongitude in decimal degreesAltitudeElevation above sea level in metersMeteorological dataPrecipitation, snowfall
- site_information_numeral.geojson. A geospatial file compatible with GIS platforms, showing the spatial distribution of collection points along with relevant site metadata.
The WSIPeruDB dataset covers a wide diversity of environmental sample types. To facilitate their identification, we have assigned specific labels to the sample type: 01 for rainwater, 02 for river water, 03 for spring, 04 for lake, 05 for ice, 06 for tap, 07 for mine, 08 for wetland, 09 for groundwater, 10 for soil, 11 for snow, and 12 for cave drip water. The distribution of these sample types of our dataset can be shown in Fig. 2a. These codes are integrated into the ID using a numbering system based on project identifiers of the water collector points. This choice ensures the uniqueness of the project numbers, reducing the possibilities of changes or confusion, and provides greater scalability, especially with the expectation of new water collector point contributions in the future.
Each external dataset included in WSIPeruDB is referenced according to its original citation and detailed in the accompanying metadata file. Users interested in full datasets from external sources are directed to the original repositories, in compliance with each source’s data-sharing policy.
It is important to highlight that researchers who are interested in contributing to new water collector points are welcome to upload their data to our WSIPeruDB dataset. We encourage researchers to archive their data as it can be driven by various factors such as scientific journal requirements, grant funding obligations, or even a genuine commitment to supporting the open data initiative.
Technical Validation
To ensure the reliability of the dataset, all in-house stable isotope measurements were subjected to a quality control procedure based on the LMWL. A linear regression was performed, and data points falling outside three standard deviations (3σ) from the regression line were identified as outliers and excluded. This method follows the quality assessment guidelines provided by the IAEA.
For external sources such as GNIP and the WaterIsotopes database, only site information as shown in Table 1 were incorporated into the WSIPeruDB dataset. No actual isotope measurement data from these sources were included. This approach is intended to facilitate users access to those databases while ensuring compliance with their respective data-sharing policies.
The reference list from the paper itself. Each links out to its DOI / PubMed record.
- 1Oki, T., Entekhabi, D. & Harrold, T. I. The global water cycle. in Geophysical Monograph Series vol. 150 225–237 (Blackwell Publishing Ltd, 2004).
- 2Intergovernmental Panel on Climate Change. Water Cycle Changes. in Climate Change 2021 – The Physical Science Basis 1055–1210 (Cambridge University Press, 2023).
- 3Zhou, J. et al. Using stable isotopes as tracer to investigate hydrological condition and estimate water residence time in a plain region, Chengdu, China. Sci Rep 11 (2021).10.1038/s 41598-021-82349-3PMC 785461833531607 · doi ↗ · pubmed ↗
- 4Glas, R. et al. A review of the current state of knowledge of proglacial hydrogeology in the Cordillera Blanca, Peru. Wiley Interdisciplinary Reviews: Water 5 (2018).
- 5Takahashi, K. The atmospheric circulation associated with extreme rainfall events in Piura, Peru, during the 1997-1998 and 2002 El Niño events. vol. 22 (2004).
- 6Takahashi, K., Montecinos, A., Goubanova, K. & Dewitte, B. ENSO regimes: Reinterpreting the canonical and Modoki El Nio. Geophys Res Lett 38 (2011).
- 7Peng, Q., Xie, S. P., Wang, D., Zheng, X. T. & Zhang, H. Coupled ocean-atmosphere dynamics of the 2017 extreme coastal El Niño. Nat Commun 10 (2019).10.1038/s 41467-018-08258-8PMC 633680930655541 · doi ↗ · pubmed ↗
- 8Ampuero, A. et al. The Forest Effects on the Isotopic Composition of Rainfall in the Northwestern Amazon Basin. Journal of Geophysical Research: Atmospheres 125 (2020).